
The Updated DFW Map: What Changed in 2023 and Why It Matters
If you are getting ready to sell a home or buy a home in the Dallas-Fort Worth area, here is something most people miss. The official map of DFW changed in 2023, and the boundaries you picture in your head probably no longer match the boundaries the government uses.
I am Oleg Sedletsky, a Dallas-Fort Worth Realtor and Mortgage Loan Originator, and I pay close attention to these details because they quietly shape pricing, competition, and the decisions my clients make.
Let me walk you through what changed, what stayed the same, and why any of it should matter to you when you sell a house or start the home buying process in North Texas.
Key Takeaways
| In 2023, the U.S. Office of Management and Budget redrew the Dallas-Fort Worth-Arlington Metropolitan Statistical Area. It now includes 11 counties, down from 13. | |
| The Dallas-Fort Worth-Arlington MSA splits into two metropolitan divisions: Dallas-Plano-Irving and Fort Worth-Arlington-Grapevine. | |
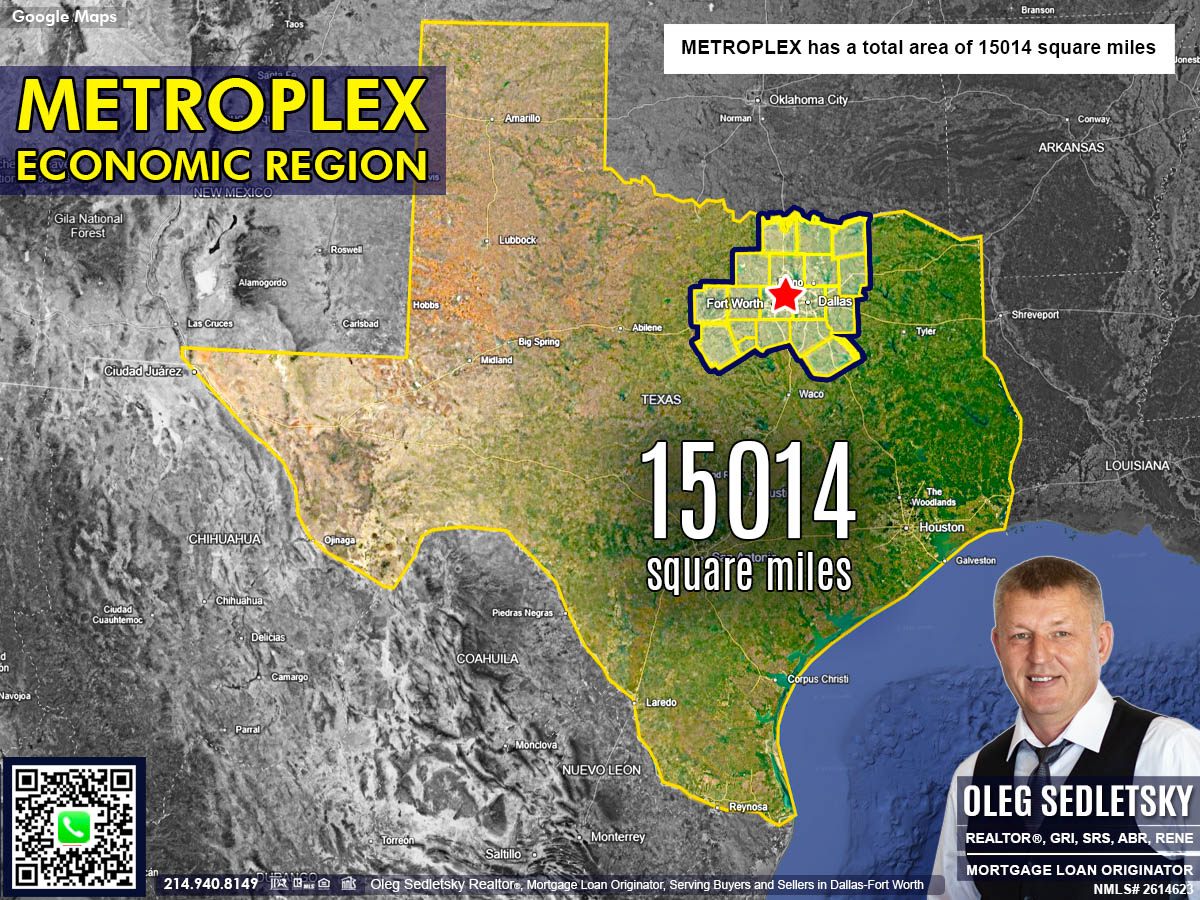
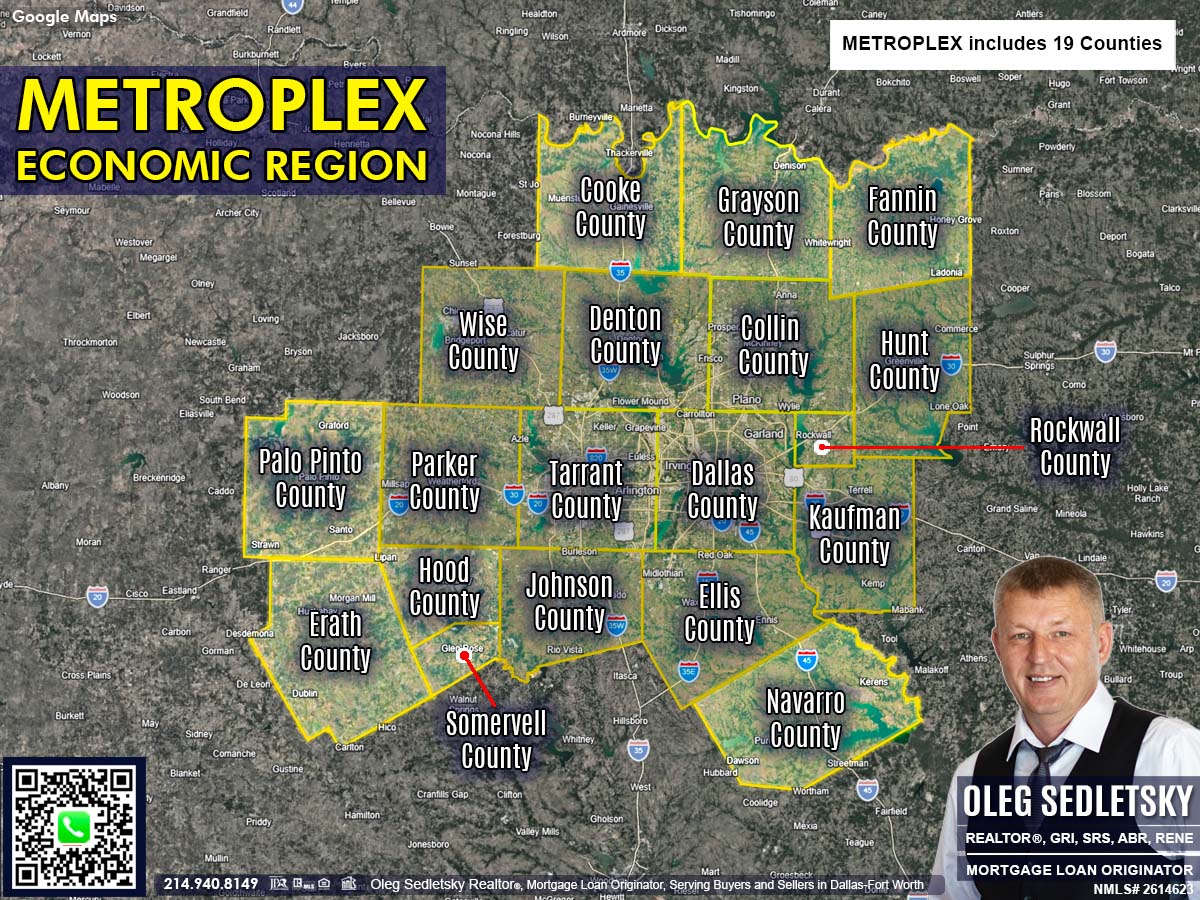
| The broader Texas Metroplex economic region is much larger, covering 19 counties and more than 15,000 square miles. | |
| County lines, commuting ties, jobs, transportation, schools, hospitals, and affordability all influence property value. | |
| As an experienced Dallas-Fort Worth real estate agent with 6 designations and certifications, I use this data to help my clients price, compete, and decide with confidence. |
The DFW Map Quietly Changed in 2023
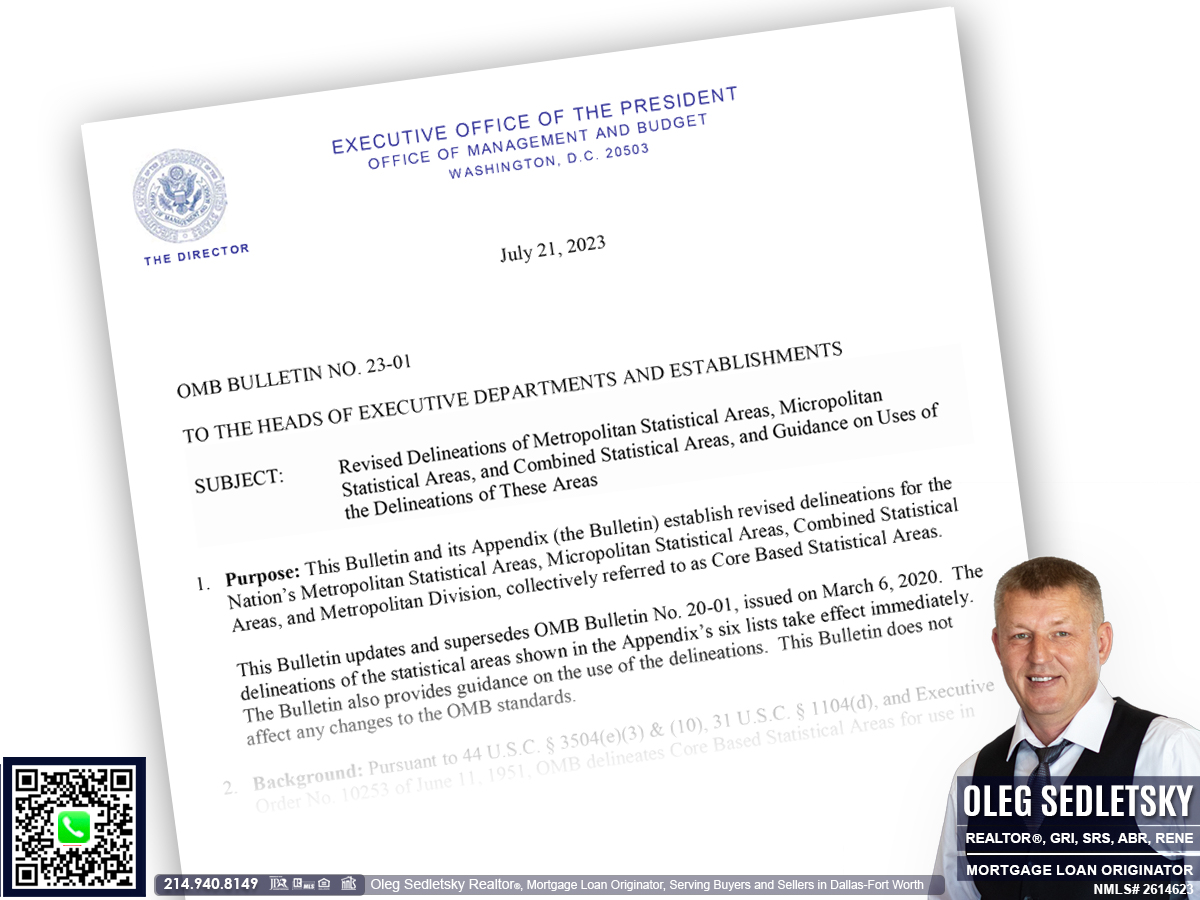
In July 2023, the U.S. Office of Management and Budget released Bulletin 23-01. That document updated the official boundaries for the country’s Metropolitan Statistical Areas, Micropolitan Statistical Areas, Combined Statistical Areas, and Metropolitan Divisions, which together are called Core Based Statistical Areas.
Dallas-Fort Worth was redrawn to reflect how fast the area has grown. Before the update, the Dallas-Fort Worth-Arlington statistical area covered 13 counties. After the update, the official picture is different, and most home sellers and homebuyers I talk to have not heard about it.
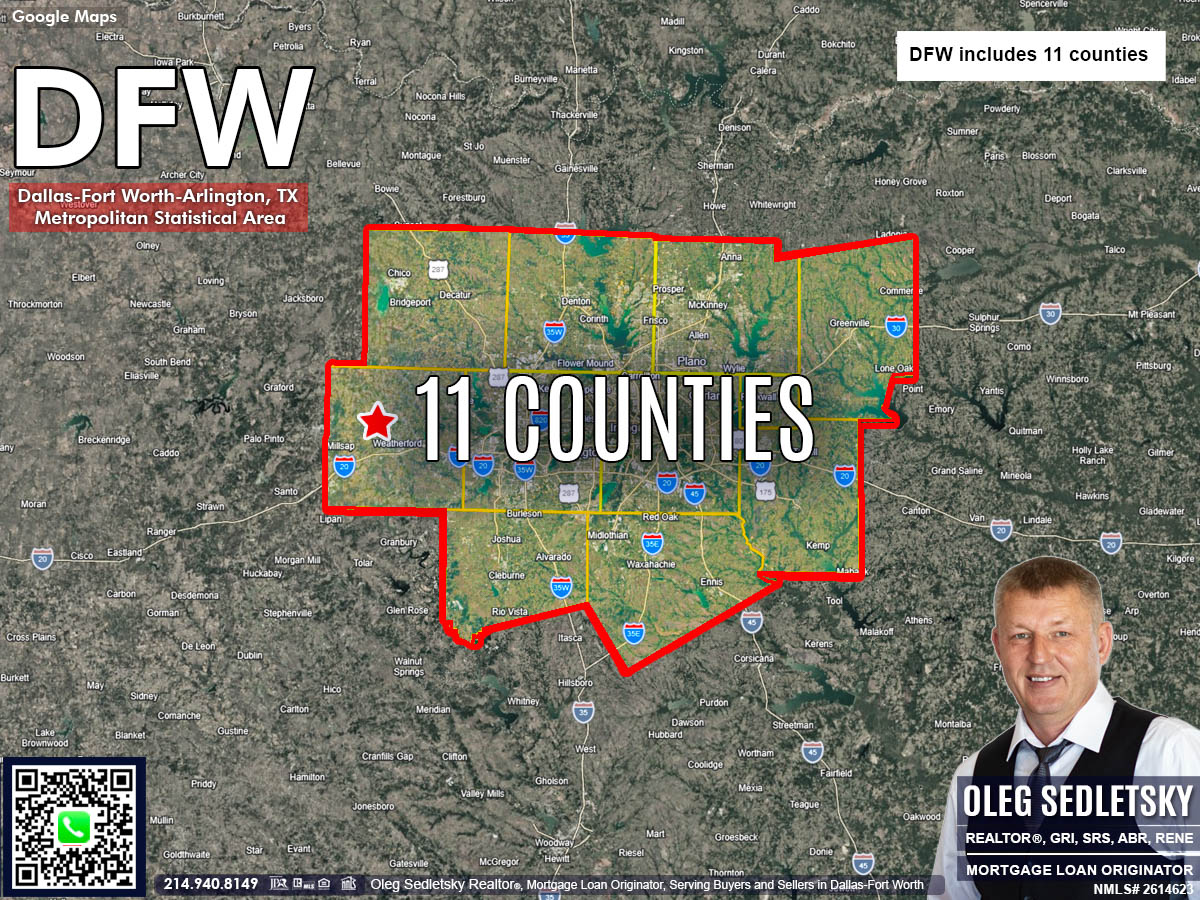
The 11-County Dallas-Fort Worth-Arlington MSA
The Dallas-Fort Worth-Arlington, TX Metropolitan Statistical Area now covers 11 counties.
Its principal cities are Dallas, Fort Worth, Arlington, Plano, Irving, Denton, Richardson, and Grapevine.
The number to remember is 11 counties, not 13. Two counties, Hood and Somervell, were dropped from the official Dallas-Fort Worth-Arlington MSA because they no longer met the updated standards.
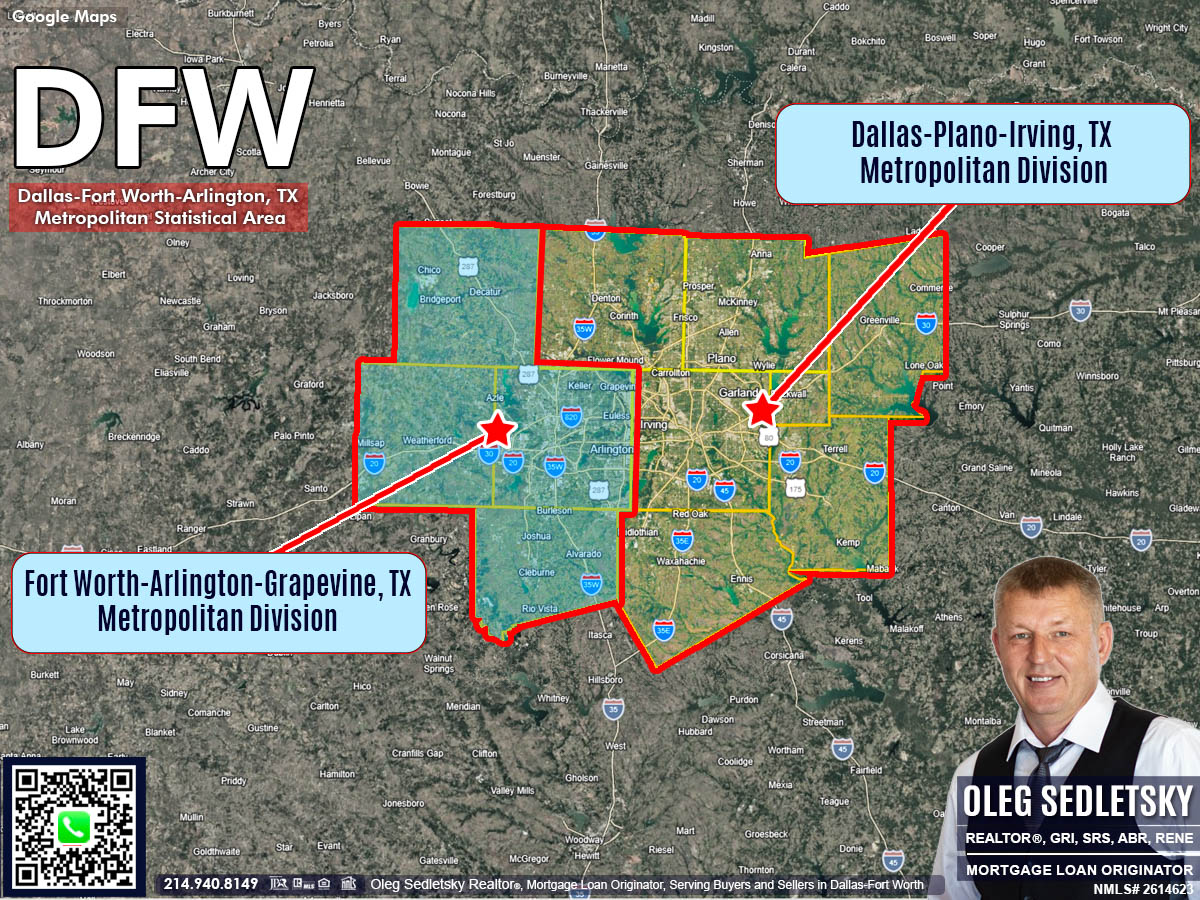
Two Metropolitan Divisions Inside DFW
Because the area is so large, the MSA is split into two parts.
The Dallas-Plano-Irving, TX Metropolitan Division holds seven counties: Collin, Dallas, Denton, Ellis, Hunt, Kaufman, and Rockwall.
The Fort Worth-Arlington-Grapevine, TX Metropolitan Division holds four counties: Johnson, Parker, Tarrant, and Wise.
DFW by the Numbers: Key Stats
Before getting into what the boundary changes mean for your specific situation, it helps to step back and appreciate the sheer size of what we are talking about.
The Dallas-Fort Worth area is not just large — it is one of the most significant metropolitan regions in the entire country, and the numbers back that up.
- The DFW-Arlington MSA ranks as the 4th-largest metropolitan area in the United States, with a 2025 population estimate of 8,477,157.
- Dallas-Fort Worth-Arlington MSA is home to over 200 cities and towns, 24 Fortune 500 companies, a GDP of roughly 744 billion dollars, nearly 4 million jobs, and the second-busiest airport in the country by passenger traffic.
- The population grew by more than 11 percent between 2020 and 2025.
- The official DFW MSA now covers 11 counties.
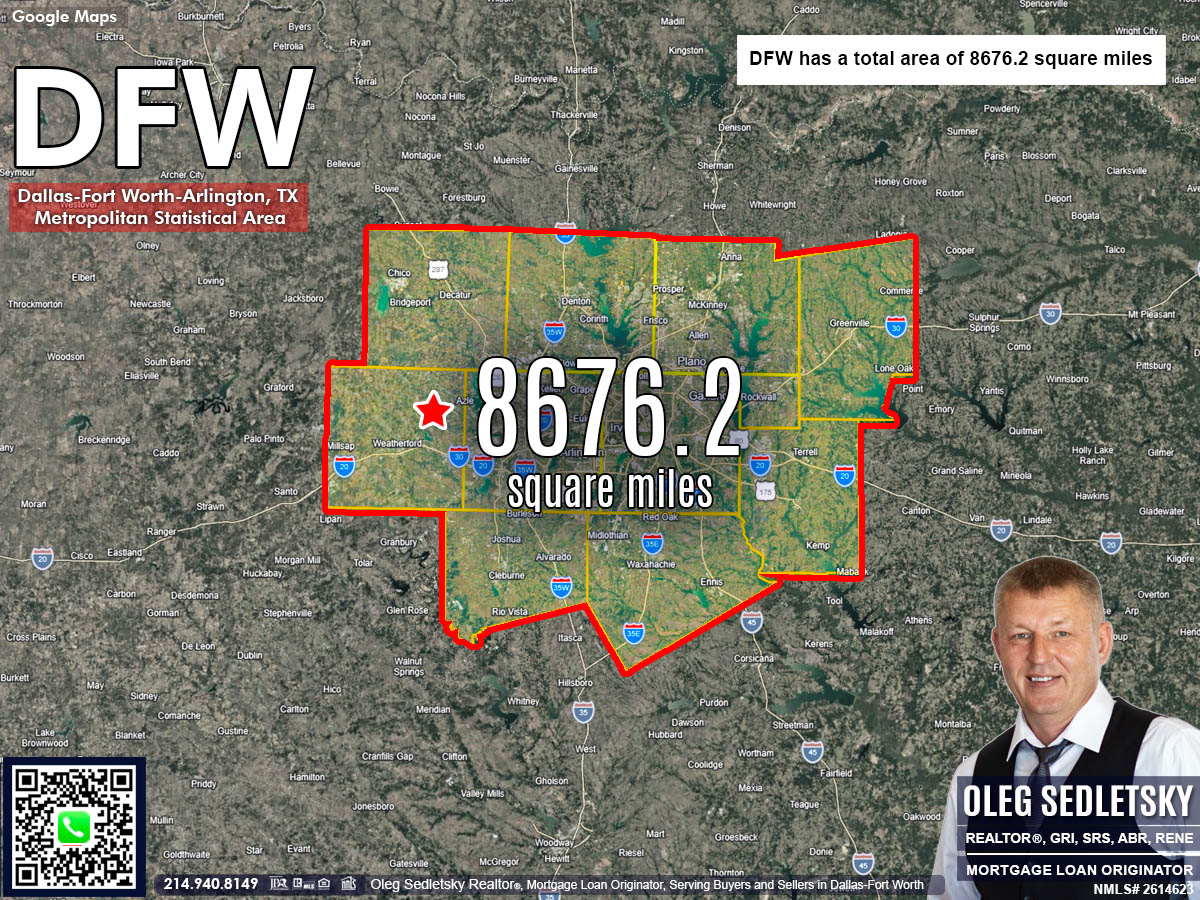
- Dallas-Fort Worth-Arlington MSA encompassing 8,676.2 square miles
When you understand just how large and economically complex the DFW is, it becomes clear why boundary lines, county divisions, and local data are not just technicalities — they are the foundation of every sound real estate decision made here.
The DFW MSA and the Texas Metroplex Region Are Not the Same Thing
This is where many people get confused, and the confusion is understandable. The official MSA has one set of boundaries. The Metroplex Economic Region has a separate and larger set of boundaries.
Texas is divided into 12 economic regions, tracked and reported by the Texas Comptroller’s office. Dallas-Fort Worth sits inside the one called the Metroplex Region.
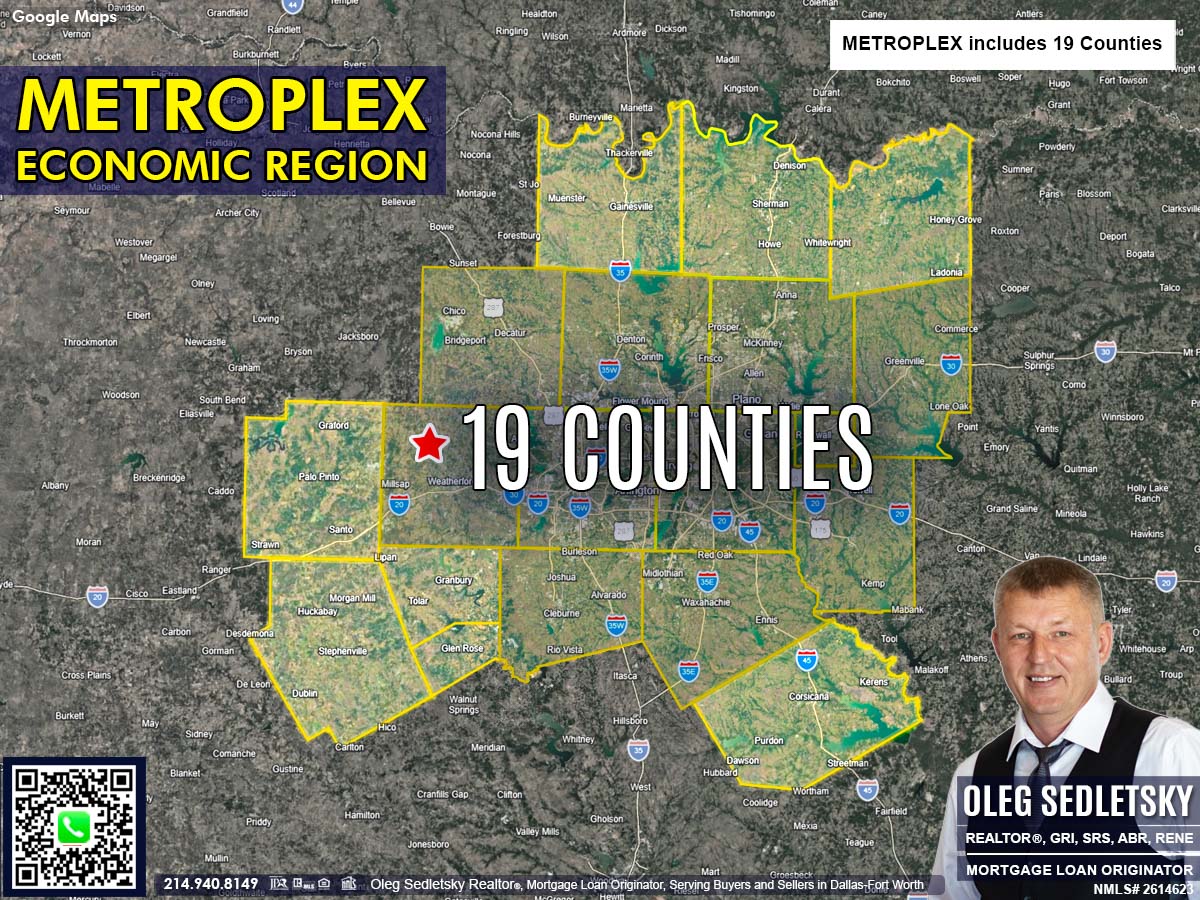
How Big the Metroplex Region Really Is
The Metroplex region covers 19 counties and more than 15,000 square miles. It reaches from Oklahoma in the north down to the Brazos River, and from the Cedar Creek Reservoir in the east to Possum Kingdom Lake in the west.
In 2025, the Metroplex region had a population of about 8,927,141, with population growth above 21 percent between 2014 and 2024.
Inside the Metroplex region, you will find two Metropolitan Statistical Areas (Dallas-Fort Worth-Arlington MSA and Sherman-Denison MSA), plus six Micropolitan Statistical Areas: Bonham, Corsicana, Gainesville, Granbury, Mineral Wells, and Stephenville.
Metro, Micro, and One County on Its Own
The 19 counties in Metroplex Region break down this way:
Metropolitan counties (12): Grayson, Collin, Dallas, Denton, Ellis, Hunt, Kaufman, Rockwall, Johnson, Parker, Tarrant, and Wise.
Micropolitan counties (6): Erath, Palo Pinto, Cooke, Navarro, Fannin, and Hood.
Non-CBSA county (1): Somervell belongs to the Metroplex region but currently sits in no metropolitan or micropolitan area.
So Hood and Somervell counties stepped outside the official DFW MSA, yet both still belong to the wider Metroplex Region story. That distinction affects how buyer demand, pricing, and growth read across those communities.
Why These Boundaries Affect Your Property Value
A city name is a starting point, not the full answer. When I study a property for a client, I look at what genuinely drives value across the Dallas-Fort Worth area.
- County lines and commuting ties. These decide which market a home truly competes in. Two homes that look similar can sit in different markets once you account for commuting patterns.
- Employer concentration. The Metroplex region produced roughly 767.6 billion dollars in GDP in 2023, with strength in information, logistics, and technology jobs. Where the jobs cluster, demand tends to follow.
- Transportation. Major highways, transit options, and Dallas-Fort Worth International Airport shape daily life and buyer interest.
- Hospitals and health care. Access to general and specialized hospitals adds appeal to a neighborhood.
- Schools and education. A region with strong universities and colleges draws families and working professionals.
- Affordability. Local income measured against home prices tells you how competitive a market is. The Metroplex region had a median household income of around $90,824 dollars in 2024, higher than the Texas figure.
Reading these factors together is part of how I price a home and advise a buyer. The map boundaries are one piece. The local detail is what makes the number land correctly.
What This Means When You Are Selling a Home in Dallas-Fort Worth
When you sell a house, your address tells only part of the story. Buyers compare your home to others in the same market, and these boundaries help define that market.
Setting the right price is a balancing act. Price too high and serious buyers scroll past. Price too low and you give away equity that was yours to keep.
To find the right number, I study county data, city trends, and neighborhood activity together, then back every recommendation with current figures rather than a gut feeling.
The home-selling process runs more smoothly when expectations rest on facts. As a DFW Realtor holding the SRS (Seller Representative Specialist) designation, my focus is protecting your interests and your net proceeds from listing through closing.
Talk to a knowledgeable Dallas-Fort Worth Realtor before you list.
If you are planning to sell a home in the Dallas-Fort Worth area and want representation grounded in real market data, contact me!
I will review your situation and lay out a clear pricing and listing strategy

What This Means When You Are Buying a Home in Dallas-Fort Worth
For buyers, these boundaries help you compare options fairly. A home in the Dallas-Plano-Irving division can carry a different price and lifestyle than a similar home in the Fort Worth-Arlington-Grapevine division, even though both sit inside the same MSA.
With affordability constantly shifting, it’s another good reason to closely examine which counties fit your budget.
As a DFW Realtor holding the ABR (Accredited Buyer Representative) designation, I guide buyers through the home-buying process, one clear step at a time. Because I am also a Mortgage Loan Originator, I connect the financing side with the search side, so you understand both the home and the loan that supports it.
Looking to Buy in DFW? Your Accredited Buyer Representative Is Here to Help
Buying a home in the Dallas-Fort Worth area is a significant life event. It can be exciting, but it can also be very complex.
Contact me today! I’m here to help with both your search and your financing.

Why Relocation Buyers Should Pay Close Attention
If you are moving to the Dallas-Fort Worth area from another state or another part of Texas, these distinctions matter even more. A familiar city name can hide real differences in commute, taxes, schools, and price per square foot once you cross a county line.
When I work with someone relocating, I start with the practical questions. Where will you work, and how far are you willing to drive? Which school districts matter to you? What does your budget actually buy in each division and county? From there, the official boundaries and the local data turn a broad search into a focused plan.
Frequently Asked Questions About the DFW and Metroplex Boundaries
How many counties are in the Dallas-Fort Worth MSA now?
The Dallas-Fort Worth-Arlington Metropolitan Statistical Area now includes 11 counties
What are the two metropolitan divisions inside DFW?
The DFW MSA splits into two metropolitan divisions:
Dallas-Plano-Irving Metropolitan Division, which holds Collin, Dallas, Denton, Ellis, Hunt, Kaufman, and Rockwall counties,
Fort Worth-Arlington-Grapevine Metropolitan Division, which holds Johnson, Parker, Tarrant, and Wise counties.
When did the DFW boundaries change?
The official DFW boundaries changed in July 2023, when the U.S. Office of Management and Budget released Bulletin 23-01. That update reduced the number of counties in the Dallas-Fort Worth-Arlington MSA from 13 to 11 and established two formal metropolitan divisions within it.
Who instituted the DFW boundaries change?
The DFW boundaries change was instituted by the U.S. Office of Management and Budget. The OMB is the federal agency responsible for setting and updating the standards that define Core Based Statistical Areas across the country, and it periodically reviews these standards to reflect shifts in population, commuting patterns, and economic ties between communities.
Why were Hood and Somervell counties removed from the DFW MSA?
Hood and Somervell were removed from the official Dallas-Fort Worth-Arlington MSA because they no longer met the updated standards for Core Based Statistical Areas. Somervell still sits inside the
broader Texas Metroplex region as a non-CBSA county.
What is the difference between the DFW MSA and the Texas Metroplex region?
The DFW MSA is the official 11-county metropolitan statistical area. The Texas Metroplex economic region is larger, covering 19 counties, more than 15,000 square miles, two metro areas (including DFW), six micropolitan areas, and one non-CBSA county. Both shape how a property is valued and compared. Texas is divided into 12 economic regions, tracked and reported by the Texas Comptroller’s office.
Why do the DFW boundaries matter when buying or selling a home?
The DFW boundaries influence pricing, buyer behavior, commuting ties, employer concentration, transportation access, schools, hospitals, and affordability. Knowing which market a home truly belongs to helps you price it correctly and compare it fairly, which protects your money on both sides of a transaction.
Is Any Real Estate Agent Equipped to Turn This Data Into Smart Decisions for You?
The honest answer is no. Not every agent can take this kind of data and turn it into a decision that protects your money.
You need a Realtor who is genuinely qualified to interpret this data and apply it to your situation, and who puts your interests first. Plenty of agents can recite a city name and pull a basic price estimate. Far fewer can read county lines, division boundaries, commuting patterns, and affordability shifts together, then turn all of that into a clear pricing and negotiation strategy.
I am Oleg Sedletsky, and I hold six real estate designations and certifications, along with specialized training and a Mortgage Loan Originator license. If every agent carried that level of preparation, the phrase “any Realtor can do this” might hold up. It does not. That gap in training, market analysis skill, negotiation ability, and financing knowledge is exactly what separates a guess from a sound decision.
Here is how that difference shows up in practice:
- Pricing. A generic agent may price your home off the nearest comparable sales. I look at which metropolitan division your property sits in, how county-level demand is trending, and whether buyers in your specific area are gaining or losing affordability, so the number reflects the market you actually compete in.
- Strategy. When two similar homes sit in different counties or divisions, they often attract different buyers for different reasons. I use that to position your listing or your offer where it has the strongest pull.
- Negotiation. Data gives me leverage. Knowing employer concentration, commuting ties, and local supply lets me defend your price with facts instead of opinion.
- Financing awareness. Because I am also a licensed Mortgage Loan Originator, I connect the property to the loan that supports it. I can flag how a buyer’s financing might affect your sale, or help a buyer understand what their budget truly reaches across each county.
- Protecting your interests. Credentials only matter if they serve you. My job is to make your goals the priority and keep your money protected on both sides of a transaction.
So the right move is simple. Look for a Dallas-Fort Worth Realtor who is qualified to read this information correctly, who backs advice with real numbers, and who treats your interests as the point of the entire process.

A Final Word for Sellers and Buyers in North Texas
If you are reading this article, you have probably already seen how many different DFW numbers are floating around online. The reality is that finding accurate information today is often harder than it should be. AI-generated content can mix official sources with questionable ones and present mistakes confidently. Some official websites are slow to reflect recent updates, and the best source material is not always easy for the average buyer or seller to find, verify, and interpret correctly.
That is exactly why I took the time to research, sort through the conflicting information, and write this article. My goal is to give buyers and sellers reliable, useful information and save them a tremendous amount of time before they make a move. The honest question is: how many Realtors actually do that for you?
If you are serious about selling a home or buying a home in the Dallas-Fort Worth area and want representation built on real data and a clear strategy, I would welcome the conversation.
I am here to represent you through your sale or purchase in North Texas.
Data current as of June 2026
Sources: U.S. Census Bureau; U.S. Bureau of Economic Analysis; JobsEQ; Texas Comptroller of Public Accounts