
Blue Ridge, TX Real Estate: 2020 Analysis of the Single-Family Residential Housing Market
The 2020 real estate market in Blue Ridge, TX demonstrated remarkable resilience and adaptability despite the challenges posed by the COVID-19 pandemic. With 41 homes sold during the year, both buyers and sellers displayed continued confidence in the housing market. The year was characterized by significant growth in the luxury segment, along with rising property valuations and enhanced market efficiency.
The pandemic created shifts in consumer priorities, with many individuals seeking homes that offered more space and comfort to accommodate remote work and lifestyle changes. Additionally, historically low mortgage rates and a diverse range of property offerings contributed to making 2020 a surprisingly dynamic and resourceful year for Blue Ridge’s real estate sector, even amidst unprecedented global uncertainty.
Key Takeaways and Trends from Blue Ridge’s 2020 Real Estate Market
Pricing Range: The rise in maximum price to $695,000 was a notable indicator of revitalized interest in premium homes. However, the minimum price drop to $61,300 maintained the inclusivity of the Blue Ridge, TX housing market.
Market Efficiency: Improved close price ratios and a reduction in maximum DOM demonstrated smoother transactions and better expectations alignment between buyers and sellers.
Unique Outliers: Larger-than-average lots and increasing price-per-square-foot suggested a growing preference for quality acreage and premium materials.
Total Homes Closed
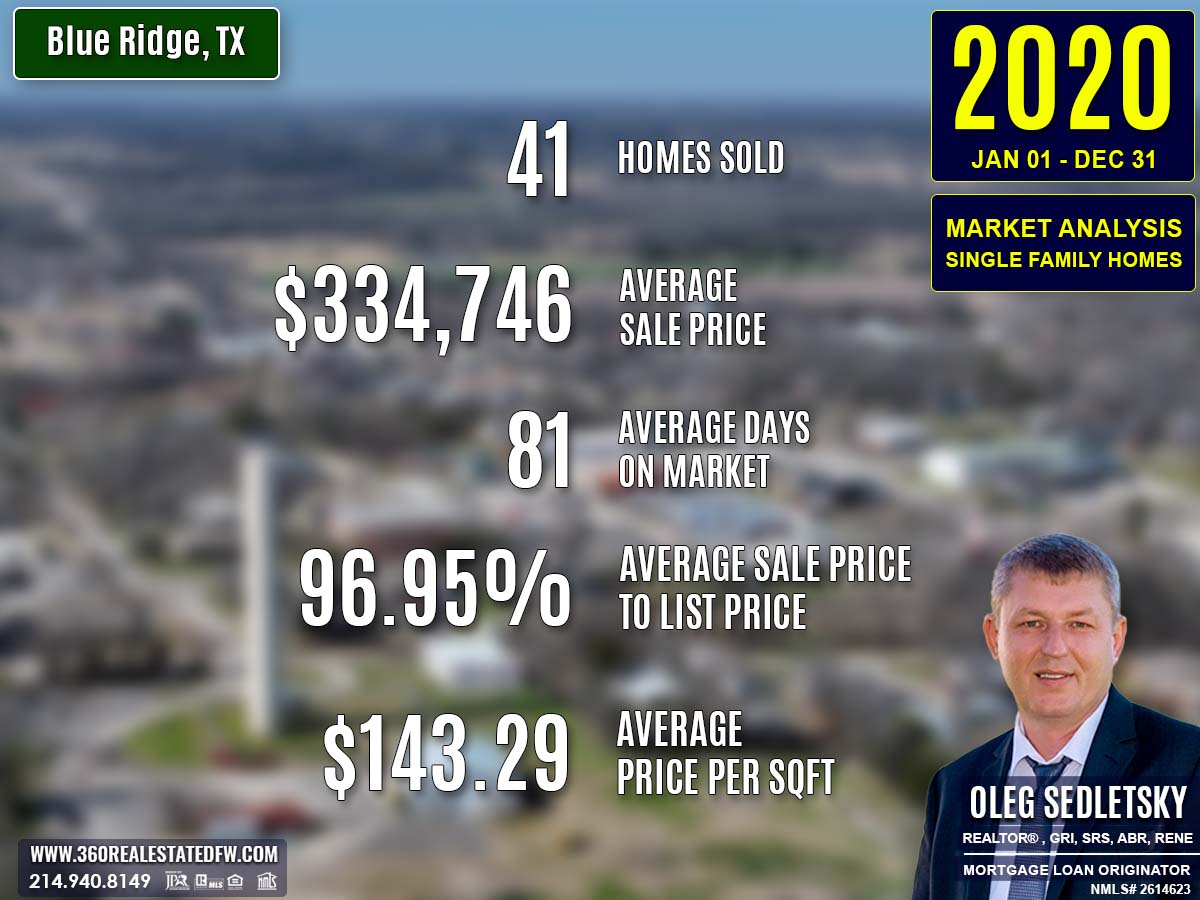
A total of 41 residential single-family homes were sold in 2020, reflecting sustained buyer interest in the local market despite a slight decline from 2019’s total of 45 homes closed. This stability exemplifies the strong demand even during a period of global uncertainties.
Property Pricing Insights
The pricing trends in 2020 emphasized growth in mid-to-high tiers of the market:
- Minimum Price: Decreased to $61,300, offering affordable entry-level opportunities.
- Maximum Price: Jumped to $695,000, highlighting increased activity in premium properties.
- Average Price: Rose to $334,746 from $307,110 in 2019, showcasing increased buyer willingness to invest in higher-value homes.
- Median Price: Climbed to $359,000, up from $340,000 in 2019, demonstrating a robust mid-market segment.
Property Size and Features
Bedrooms and Bathrooms
- Bedrooms: Homes ranged from 2 to 5 bedrooms, with an average of 4 bedrooms, consistent with 2019 trends.
- Bathrooms: Properties offered up to 6 baths, with an average of 3, maintaining a comfortable mix for families and individuals.
Square Footage
- Minimum Size: Slightly declined to 888 sq. ft., reflecting smaller housing options at the entry level.
- Maximum Size: Decreased to 4,438 sq. ft., from 5,620 sq. ft., revealing a shift toward more manageable spaces in the high-end range.
- Average Size: Marginally decreased to 2,391 sq. ft., down from 2,465 sq. ft. in 2019.
- Median Size: Increased to 2,425 sq. ft., up from 2,316 sq. ft., showing greater demand for spacious mid-market properties.
Lot Size
- Minimum Lot Size: Increased to 0.254 acres, from 0.130 acres, offering more expansive properties at the lower end.
- Maximum Lot Size: Fell to 30.109 acres, down from 33.260 acres, indicating a narrowing in ultra-large lot availability.
- Average Lot Size: Rose to 3.571 acres, signaling a preference for larger-than-average properties.
Market Dynamics
Days on Market (DOM)
- Minimum DOM: Increased to 3 days from 2 days in 2019, indicating slightly slowed sales efficiency for the fastest-moving listings.
- Maximum DOM: Reduced to 277 days, from 399 days, showcasing more efficient high-tier transactions.
- Average DOM: Remained stable at 81 days, consistent with 2019’s pace.
Close Price Ratios
- ClsPr/LstPr (Close Price to Listing Price): Improved to 96.95%, up from 96.16% in 2019, reflecting stronger alignment between initial listings and final sale prices.
- ClsPr/OLP (Close Price to Original Listing Price): Increased to 95.06%, compared to 94.23% in 2019, underscoring reduced negotiation margins.
Price Per Square Foot
- Pr$/SqFt (Price Per Square Foot): Rose to $143.29, up from $127.87 in 2019, signaling elevated valuations for property scale and location.
Insights into the Most Expensive Blue Ridge, TX Property Sold in 2020
A standout feature of 2020 was the sale of the year’s most expensive property. This high-value estate reflected the growing upper-tier demand even in a competitive market climate.
Key Highlights:
- Price: $695,000
- Bedrooms: 3
- Bathrooms: 3 (all full baths)
- Square Footage: 4,438 sq. ft.
- Price Per Square Foot: $156.60
- Lot Size: 30.109 acres
- Days on Market: 254 days
- ClsPr/LstPr Ratio: 92.67%
- ClsPr/OLP Ratio: 92.67%
- Year Built: 1996
This property exemplified luxury with its large living space and expansive lot, though its extended time on the market highlighted the challenges of selling high-end properties.
Economic context
Average Electricity Costs in Dallas-Fort Worth in 2020
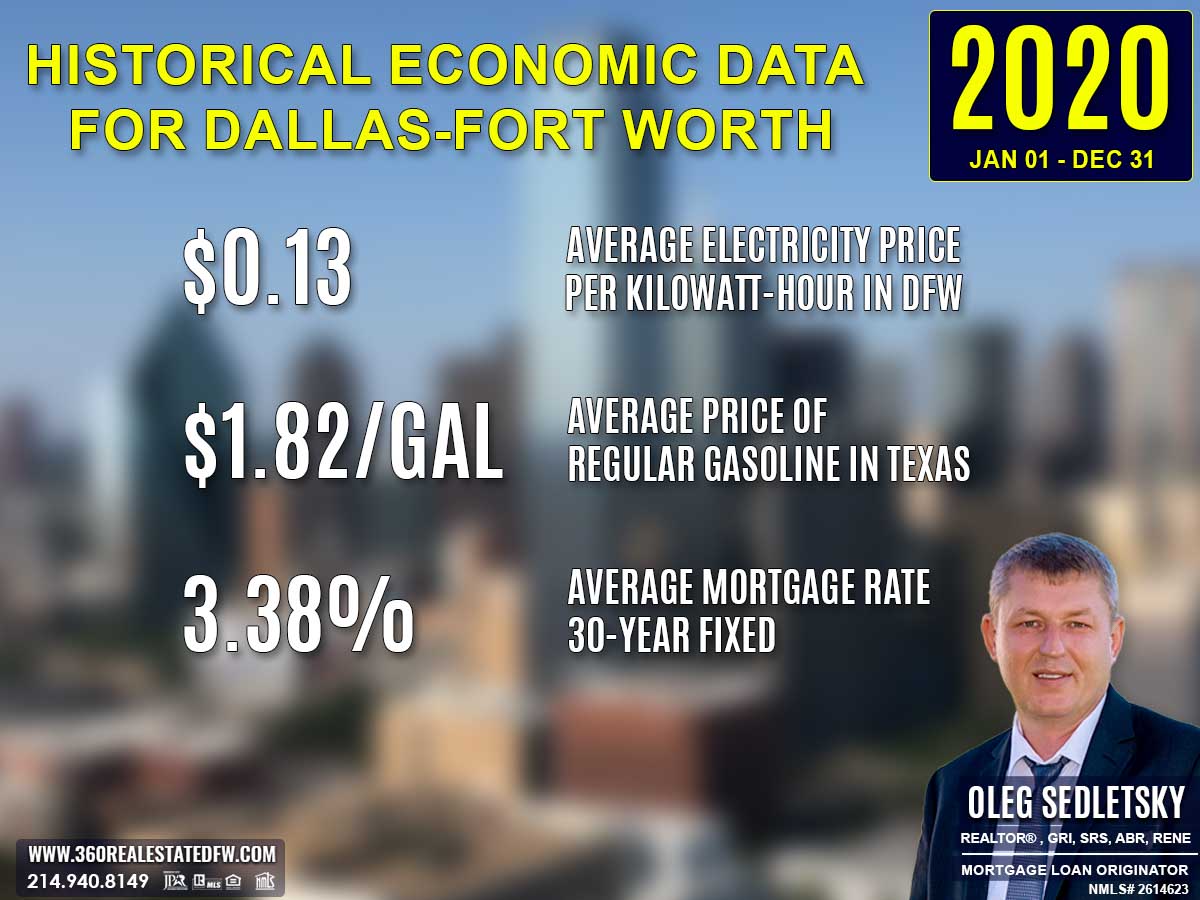
The average electricity cost per kilowatt-hour decreased slightly to $0.13, down from $0.14 in 2019. This drop provided homeowners with modest savings on utility expenses.
Texas Average Gas Prices in 2020
Average gas prices dropped significantly to $1.82 per gallon, compared to $2.29 in 2019. This reduction likely eased transportation costs for residents substantially.
Average 30-Year Fixed Mortgage Rate in 2020
The average 30-year fixed mortgage rate in 2020 dropped to 3.38%, a significant reduction compared to the 4.13% rate from the previous year. This decline in rates made home financing more affordable, allowing homebuyers to stretch their budgets and qualify for larger home loans. Lower borrowing costs were especially important during a year marked by economic uncertainties, helping to sustain activity in the housing market and offering buyers a rare opportunity to secure favorable terms.
Curious about today’s mortgage rates and the home you can comfortably afford?
Submit a no-obligation mortgage application today and get pre-approved to determine your budget and take the first step toward homeownership with confidence.
Summary of Differences Between 2019 and 2020 Real Estate Data for Blue Ridge, TX
The 2020 real estate market in Blue Ridge, TX revealed a mix of rising property values, slight changes in property features, and improvements in market efficiency compared to 2019. Key differences are detailed below:
Property Pricing
- Minimum Price: Fell to $61,300 from $70,000 in 2019, indicating more affordable entry-level options.
- Maximum Price: Surged to $695,000, up from $508,474, highlighting renewed activity in the luxury segment.
- Average Price: Increased to $334,746 from $307,110, marking stronger mid-to-high-market demand.
- Median Price: Grew to $359,000 from $340,000, signaling continued upward momentum in mid-market homes.
Property Features
- Bedrooms: Minimum beds increased to 2 from 1 in 2019, while average and maximum beds remained steady at 4 and 5 respectively.
- Bathrooms: Maximum baths rose to 6, up from 7 in 2019. Average baths stayed unchanged at 3 bathrooms per home.
- Square Footage:
- Minimum Size: Slightly decreased to 888 sq. ft. from 900 sq. ft., offering smaller housing options.
- Maximum Size: Decreased to 4,438 sq. ft., down from 5,620 sq. ft., reflecting a narrower high-end range.
- Average Size: Declined modestly to 2,391 sq. ft., from 2,465 sq. ft., demonstrating a marginal contraction in space.
- Median Size: Grew to 2,425 sq. ft., compared to the previous year’s 2,316 sq. ft., reinforcing mid-range property appeal.
Lot Size
- Minimum Lot Size: Increased to 0.254 acres from 0.130 acres, indicating slightly larger entry-level plots.
- Maximum Lot Size: Declined to 30.109 acres, from 33.260 acres, suggesting more manageable high-end land sizes.
- Average Lot Size: Rose to 3.571 acres, up from 2.992 acres, reflecting generally larger lots across the board.
Market Dynamics
-
Days on Market (DOM):
- Minimum DOM: Increased to 3 days from just 2 in 2019, showing slightly less rapid turnaround for the quickest sales.
- Maximum DOM: Dropped to 277 days, down from 399 days, reflecting shorter sale timelines at the higher end.
- Average DOM: Remained stable at 81 days, consistent with last year’s pace.
-
ClsPr/LstPr Ratio: Improved to 96.95%, up from 96.16%, showing better alignment between listing and closing prices.
-
ClsPr/OLP Ratio: Increased to 95.06%, compared to 94.23%, signaling reduced negotiation gaps and firmer seller control.
-
Price Per Square Foot: Rose to $143.29, up from $127.87, indicating higher unit values per square foot.
Year Built
- Oldest Property Built: Shifted forward to properties built in 1945, compared to 1910 in 2019.
- Newest Property Built: Remained consistent at 2020, showcasing new construction activity.
- Average Year Built: Moved forward to 2001 from 1999, reflecting a younger inventory overall.
- Median Year Built: Increased to 2015, from 2012, hinting at more recent housing stock for mid-market buyers.
Key Market Trends
- Luxury Home Growth: An increase in the maximum price, alongside higher square footage pricing, suggests rising demand for premium homes despite slightly smaller high-end properties.
- Improved Efficiency: Stronger close price ratios and a decline in maximum DOM indicate improved transaction processes and buyer confidence.
- Mid-Market Strength: Rising median prices and lot sizes reinforced growth in the mid-tier market, balancing premiums with affordability.
The 2020 market displayed resilience and growth, adapting to shifting buyer preferences while balancing affordability with high-end demand. It maintained stability in pace and efficiency while showcasing new opportunities across market segments.
Summary of Real Estate Market Analysis for Blue Ridge, TX in 2020
The 2020 real estate market in Blue Ridge, TX exemplified resilience and adaptability during an unprecedented year marked by the global COVID-19 pandemic. The market maintained a steady performance, with 41 homes closed, and saw notable growth in property values, particularly in the mid-to-high-tier segments. HomeBuyers, galvanized by historically low mortgage rates of 3.38%, sought properties that offered larger square footage, enhanced outdoor spaces, and features that suited a work-from-home lifestyle. Home Sellers benefited from firmer close price ratios, improved market efficiency, and sustained demand across all price points.
Key trends, such as rising property valuations and increasing per-square-foot prices of $143.29, demonstrated confidence in the market’s growth potential. While the pandemic temporarily affected economic conditions, the real estate sector adapted quickly, with buyers prioritizing lifestyle-oriented features and sellers optimizing returns through efficient transactions.
Ultimately, amidst uncertainties, the Blue Ridge, TX real estate market proved dynamic and robust, paving the way for future growth and innovation in housing solutions. Both buyers and sellers benefited from an environment defined by opportunity, flexibility, and resilience.
Why Statistics Data is Important
Understanding past market data is essential for making informed decisions in today’s real estate landscape. Historical statistics provide a foundational perspective on trends, aiding in fair pricing and negotiation.
Unlock Exceptional Service!
Assistance with all your real estate needs in the Dallas-Fort Worth area is just a click or call away. Reach out at 214-940-8149 or connect through the links below.

Oleg Sedletsky REALTOR® in Blue Ridge, Texas. Call/Text 214.940.8149
Greetings! I’m Oleg Sedletsky, and I’m excited to introduce myself as your go-to full-time licensed Texas REALTOR® and Mortgage Loan Originator.
I proudly represent JPAR® – Real Estate Brokerage as a REALTOR® and Utopia Mortgage LLC as a Mortgage Loan Originator! My designations and certifications reflect my dedication to helping you achieve your real estate goals in Blue Ridge, TX and other locations in the vibrant Dallas-Fort Worth area!
My commitment to ongoing professional development means I’m always enhancing my skills to serve you better. You can count on me as your trusted expert throughout your real estate journey. Plus, I’m fluent in English, Ukrainian, and Russian and ready to assist you every step of the way!
It’s All About You and Your Real Estate Dreams!
My mission is to serve you! With my knowledge and expertise, I’m here to help you achieve all your real estate goals and turn your dreams into reality!
I’m passionate about helping buyers and sellers navigate the exciting real estate landscape in Blue Ridge, Texas! Whether you’re searching for your dream home, exploring land options, or looking for commercial properties, my Real Estate Services have you covered.
Contact me today for all your real estate needs in Blue Ridge, Texas! Call/text 214-940-8149

Discover Yearly Real Estate Market Trends for Blue Ridge, TX
2003-2010
Blue Ridge, TX Real Estate Market in 2003
Blue Ridge, TX Real Estate Market in 2004
Blue Ridge, TX Real Estate Market in 2005
Blue Ridge, TX Real Estate Market in 2006
Blue Ridge, TX Real Estate Market in 2007
Blue Ridge, TX Real Estate Market in 2008
2011-2020
Blue Ridge, TX Real Estate Market in 2011
Blue Ridge, TX Real Estate Market in 2012
Blue Ridge, TX Real Estate Market in 2013
Blue Ridge, TX Real Estate Market in 2014
Blue Ridge, TX Real Estate Market in 2015
Blue Ridge, TX Real Estate Market in 2016
Blue Ridge, TX Real Estate Market in 2017
Blue Ridge, TX Real Estate Market in 2018
This market analysis is intended solely for educational purposes. This market analysis is based on data sourced from NTREIS, Inc. This analysis is exclusively focused on single-family homes and does not account for other property types. The total number of real estate transactions within the specified period and location may vary. Data accuracy cannot be guaranteed due to potential input errors made by NTREIS users. This market analysis does not account for all new construction home sales. If you need detailed information about recorded property sales or other public records, please contact the appropriate city or county office.
Blue Ridge, TX Real Estate: 2019 Analysis of the Single-Family Residential Housing Market
The 2019 real estate market in Blue Ridge, TX showcased an evolving landscape with increased transaction volumes, larger homes, and a robust mid-market segment. A total of 45 homes were sold during the year, highlighting a surge in activity compared to 2018, alongside significant changes in pricing, property characteristics, and economic factors. The year reflected a balanced market that catered to diverse buyer preferences, offering affordability and high-value opportunities.
Key Takeaways and Trends from Blue Ridge’s 2019 Real Estate Market
Pricing Range:
- Rising minimum and median prices highlighted stronger demand for mid-market and entry-level properties.
- A decline in the maximum price signified reduced activity or buyer pushback in the luxury segment.
Market Efficiency:
- Faster minimum DOM reflected high buyer interest in desirable listings, while longer maximum DOM pointed to market variability.
- Improved close price ratios indicated alignment of buyer and seller expectations.
Unique Outliers:
- The increase in larger homes and expansive lot sizes catered to buyers seeking premium and family-friendly properties.
- A drop in price per square foot made the market more accessible despite rising average and median prices.
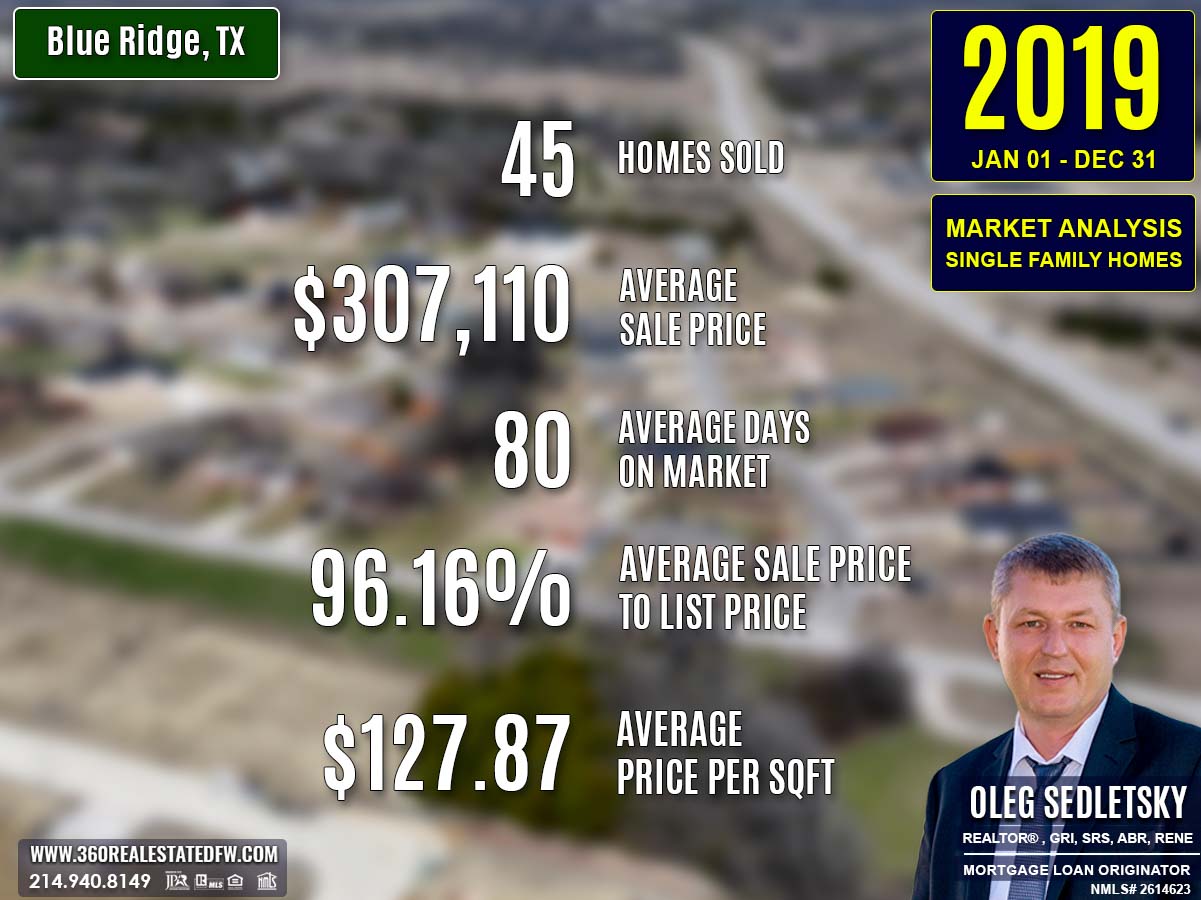
Total Homes Closed
The year concluded with 45 residential single-family homes sold, an increase from the 41 homes closed in 2018. This uptick in sales volume signifies growing buyer interest and confidence in Blue Ridge’s residential market.
Property Pricing Insights
Prices in 2019 painted a picture of diversity and opportunity:
- Minimum Price: Rose to $70,000, up from $55,000 in 2018, showcasing higher valuations in the affordable housing sector.
- Maximum Price: Dropped to $508,474, slightly below the $520,000 high of 2018, indicating less activity in the luxury segment.
- Average Price: Increased to $307,110, up from $283,632, reflecting robust mid-market demand.
- Median Price: Jumped to $340,000, from $302,000 in 2018, further highlighting stronger mid-range market trends.
Property Size and Features
Bedrooms & Bathrooms
- Bedrooms: Homes ranged from 1 to 6 bedrooms, with an average of 4 bedrooms per property, up from 3 in 2018.
- Bathrooms: The number of bathrooms saw growth, with properties featuring up to 7 baths, averaging 3 bathrooms.
Square Footage
- Minimum Size: Held steady at 900 sq. ft., indicating inclusivity in the lower size range.
- Maximum Size: Increased significantly to 5,620 sq. ft., up from 4,012 sq. ft., signaling larger homes entering the market.
- Average Size: Rose to 2,465 sq. ft., from 2,184 sq. ft., showing a clear trend toward spacious properties.
- Median Size: Grew to 2,316 sq. ft., up from 1,827 sq. ft. in the previous year.
Lot Size
- Minimum Lot Size: Remained at 0.130 acres.
- Maximum Lot Size: Expanded to 33.260 acres, from 26.6 acres in 2018, reflecting availability of more extensive properties.
- Average Lot Size: Decreased to 2.992 acres, from 4.375 acres, favoring moderately sized plots.
Market Dynamics
Days on Market (DOM)
- Minimum DOM: Fell to just 2 days, from 13 in 2018, indicating faster sales for highly desirable listings.
- Maximum DOM: Increased to 399 days, up from 215, revealing extended timelines for some properties.
- Average DOM: Lengthened to 80 days, from 62 days, suggesting slower overall market turnover.
Close Price Ratios
- ClsPr/LstPr (Close Price to Listing Price): Improved slightly to 96.16%, up from 95.92%, reflecting better alignment of sale prices with listings.
- ClsPr/OLP (Close Price to Original Listing Price): Increased to 94.23%, up from 93.60%, underscoring price stability through negotiations.
- Price Per Square Foot (Pr$/SqFt): Dropped to $127.87, down from $134.47, reflecting broader affordability across the market.
Insights into the Most Expensive Blue Ridge, TX Property Sold in 2019
The most expensive property sold in 2019 was a spacious and luxurious home offering opulence and comfort.
Key Highlights:
- Price: $508,474
- Bedrooms: 4
- Bathrooms: 4 (3 full and 1 half)
- Square Footage: 4,630 sq. ft.
- Price Per SqFt: $109.82
- Lot Size: 6.640 acres
- Days on Market: 399 days
- ClsPr/LstPr Ratio: 81.36%
- ClsPr/OLP Ratio: 73.69%
- Year Built: 2008
While this property commanded a premium price, the extended DOM and price adjustments underscore negotiation opportunities in the luxury market.
Economic context
Average Electricity Costs in Dallas-Fort Worth in 2019
The average electricity cost in 2019 increased to $0.14 per kilowatt-hour, up from $0.13 in 2018. This minor rise reflected the growing cost of utilities that homeowners had to manage.
Texas Average Gas Prices in 2019
Gas prices, however, dropped slightly to $2.29 per gallon, from $2.44 in 2018, offering some relief in transportation costs for residents.
Average 30-Year Fixed Mortgage Rate in 2019
The average 30-year fixed mortgage rate in 2019 dropped to 4.13%, a noticeable improvement from 4.70% the previous year. This decline significantly boosted home affordability, allowing homebuyers to qualify for larger loans and secure better financial terms. Lower mortgage rates helped offset rising home prices in the mid-market, making it an ideal time for homebuyers to step into the property market or upgrade their homes.
Curious about today’s mortgage rates and the home you can comfortably afford?
Submit a no-obligation mortgage application today and get pre-approved to determine your budget and take the first step toward homeownership with confidence.

Summary of Differences Between 2018 and 2019 Real Estate Data for Blue Ridge, TX
The 2019 real estate market in Blue Ridge, TX marked significant shifts compared to 2018, indicating growth in activity and property diversity while reflecting mixed changes in pricing, size, and market dynamics.
Property Pricing
- Minimum Price: Increased to $70,000 in 2019 from $55,000 in 2018, reflecting higher valuations for entry-level homes.
- Maximum Price: Decreased slightly to $508,474, down from $520,000, suggesting a mild softening in the luxury market.
- Average Price: Rose noticeably to $307,110 from $283,632, indicating strengthened buyer activity in mid-market properties.
- Median Price: Increased to $340,000, up from $302,000, reinforcing the rise in mid-range market appeal.
Property Features
- Bedrooms: The average home size grew to 4 bedrooms in 2019, up from 3 bedrooms in 2018, offering larger family accommodations.
- Bathrooms: Properties contained more bathrooms, with a maximum of 7 baths compared to 5 in the previous year.
- Square Footage:
- Minimum Size: Increased to 900 sq. ft., from 720 sq. ft., reflecting fewer compact properties sold.
- Maximum Size: Jumped significantly to 5,620 sq. ft., up from 4,012 sq. ft., supporting a resurgence of larger homes.
- Average Size: Gained to 2,465 sq. ft., from 2,184 sq. ft., indicating a trend toward bigger homes.
- Median Size: Increased to 2,316 sq. ft., compared to 1,827 sq. ft. the previous year.
Lot Size
- Minimum Lot Size: Held steady at 0.130 acres.
- Maximum Lot Size: Grew to 33.260 acres, up from 26.6 acres, signifying more expansive properties available in 2019.
- Average Lot Size: Decreased to 2.992 acres, from 4.375 acres, suggesting a focus on moderately sized lots.
Market Dynamics
- Days on Market (DOM):
- Minimum DOM: Dropped drastically to 2 days from 13, indicating faster turnaround for certain properties.
- Maximum DOM: Increased significantly to 399 days, up from 215, reflecting broader variability in sale timelines.
- Average DOM: Lengthened to 80 days from 62 days, pointing to slower overall transaction speeds.
- ClsPr/LstPr Ratio: Improved slightly to 96.16%, from 95.92%, suggesting better alignment of final sale prices with listing prices.
- ClsPr/OLP Ratio: Increased marginally to 94.23%, compared to 93.6%, reinforcing price stability during sale negotiations.
- Price Per Square Foot (Pr$/SqFt): Declined to $127.87, down from $134.47, reflecting increased affordability despite rising average and median prices.
Year Built
- Oldest Property Built: Shifted further back to properties built in 1910, compared to 1930 in 2018, indicating the presence of older housing stock.
- Newest Property Built: Remained at 2019, demonstrating continued availability of newly constructed homes.
- Average Year Built: Moved forward to 1999 from 1996, showing an overall younger inventory.
- Median Year Built: Increased to 2012, from 2003 in 2018, signifying a notable push for more recently built homes.
Key Market Insights
- Larger Homes: A significant increase in maximum and average square footage suggested a preference for more spacious living.
- Mid-Market Strength: Higher median and average prices highlighted growing trends in mid-range buyer activity.
- Broader Market Dynamics: Faster sales for select listings alongside longer sales for others indicated highly variable buyer-seller engagement.
- Affordability Adjustments: Decline in price per square foot reflected affordability for buyers, even with rising average and median prices.
The 2019 market underscored Blue Ridge’s evolving real estate landscape with enhanced property diversity and demand while balancing affordability and value.
Summary of Real Estate Market Analysis for Blue Ridge, TX in 2019
The 2019 real estate market in Blue Ridge, TX demonstrated resilience, growth, and opportunity as the city navigated a changing landscape. With an uptick in sales volume and larger, more diverse property options, the market catered to a spectrum of buyers, from entry-level purchasers to those seeking spacious, high-value homes. Pricing trends reflected a strengthening mid-market, with rising median prices balanced by improved affordability through lower mortgage rates.
While transaction speeds varied, the consistent improvement in close price ratios signified a more stable harmony between buyer and seller expectations. The year solidified Blue Ridge’s reputation as a vibrant and dynamic housing market, setting the stage for continued prosperity and evolution in the years ahead.
Why Statistics Data is Important
Understanding past market data is essential for making informed decisions in today’s real estate landscape. Historical statistics provide a foundational perspective on trends, aiding in fair pricing and negotiation.
Unlock Exceptional Service!
Assistance with all your real estate needs in the Dallas-Fort Worth area is just a click or call away. Reach out at 214-940-8149 or connect through the links below.
Oleg Sedletsky REALTOR® in Blue Ridge, Texas. Call/Text 214.940.8149
Greetings! I’m Oleg Sedletsky, and I’m excited to introduce myself as your go-to full-time licensed Texas REALTOR® and Mortgage Loan Originator.
I proudly represent JPAR® – Real Estate Brokerage as a REALTOR® and Utopia Mortgage LLC as a Mortgage Loan Originator! My designations and certifications reflect my dedication to helping you achieve your real estate goals in Blue Ridge, TX and other locations in the vibrant Dallas-Fort Worth area!
My commitment to ongoing professional development means I’m always enhancing my skills to serve you better. You can count on me as your trusted expert throughout your real estate journey. Plus, I’m fluent in English, Ukrainian, and Russian and ready to assist you every step of the way!
It’s All About You and Your Real Estate Dreams!
My mission is to serve you! With my knowledge and expertise, I’m here to help you achieve all your real estate goals and turn your dreams into reality!
I’m passionate about helping buyers and sellers navigate the exciting real estate landscape in Blue Ridge, Texas! Whether you’re searching for your dream home, exploring land options, or looking for commercial properties, my Real Estate Services have you covered.
Contact me today for all your real estate needs in Blue Ridge, Texas! Call/text 214-940-8149
Discover Yearly Real Estate Market Trends for Blue Ridge, TX
2003-2010
Blue Ridge, TX Real Estate Market in 2003
Blue Ridge, TX Real Estate Market in 2004
Blue Ridge, TX Real Estate Market in 2005
Blue Ridge, TX Real Estate Market in 2006
Blue Ridge, TX Real Estate Market in 2007
Blue Ridge, TX Real Estate Market in 2008
2011-2020
Blue Ridge, TX Real Estate Market in 2011
Blue Ridge, TX Real Estate Market in 2012
Blue Ridge, TX Real Estate Market in 2013
Blue Ridge, TX Real Estate Market in 2014
Blue Ridge, TX Real Estate Market in 2015
Blue Ridge, TX Real Estate Market in 2016
Blue Ridge, TX Real Estate Market in 2017
Blue Ridge, TX Real Estate Market in 2018
This market analysis is intended solely for educational purposes. This market analysis is based on data sourced from NTREIS, Inc. This analysis is exclusively focused on single-family homes and does not account for other property types. The total number of real estate transactions within the specified period and location may vary. Data accuracy cannot be guaranteed due to potential input errors made by NTREIS users. This market analysis does not account for all new construction home sales. If you need detailed information about recorded property sales or other public records, please contact the appropriate city or county office.
Blue Ridge, TX Real Estate: 2018 Analysis of the Single-Family Residential Housing Market
The 2018 real estate market in Blue Ridge, TX showcased a period of evolution and adjustments as the city adapted to shifting housing demands and economic conditions. A total of 41 homes were sold, reflecting slight market softening compared to the prior year, with reduced activity in the mid- and luxury-price segments.
However, the year maintained a competitive environment with diverse property options in terms of size, amenities, and pricing. Key economic factors such as rising mortgage rates and utility costs impacted affordability but did not hinder growth in certain metrics like price per square foot.
Key Takeaways and Trends from Blue Ridge’s 2018 Real Estate Market
Pricing Range: The drop in both maximum and median prices highlighted some softening in the luxury and mid-market segments. However, the market retained opportunities for entry-level buyers with the lower minimum price of $55,000.
Market Efficiency: The slightly longer average DOM and lower close price ratios indicated reduced sales velocity and buyer confidence, partially due to economic shifts.
Unique Outliers: The increase in price per square foot and limited availability of larger homes emphasized changing buyer preferences towards compact, high-value homes.
Total Homes Closed
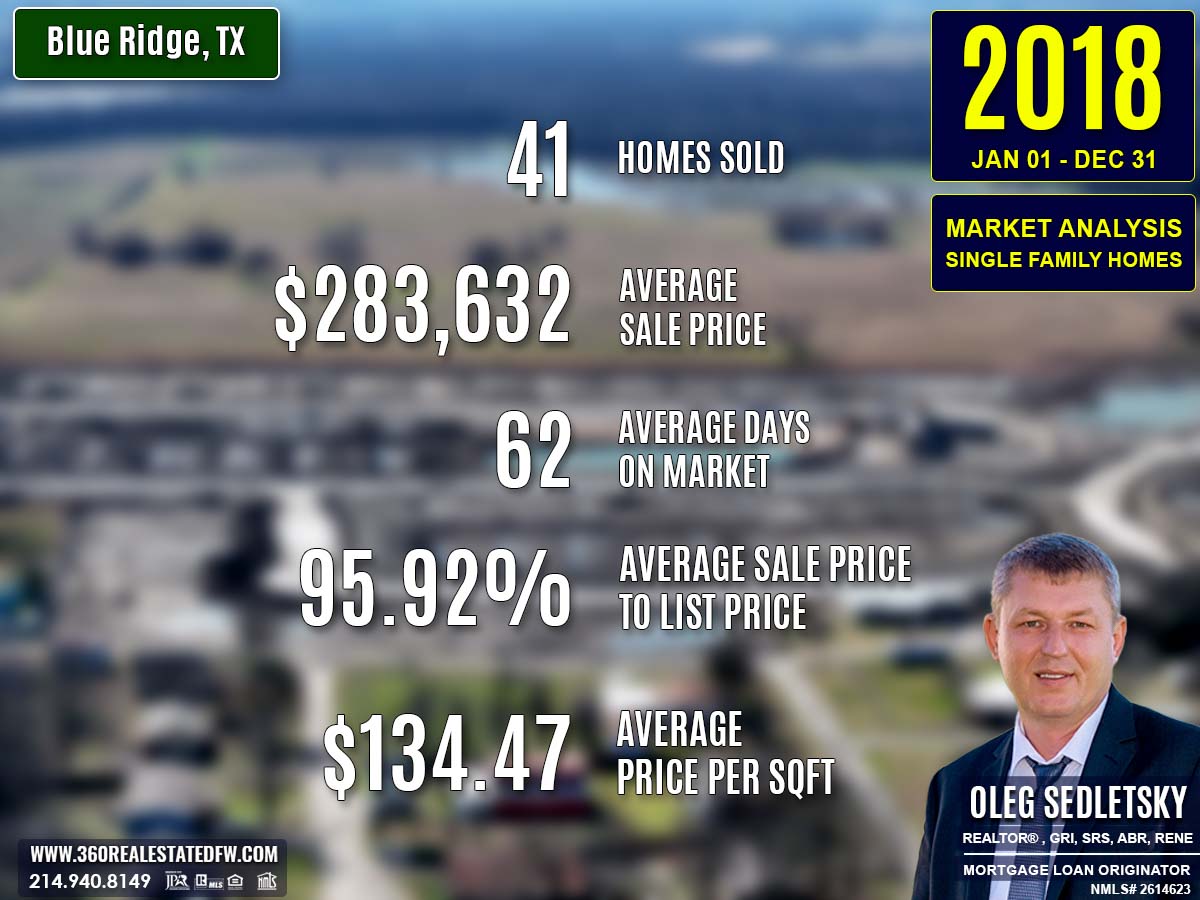
The year ended with 41 residential single-family homes closed, fewer than the 46 homes sold in 2017. This decline pointed to reduced transaction volume, possibly influenced by changing buyer activity and rising interest rates.
Property Pricing Insights
The 2018 market delivered varied pricing options across different segments:
- Minimum Price: Dropped to $55,000, from $65,000 in 2017, broadening affordability for entry-level buyers.
- Maximum Price: Reduced slightly to $520,000, compared to the $570,000 high seen the prior year.
- Average Price: Declined moderately to $283,632, down from $293,666, indicating tempered overall valuations.
- Median Price: Fell to $302,000, lower than 2017’s $318,250, reflecting reduced mid-market activity.
Property Size and Features
Bedrooms & Bathrooms
- Bedrooms: Ranged from 2 to 5 bedrooms, with an average of 3 bedrooms, slightly lower than the 4-bedroom average in 2017.
- Bathrooms: Homes offered up to 5 baths, with an average of 3 bathrooms, consistent with the previous year.
Square Footage
- Minimum Size: Decreased to 720 sq. ft., down from 900 sq. ft., introducing smaller home options.
- Maximum Size: Reduced to 4,012 sq. ft., compared to 4,538 sq. ft. in 2017.
- Average Size: Moderated to 2,184 sq. ft., down from 2,355 sq. ft., reflecting more compact properties overall.
- Median Size: Dropped to 1,827 sq. ft., from 2,213 sq. ft., suggesting a prevailing trend toward smaller homes.
Lot Size
- Minimum Lot Size: Decreased to 0.130 acres, compared to 0.172 acres in 2017.
- Maximum Lot Size: Reduced to 26.600 acres, down from 49.310 acres, signaling less availability of expansive properties.
- Average Lot Size: Increased slightly to 4.375 acres, from 4.020 acres, reflecting a preference for moderately larger plots.
Market Dynamics
Days on Market (DOM)
- Minimum DOM: Increased significantly to 13 days, up from just 2 days in 2017, indicating slower turnaround for the quickest sales.
- Maximum DOM: Dropped to 215 days, an improvement over the 369-day maximum in the prior year.
- Average DOM: Increased slightly to 62 days, compared to 59 days in 2017, suggesting a slight slowdown in overall sales activity.
Close Price Ratios
- ClsPr/LstPr (Close Price to Listing Price): Declined to 95.92%, from 97.98%, giving buyers more bargaining flexibility.
- ClsPr/OLP (Close Price to Original Listing Price): Dropped to 93.60%, from 96.89%, reflecting increased price adjustments.
- Price Per Square Foot (Pr$/SqFt): Increased to $134.47, up from $131.47 in 2017, indicating strong valuation for smaller, more efficient homes.
Insights into the Most Expensive Blue Ridge, TX Property Sold in 2018
The most expensive property sold in 2018 was a well-appointed, modern home offering substantial value and design appeal.
Key Highlights:
- Price: $520,000
- Bedrooms: 3
- Bathrooms: 2
- Square Footage: 2,273 sq. ft.
- Price Per SqFt: $228.77
- Lot Size: 10.000 acres
- Days on Market: 13 days (fast turn-around time)
- ClsPr/LstPr Ratio: 96.67%
- ClsPr/OLP Ratio: 96.67%
- Year Built: 1999
This property combined modern features with ample space, making it highly desirable in the market.
Economic context
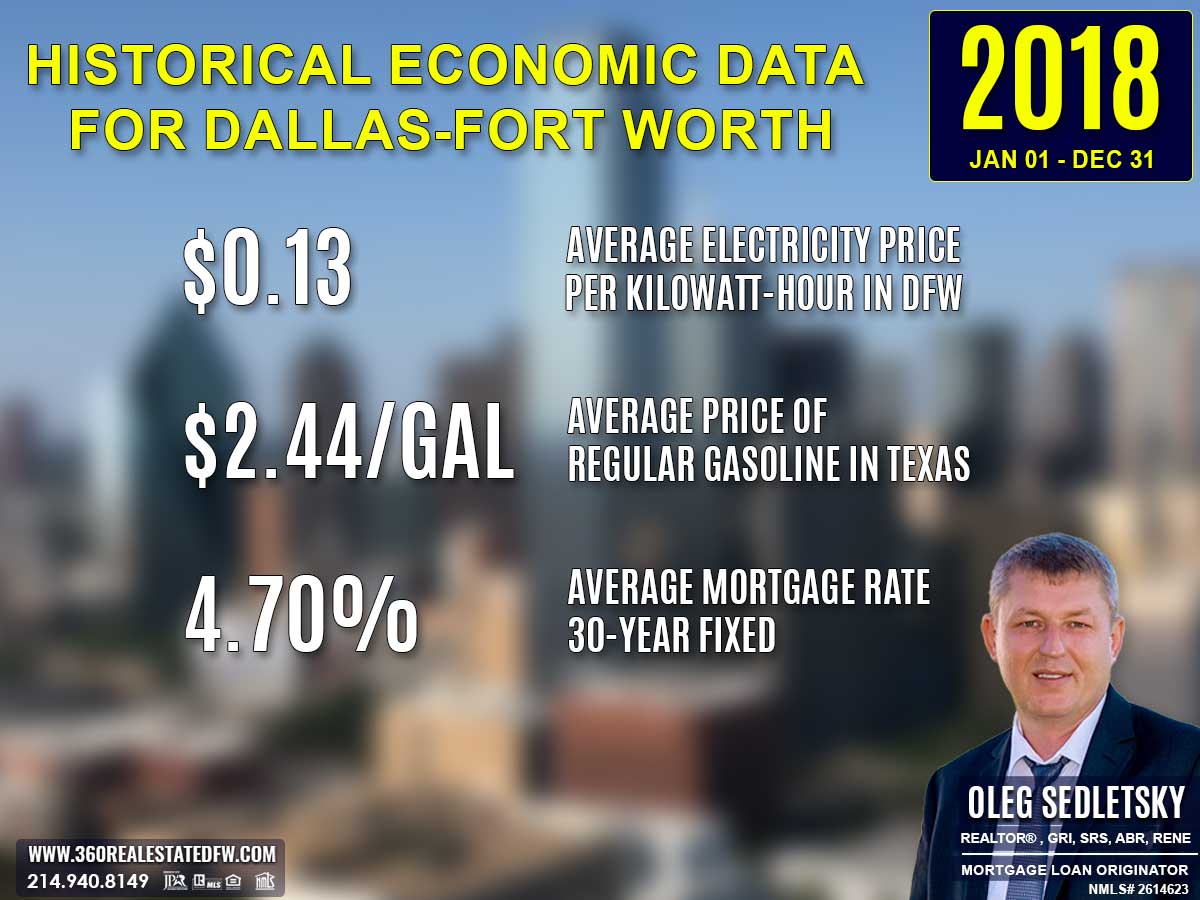
Average Electricity Costs in Dallas-Fort Worth in 2018
The average electricity cost in 2018 increased to $0.13 per kilowatt-hour. Though marginally higher than 2017’s rate, it remained manageable for homeowners and reflected minor increases in utility expenses.
Texas Average Gas Prices in 2018
Gas prices rose to $2.44 per gallon, up from $2.19 in 2017. This increment may have slightly impacted transportation and commuting budgets but was not a significant deterrent for homebuyers.
Average 30-Year Fixed Mortgage Rate in 2018
The average 30-year fixed mortgage rate in 2018 climbed to 4.70%, marking an increase from the 4.14% rate witnessed in 2017. This rise in rates slightly tightened home affordability, potentially influencing buyer activity and market trends. Despite the increase, the rate remained within historical norms, keeping homeownership accessible for many.
Curious about today’s mortgage rates and the home you can comfortably afford?
Submit a no-obligation mortgage application today and get pre-approved to determine your budget and take the first step toward homeownership with confidence.
Summary of Differences Between 2017 and 2018 Real Estate Data for Blue Ridge, TX
The 2018 real estate market in Blue Ridge, TX experienced some notable shifts compared to 2017, reflecting adjustments in property values, buyer activity, and market performance.
Property Pricing
- Minimum Price: Decreased to $55,000 from $65,000, offering greater affordability for entry-level buyers.
- Maximum Price: Dropped slightly to $520,000, compared to $570,000 in 2017, reflecting a softening at the luxury end of the market.
- Average Price: Declined to $283,632 from $293,666, indicating tempered overall property valuations.
- Median Price: Fell to $302,000 from $318,250, signifying reduced activity in the mid-market segment.
Property Size
- Square Footage:
- Minimum Size: Decreased to 720 sq. ft. from 900 sq. ft., signaling smaller homes entering the market.
- Maximum Size: Reduced to 4,012 sq. ft. from 4,538 sq. ft., limiting larger home offerings.
- Average Size: Moderated to 2,184 sq. ft. from 2,355 sq. ft.
- Median Size: Dropped to 1,827 sq. ft. from 2,213 sq. ft., reflecting a smaller average property size overall.
Lot Size
- Minimum Lot Size: Decreased slightly to 0.130 acres from 0.172 acres.
- Maximum Lot Size: Reduced significantly to 26.600 acres from 49.310 acres, suggesting fewer large-lot properties in the mix.
- Average Lot Size: Increased slightly to 4.375 acres from 4.020 acres, showing a mild shift towards moderately larger plots.
Bedrooms and Bathrooms
- Bedrooms: The average number decreased to 3 bedrooms in 2018, down from 4 bedrooms in 2017.
- Bathrooms: Held strong at an average of 3 bathrooms, although the maximum count dropped to 5, from 6 in 2017.
Market Dynamics
-
Days on Market (DOM):
- Minimum DOM: Increased to 13 days from 2 days, indicating a slowdown in the quickest close category.
- Maximum DOM: Reduced to 215 days from 369, suggesting fewer prolonged sales.
- Average DOM: Rose to 62 days from 59 days, indicating slightly longer wait times to close.
-
ClsPr/LstPr Ratio: Decreased marginally to 95.92% from 97.98%, giving buyers slightly more room for negotiation.
-
ClsPr/OLP Ratio: Declined to 93.60% from 96.89%, reflecting more significant price reductions before sales.
-
Price Per Square Foot (Pr$/SqFt): Increased to $134.47 from $131.47, highlighting improved valuations despite lower overall property prices.
Year Built
- Oldest Property Built: Advanced to 1930, from 1919, signaling a removal of older historical homes from the market.
- Newest Property Built: Remained unchanged at 2018, reflecting continued newly built options.
- Average Year Built: Stepped back slightly to 1996 from 2001.
- Median Year Built: Stayed consistent at 2003.
Key Market Shifts
- Softening Prices: Reduced minimum, maximum, average, and median prices suggested slight buyer hesitancy or an adjustment in expectations.
- Smaller Properties Listed: Decreases in property size and lot size metrics reflected changing inventory.
- Moderate Market Activity: Slightly longer average DOM and lower price realization ratios indicated a less competitive environment.
- Improved Value Per Square Foot: The increase in Pr$/SqFt highlighted stronger valuation for smaller or more efficiently designed homes.
Overall, the 2018 market balanced affordability with demand, featuring more compact and value-conscious options while adjusting to evolving buyer preferences and economic conditions.
Summary of Real Estate Market Analysis for Blue Ridge, TX in 2018
The 2018 real estate market in Blue Ridge, TX highlighted a year of adaptation and stabilization. With a slight decrease in sales volume and moderation in pricing trends, the market catered to a balance of affordability and value. HomeBuyers benefited from lower entry-point prices and a wide range of property options, while sellers saw improved valuations with a rise in price per square foot.
Despite a minor slowdown in transaction speeds and tighter financing conditions, the market maintained resilience, offering opportunities for both seasoned investors and first-time homebuyers. The year closed on a stable note, setting the stage for potential growth and further evolution in the years ahead.
Why Statistics Data is Important
Understanding past market data is essential for making informed decisions in today’s real estate landscape. Historical statistics provide a foundational perspective on trends, aiding in fair pricing and negotiation.
Unlock Exceptional Service!
Assistance with all your real estate needs in the Dallas-Fort Worth area is just a click or call away. Reach out at 214-940-8149 or connect through the links below.
Oleg Sedletsky REALTOR® in Blue Ridge, Texas. Call/Text 214.940.8149
Greetings! I’m Oleg Sedletsky, and I’m excited to introduce myself as your go-to full-time licensed Texas REALTOR® and Mortgage Loan Originator.
I proudly represent JPAR® – Real Estate Brokerage as a REALTOR® and Utopia Mortgage LLC as a Mortgage Loan Originator! My designations and certifications reflect my dedication to helping you achieve your real estate goals in Blue Ridge, TX and other locations in the vibrant Dallas-Fort Worth area!
My commitment to ongoing professional development means I’m always enhancing my skills to serve you better. You can count on me as your trusted expert throughout your real estate journey. Plus, I’m fluent in English, Ukrainian, and Russian and ready to assist you every step of the way!
It’s All About You and Your Real Estate Dreams!
My mission is to serve you! With my knowledge and expertise, I’m here to help you achieve all your real estate goals and turn your dreams into reality!
I’m passionate about helping buyers and sellers navigate the exciting real estate landscape in Blue Ridge, Texas! Whether you’re searching for your dream home, exploring land options, or looking for commercial properties, my Real Estate Services have you covered.
Contact me today for all your real estate needs in Blue Ridge, Texas! Call/text 214-940-8149
Discover Yearly Real Estate Market Trends for Blue Ridge, TX
2003-2010
Blue Ridge, TX Real Estate Market in 2003
Blue Ridge, TX Real Estate Market in 2004
Blue Ridge, TX Real Estate Market in 2005
Blue Ridge, TX Real Estate Market in 2006
Blue Ridge, TX Real Estate Market in 2007
Blue Ridge, TX Real Estate Market in 2008
2011-2020
Blue Ridge, TX Real Estate Market in 2011
Blue Ridge, TX Real Estate Market in 2012
Blue Ridge, TX Real Estate Market in 2013
Blue Ridge, TX Real Estate Market in 2014
Blue Ridge, TX Real Estate Market in 2015
Blue Ridge, TX Real Estate Market in 2016
Blue Ridge, TX Real Estate Market in 2017
Blue Ridge, TX Real Estate Market in 2018
This market analysis is intended solely for educational purposes. This market analysis is based on data sourced from NTREIS, Inc. This analysis is exclusively focused on single-family homes and does not account for other property types. The total number of real estate transactions within the specified period and location may vary. Data accuracy cannot be guaranteed due to potential input errors made by NTREIS users. This market analysis does not account for all new construction home sales. If you need detailed information about recorded property sales or other public records, please contact the appropriate city or county office.
Blue Ridge, TX Real Estate: 2017 Analysis of the Single-Family Residential Housing Market
The year 2017 marked a period of strong activity and growth for Blue Ridge, Texas’s real estate market. With 46 homes sold, a significant rise from 35 sales in 2016, the market demonstrated heightened buyer demand and expanding opportunities.
Housing prices continued to climb, properties showcased greater diversity, and market dynamics improved, making it a fruitful year for both Home-buyers and Home-sellers. Additionally, economic factors such as low mortgage rates and moderate cost increases maintained affordability and encouraged homeownership.
Key Takeaways and Trends from Blue Ridge’s 2017 Real Estate Market
Pricing Range: The market emphasized growth in all pricing tiers, with both the average and median prices reflecting stronger demand. The broad spectrum of property values, ranging from $65,000 to $570,000, catered to diverse buyers, strengthening the mid- and luxury-market segments.
Market Efficiency: The average time on the market improved dramatically to 59 days, reflecting enhanced efficiency. Higher close price percentages and reduced price adjustments before sale reinforced a seller-friendly environment.
Unique Outliers:
- The largest property spanned 49.310 acres, showcasing opportunities for rural retreats or large estates.
- At $527.78 per square foot, the priciest home demonstrated premium valuation potential in Blue Ridge.
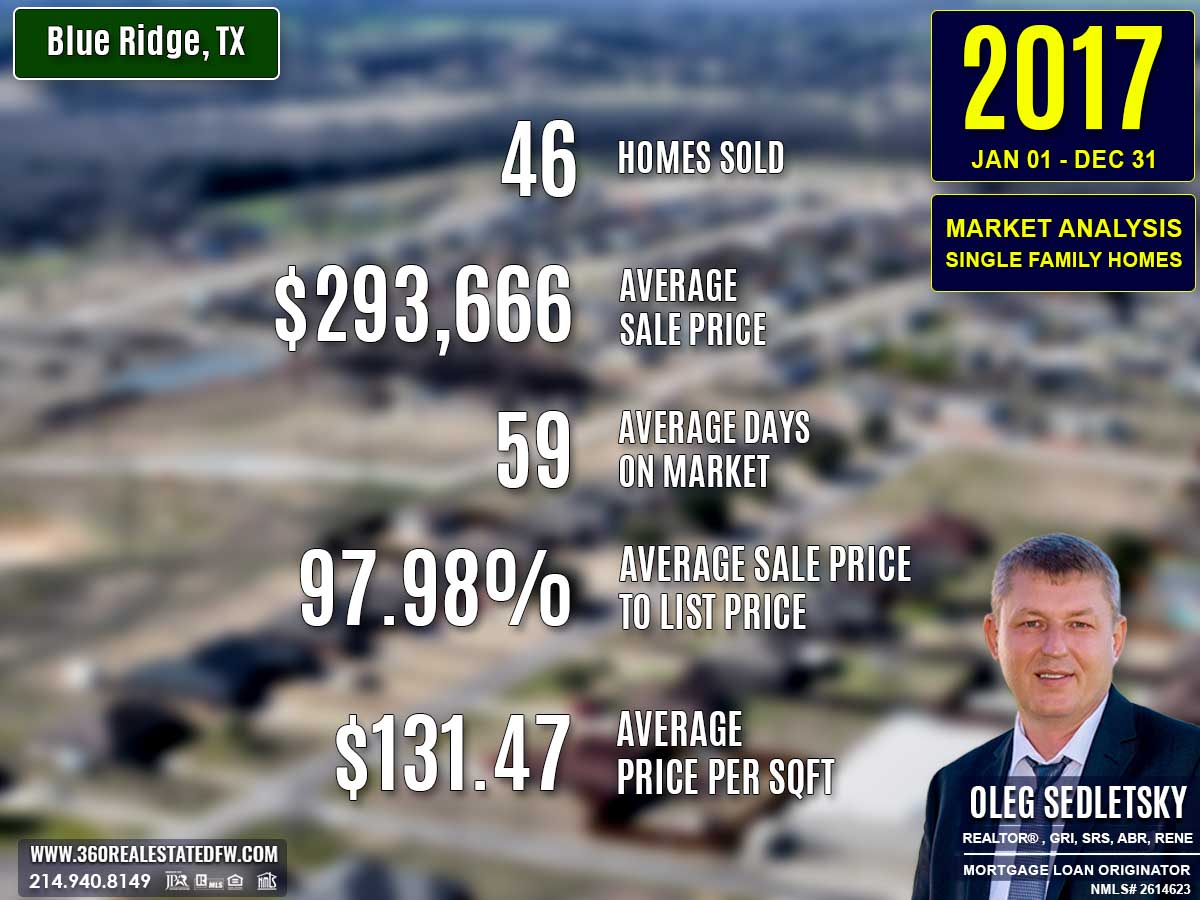
Total Homes Closed
In 2017, 46 single-family residential homes were sold, marking a significant increase of 11 homes compared to the 35 sold in 2016. This growth reflected a thriving market driven by increased buyer engagement and varied property options.
Property Pricing Insights
The 2017 market saw an upward trajectory in home pricing, accompanied by a broad range of affordability:
- Minimum Price: $65,000 (matched with 2016), keeping entry points affordable.
- Maximum Price: $570,000, slightly higher than 2016’s $568,500, indicating continued strength in luxury homes.
- Average Price: $293,666, rising from $281,767, showcasing an overall increase in market value.
- Median Price: $318,250, up from $300,000, underscoring robust mid-market demand.
Property Size and Features
The homes sold in 2017 offered a mix of configurations to meet diverse buyer preferences:
Bedrooms & Bathrooms
- Bedrooms: Homes featured 2 to 5 bedrooms, with an average of 4 bedrooms, consistent with 2016 levels.
- Bathrooms: Ranges expanded to up to 6 bathrooms, with an average of 3 bathrooms, slightly more than the year before.
Square Footage
- Minimum Size: 900 sq. ft., slightly smaller than 2016’s 1,024 sq. ft.
- Maximum Size: Grew to 4,538 sq. ft., from 4,000 sq. ft.
- Average Size: 2,355 sq. ft., a slight increase from 2,348 sq. ft. in 2016.
- Median Size: Increased moderately to 2,213 sq. ft., from 2,162 sq. ft., reflecting a preference for spacious homes.
Lot Size
- Minimum Lot Size: Increased slightly to 0.172 acres, from 0.151 acres in 2016.
- Maximum Lot Size: Expanded significantly to 49.310 acres, from 36.587 acres, showcasing broader land opportunities.
- Average Lot Size: Decreased to 4.020 acres, from 4.574 acres, reflecting diversity in property offerings.
Market Dynamics
Days on Market (DOM)
The market exhibited improved efficiency in 2017:
- Minimum DOM: Decreased to 2 days, from 4 days in 2016, enabling quicker sales for well-positioned properties.
- Maximum DOM: Dropped slightly to 369 days, from 400 days.
- Average DOM: Improved significantly to 59 days, down from 86 days, signaling faster property turnovers.
Close Price Ratios
- ClsPr/LstPr (Close Price to Listing Price): Increased to 97.98%, from 95.15%, showing greater alignment between list and sale prices.
- ClsPr/OLP (Close Price to Original Listing Price): Improved to 96.89%, from 93.51%, indicating reduced price reductions prior to closing.
- Price Per Square Foot: Jumped to $131.47, up from $118.01 in 2016, reflecting stronger valuation.
Insights into the Most Expensive Blue Ridge, TX Property Sold in 2017
The priciest home sold in 2017 was a historic estate that seamlessly blended timeless charm, unmatched exclusivity, and a sprawling 49.3-acre lot.
Property Highlights:
- Price: $570,000
- Bedrooms: 2
- Bathrooms: 1
- Square Footage: 1,080 sq. ft.
- Price Per SqFt: $527.78
- Lot Size: 49.310 acres
- Days on Market: 77 days
- ClsPr/LstPr Ratio: 95.00%
- ClsPr/OLP Ratio: 95.00%
- Year Built: 1919
This extraordinary property offered vast acreage, a cozy living space, and a unique historical appeal in Blue Ridge’s housing landscape.
Economic context
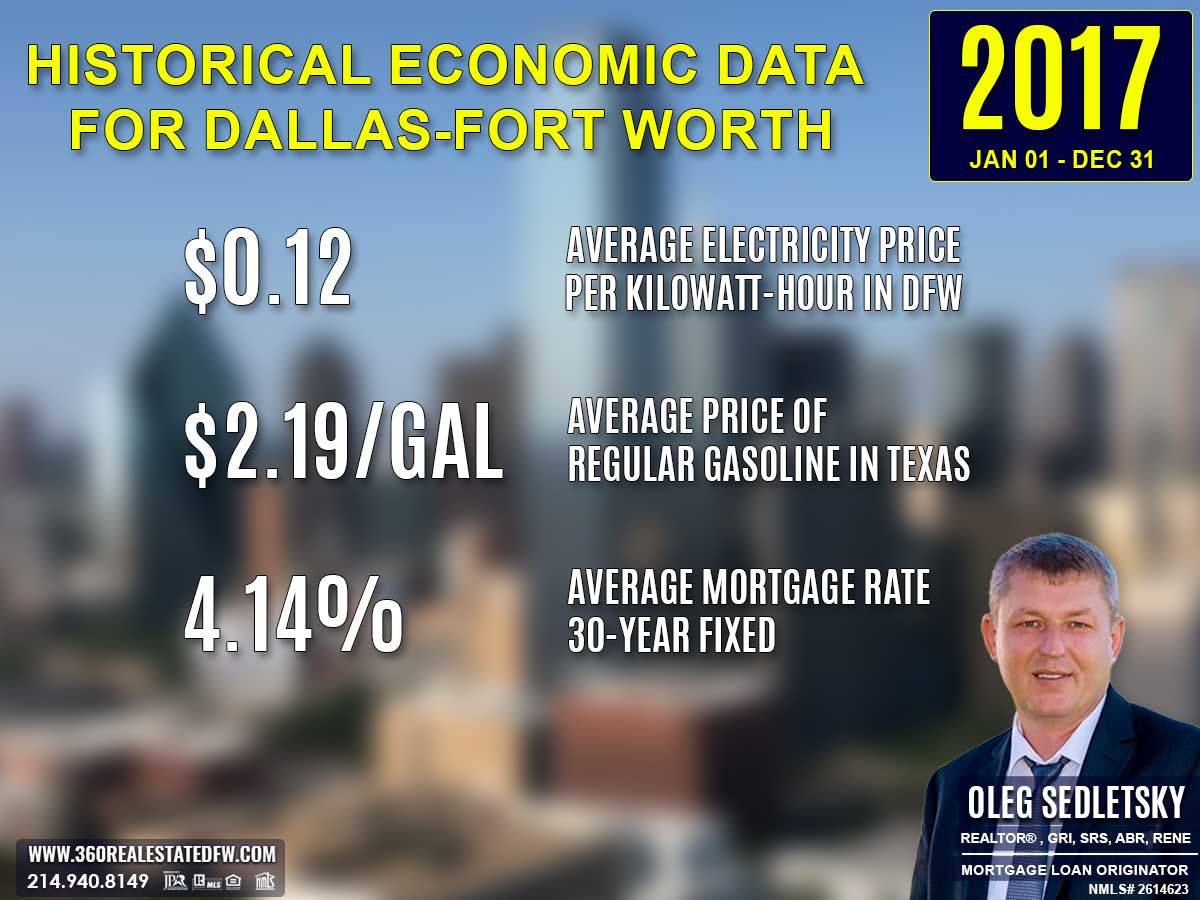
Average Electricity Costs in Dallas-Fort Worth in 2017
The average electricity cost in 2017 increased slightly to $0.12 per kilowatt-hour. Although higher than the previous year, this rate remained affordable for homeowners, balancing utility bills effectively.
Texas Average Gas Prices in 2017
Gas prices rose to an average of $2.19 per gallon, up from $1.91. This increase may have impacted commuting costs but remained manageable for homebuyers.
Average 30-Year Fixed Mortgage Rate in 2017
The average 30-year fixed mortgage rate in 2017 was 4.14%, reflecting a modest increase from the previous year’s 3.79%. Despite this rise, the rate remained historically low, making home financing accessible for many buyers. This affordability encouraged broader participation in the real estate market, enabling buyers to secure loans for both entry-level and premium properties.
Curious about today’s mortgage rates and the home you can comfortably afford?
Submit a no-obligation mortgage application today and get pre-approved to determine your budget and take the first step toward homeownership with confidence.
Summary of Differences Between 2016 and 2017 Real Estate Data for Blue Ridge, TX
The 2017 real estate market in Blue Ridge, Texas showed notable shifts and trends compared to 2016, including increased sales volume, rising prices, and evolving market dynamics.
Property Pricing
- Minimum Price: Stayed consistent at $65,000, maintaining affordability for entry-level buyers.
- Maximum Price: Increased slightly to $570,000, from $568,500 in 2016, showing strength in the high-end market.
- Average Price: Rose to $293,666, up from $281,767, indicating further growth in property values.
- Median Price: Jumped to $318,250 from $300,000, reflecting robust demand in the mid-market segment.
Property Features
- Bedrooms: Varied from 2 to 5, compared to 2 to 6 in 2016. The average remained steady at 4 bedrooms.
- Bathrooms: Expanded to 1 to 6 baths, up from 1 to 5, with the average staying at 3 bathrooms.
- Square Footage:
- Minimum Size: Decreased slightly to 900 sq. ft., from 1,024 sq. ft.
- Maximum Size: Increased to 4,538 sq. ft., up from 4,000 sq. ft.
- Average Size: Stayed nearly the same at 2,355 sq. ft., compared to 2,348 sq. ft.
- Median Size: Grew moderately to 2,213 sq. ft., from 2,162 sq. ft.
Lot Size
- Minimum Lot Size: Increased slightly to 0.172 acres, up from 0.151 acres.
- Maximum Lot Size: Expanded significantly to 49.310 acres, compared to 36.587 acres, catering to buyers seeking larger spaces.
- Average Lot Size: Decreased to 4.020 acres from 4.574 acres, showing a focus on compact properties.
Market Dynamics
-
Days on Market (DOM):
- Minimum DOM: Dropped to 2 days, down from 4 days, signifying quicker sales for efficiently priced properties.
- Maximum DOM: Fell to 369 days, from 400 days, reducing the duration of extended sales.
- Average DOM: Decreased dramatically to 59 days, from 86 days, reflecting improved market efficiency.
-
ClsPr/LstPr (Close Price to Listing Price): Improved significantly to 97.98%, from 95.15%, showcasing stronger alignment between list and sale prices.
-
ClsPr/OLP (Close Price to Original Listing Price): Rose to 96.89%, from 93.51%, indicating fewer price reductions before a sale.
-
Price Per Square Foot (Pr$/SqFt): Increased sharply to $131.47, from $118.01, highlighting further property value appreciation.
Year Built
- Oldest Property Built: Shifted to 1919, from 1938, indicating the inclusion of older, historical homes in 2017.
- Newest Property Built: Remained at 2017, showing ongoing opportunities in new constructions.
- Average Year Built: Advanced to 2001, from 1997, favoring more modern homes.
- Median Year Built: Progressed to 2015, from 2003, signifying a trend toward newer properties.
Notable Market Shifts
- Higher Prices: The boost in average and median prices, paired with an increased price per square foot, reflects strong demand and market growth.
- Improved Efficiency: The significant reduction in average Days on Market (DOM) and higher close price ratios demonstrate a competitive and efficient market.
- Unique Outliers: The substantial increase in the largest lot size to over 49 acres and a new pricing high of $570,000 indicate greater diversity within the market framework.
Overall, the 2017 market in Blue Ridge proved to be dynamic, with heightened activity, sharper pricing trends, and enhancements in market efficiency, making it a pivotal year.
Summary of Real Estate Market Analysis for Blue Ridge, TX in 2017
The 2017 real estate market in Blue Ridge, TX showcased significant progress, demonstrating an active and thriving housing sector. With a notable rise in total sales and sustained growth in property values, the market provided excellent opportunities for buyers and sellers across various segments.
Pricing trends pointed to a strengthening mid- to upper-market sector, while faster sales cycles and improved market efficiency emphasized a competitive and dynamic environment. Economic conditions, including historically low mortgage rates and manageable utility costs, supported continued buyer interest and accessibility.
Ultimately, 2017 reinforced Blue Ridge‘s position as a robust and evolving real estate market, attracting both new homeowners and seasoned investors while setting a solid foundation for future growth.
Why Statistics Data is Important
Understanding past market data is essential for making informed decisions in today’s real estate landscape. Historical statistics provide a foundational perspective on trends, aiding in fair pricing and negotiation.
Unlock Exceptional Service!
Assistance with all your real estate needs in the Dallas-Fort Worth area is just a click or call away. Reach out at 214-940-8149 or connect through the links below.
Oleg Sedletsky REALTOR® in Blue Ridge, Texas. Call/Text 214.940.8149
Greetings! I’m Oleg Sedletsky, and I’m excited to introduce myself as your go-to full-time licensed Texas REALTOR® and Mortgage Loan Originator.
I proudly represent JPAR® – Real Estate Brokerage as a REALTOR® and Utopia Mortgage LLC as a Mortgage Loan Originator! My designations and certifications reflect my dedication to helping you achieve your real estate goals in Blue Ridge, TX and other locations in the vibrant Dallas-Fort Worth area!
My commitment to ongoing professional development means I’m always enhancing my skills to serve you better. You can count on me as your trusted expert throughout your real estate journey. Plus, I’m fluent in English, Ukrainian, and Russian and ready to assist you every step of the way!
It’s All About You and Your Real Estate Dreams!
My mission is to serve you! With my knowledge and expertise, I’m here to help you achieve all your real estate goals and turn your dreams into reality!
I’m passionate about helping buyers and sellers navigate the exciting real estate landscape in Blue Ridge, Texas! Whether you’re searching for your dream home, exploring land options, or looking for commercial properties, my Real Estate Services have you covered.
Contact me today for all your real estate needs in Blue Ridge, Texas! Call/text 214-940-8149
Discover Yearly Real Estate Market Trends for Blue Ridge, TX
2003-2010
Blue Ridge, TX Real Estate Market in 2003
Blue Ridge, TX Real Estate Market in 2004
Blue Ridge, TX Real Estate Market in 2005
Blue Ridge, TX Real Estate Market in 2006
Blue Ridge, TX Real Estate Market in 2007
Blue Ridge, TX Real Estate Market in 2008
2011-2020
Blue Ridge, TX Real Estate Market in 2011
Blue Ridge, TX Real Estate Market in 2012
Blue Ridge, TX Real Estate Market in 2013
Blue Ridge, TX Real Estate Market in 2014
Blue Ridge, TX Real Estate Market in 2015
Blue Ridge, TX Real Estate Market in 2016
Blue Ridge, TX Real Estate Market in 2017
Blue Ridge, TX Real Estate Market in 2018
This market analysis is intended solely for educational purposes. This market analysis is based on data sourced from NTREIS, Inc. This analysis is exclusively focused on single-family homes and does not account for other property types. The total number of real estate transactions within the specified period and location may vary. Data accuracy cannot be guaranteed due to potential input errors made by NTREIS users. This market analysis does not account for all new construction home sales. If you need detailed information about recorded property sales or other public records, please contact the appropriate city or county office.

Blue Ridge, TX Real Estate: 2016 Analysis of the Single-Family Residential Housing Market
The year 2016 marked a period of expanded opportunities, rising home values, and broad appeal in Blue Ridge, Texas’s real estate market. With 35 homes sold, the market showed steady activity, maintaining momentum from previous years.
Larger homes with modern features dominated the market alongside rising price trends, reflecting a growing demand for family-oriented living spaces. Lower gas prices, electricity costs, and declining mortgage rates enhanced affordability, making 2016 a notable year for both home-buyers and home-sellers.
Key Takeaways and Trends from Blue Ridge’s 2016 Real Estate Market
Pricing Range: The 2016 market exhibited a clear trend of rising prices, with a sharp increase in both average and median sales prices. While the luxury market showed a slight contraction, the mid-market segment surged, catering to growing demand.
Market Efficiency: The average DOM increased slightly to 86 days, reflecting the higher valuation and larger size of properties sold. However, the market maintained a strong ClsPr/LstPr Ratio of 95.15%, showcasing stable negotiation dynamics.
Unique Outliers:
- The largest property sold spanned 36.587 acres, showing strong demand for spacious land options.
- Price per square foot rose to $118.01, an indicator of rising property values across all segments.
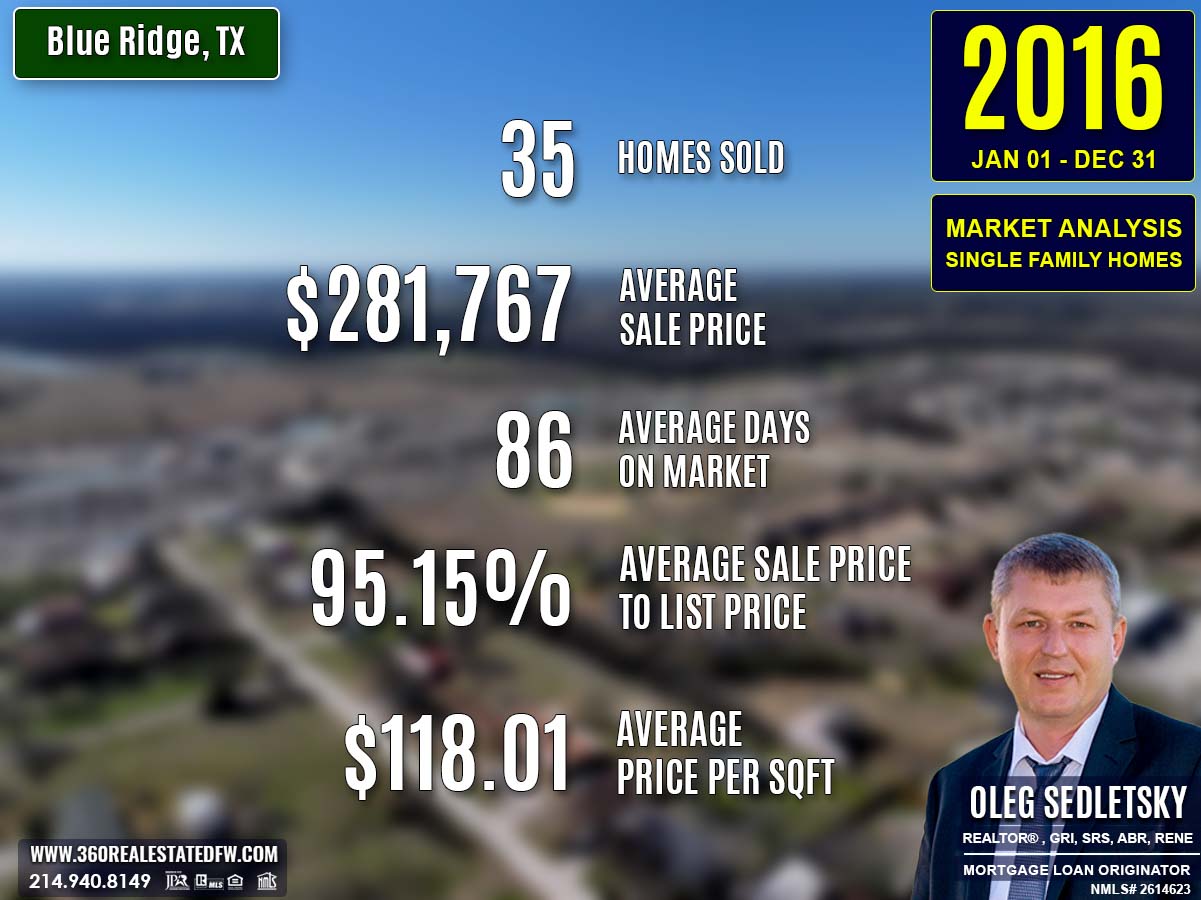
Total Homes Closed
A total of 35 residential single-family homes were sold in 2016, maintaining consistency in closed sales compared to the 34 homes sold in 2015. The market continued to cater to varied buyer demands, from smaller homes to expansive estates.
Property Pricing Insights
The 2016 market showed growth in property values across multiple pricing points, offering a range to suit diverse buyers:
- Minimum Price: $65,000, a significant increase from 2015’s $21,000, indicating growth in starter home options.
- Maximum Price: $568,500, showing a slight decrease from the 2015 high of $699,000.
- Average Price: $281,767, a remarkable jump from $200,022 in 2015, pointing to an overall rise in home values.
- Median Price: $300,000, nearly doubling from the previous year’s $142,100, signaling a stronger preference for mid-level homes.
Property Size and Features
Bedrooms & Bathrooms
The year saw an increase in both size and variety for living spaces:
- Bedrooms: Expanded to options ranging from 2 to 6 bedrooms, with an average of 4 bedrooms.
- Bathrooms: Homes offered configurations between 1 and 5 baths, with an average of 3 bathrooms, a boost from 2 in 2015.
Square Footage
Buyers had access to larger homes in 2016 compared to previous years:
- Minimum Size: 1,024 sq. ft.
- Maximum Size: 4,000 sq. ft.
- Average Size: 2,348 sq. ft., a considerable increase from 1,943 sq. ft. in 2015.
- Median Size: 2,162 sq. ft., showing a market shift toward bigger, family-oriented homes.
Lot Size
- Minimum Lot Size: 0.151 acres.
- Maximum Lot Size: 36.587 acres, an increase from 2015’s 19.500 acres, providing options for spacious living.
- Average Lot Size: 4.574 acres.
Market Dynamics
Days on Market (DOM)
Market efficiency adjusted slightly in 2016:
- Minimum DOM: 4 days.
- Maximum DOM: 400 days, slightly shorter than 463 days in 2015.
- Average DOM: 86 days, a slight increase from 65 days, signaling larger and higher-priced inventory requiring longer sale times.
Close Price Ratios
- ClsPr/LstPr (Close Price to Listing Price): Maintained at 95.15%, consistent with 2015, showing stable buyer-seller negotiation alignment.
- ClsPr/OLP (Close Price to Original Listing Price): Decreased slightly to 93.51%, indicating more frequent price adjustments during the selling process.
- Price Per Square Foot (Pr$/SqFt): Rose sharply to $118.01, up from $92.06, reflecting increased property value.
Insights into the Most Expensive Blue Ridge, TX Property Sold in 2016
The most expensive home sold in 2016 encapsulated luxury and space, setting a benchmark in Blue Ridge, TX.
Property Highlights:
- Price: $568,500
- Bedrooms: 4
- Bathrooms: 3 (2 full, 1 half)
- Square Footage: 3,206 sq. ft.
- Price per SqFt: $177.32
- Lot Size: 36.587 acres
- Days on Market: 121 days
- ClsPr/LstPr Ratio: 94.94%
- ClsPr/OLP Ratio: 87.46%
- Year Built: 2008
This stunning property exemplified modern living on a grand scale, offering both expansive indoor space and vast acreage, ideal for high-end buyers seeking privacy and sophistication.
Economic context
Average Electricity Costs in Dallas-Fort Worth in 2016
The average electricity cost in 2016 dropped to $0.11 per kilowatt-hour, providing cost savings to homeowners and adding appeal to energy-efficient properties.
Texas Average Gas Prices in 2016
Fuel costs continued to decline, with gas averaging $1.91 per gallon. This drop made commuting more affordable, likely boosting suburban appeal for homebuyers in Blue Ridge, Texas.
Average 30-Year Fixed Mortgage Rate in 2016
The average 30-year fixed mortgage rate in 2016 was 3.79%, marking a slight decrease from the previous year. This low rate significantly boosted housing affordability, making it easier for homebuyers to secure financing and invest in larger or higher-value properties. With such favorable rates, many homebuyers were able to enter the market or upgrade to larger homes, driving demand and supporting rising home values.
Curious about today’s mortgage rates and the home you can comfortably afford?
Submit a no-obligation mortgage application today and get pre-approved to determine your budget and take the first step toward homeownership with confidence.

Summary of Differences Between 2015 and 2016 Real Estate Data for Blue Ridge, TX
The year 2016 brought notable changes to Blue Ridge’s real estate market compared to 2015. The trends showcased a shift toward larger homes, higher average pricing, and more diversity in property features. Here’s a breakdown of the key differences:
Property Pricing
- Minimum Price: Rose significantly to $65,000 in 2016 (up from $21,000 in 2015), signaling strengthened entry-level market values.
- Maximum Price: Decreased to $568,500 (from $699,000), indicating reduced high-end property sales.
- Average Price: Jumped to $281,767, a remarkable increase from $200,022 in 2015, suggesting overall property value appreciation.
- Median Price: Increased to $300,000 in 2016, almost doubling 2015’s $142,100, reflecting stronger mid-market sales.
Property Features
- Bedrooms: Expanded from 2-4 bedroom options in 2015 to 2-6 bedroom properties in 2016, offering more spacious homes.
- Bathrooms: Grew in range, with 2016 properties including up to 5 baths compared to 4 in 2015.
- Square Footage:
- Minimum Size: Increased to 1,024 sq. ft. (from 780 sq. ft.), emphasizing larger homes overall.
- Maximum Size: Slightly contracted to 4,000 sq. ft. (from 4,500 sq. ft.).
- Average Size: Rose significantly to 2,348 sq. ft. in 2016, from 1,943 sq. ft. in 2015, catering to families and groups needing bigger spaces.
- Median Size: Increased to 2,162 sq. ft., reflecting a preference for larger standard homes.
Lot Size
- Minimum Lot Size: Slightly decreased to 0.151 acres in 2016 (from 0.230 acres in 2015).
- Maximum Lot Size: Expanded to 36.587 acres (from 19.500 acres), creating opportunities for buyers seeking more land.
- Average Lot Size: Grew to 4.574 acres (from 4.445 acres), reflecting increased diversity.
Market Dynamics
-
Days on Market (DOM):
- Minimum DOM: Rose modestly to 4 days (from 2 days), indicating some cooling for quick sales.
- Maximum DOM: Lowered to 400 days in 2016 (compared to 463 days), only slightly trimming extended sale times for unique properties.
- Average DOM: Lengthened to 86 days (from 65 days), potentially reflecting higher-priced property adjustments.
-
ClsPr/LstPr (Close Price to List Price Ratio): Stayed consistent at around 95% across both years, showing stable buyer-seller pricing alignment.
-
ClsPr/OLP (Close Price to Original Listing Price): Lowered slightly to 93.51% (from 93.09%), indicating a marginal increase in price adjustments before closing.
-
Price Per Square Foot (Pr$/SqFt): Increased significantly to $118.01 (from $92.06), signaling rising property valuation.
Year Built
- Oldest Property Built: Adjusted to 1938 in 2016 (from 1910 in 2015), showing a shift in older inventory.
- Newest Property Built: Stayed consistent at 2016, reflecting continued opportunities for new builds.
- Average Year Built: Improved to 1997 (from 1985 in 2015), favoring more modern homes.
- Median Year Built: Moved up to 2003 (from 1991), highlighting newer home options.
Notable Market Shifts
- Bigger Homes: Increase in average number of bedrooms, bathrooms, and square footage showcased a demand for larger homes.
- Rising Prices: A striking surge in both median and average sales prices underlined increased property value.
- Market Timing: Longer average time on market and expanded price per square foot indicated a maturing, premium-focused market.
Overall, 2016 reflected a market evolving toward higher value, larger family-oriented living options, and a steadily growing economy.
Summary of Real Estate Market Analysis for Blue Ridge, TX in 2016
The 2016 real estate market in Blue Ridge, Texas showcased a year of consistent activity, expanding opportunities, and noticeable growth in property values. With a balance of affordability and rising demand for larger, family-oriented homes, the market evolved to meet the needs of homebuyers. Key trends, like the increase in average and median prices, emphasized a strengthening mid-market segment, while favorable economic factors such as lower electricity costs, gas prices, and mortgage rates further encouraged homeownership.
Sellers benefited from stable negotiation dynamics and steady demand, making 2016 a year of mutual opportunity. Blue Ridge’s real estate market remained resilient and forward-moving, setting a positive foundation for years to come.
Why Statistics Data is Important
Understanding past market data is essential for making informed decisions in today’s real estate landscape. Historical statistics provide a foundational perspective on trends, aiding in fair pricing and negotiation.
Unlock Exceptional Service!
Assistance with all your real estate needs in the Dallas-Fort Worth area is just a click or call away. Reach out at 214-940-8149 or connect through the links below.
Oleg Sedletsky REALTOR® in Blue Ridge, Texas. Call/Text 214.940.8149
Greetings! I’m Oleg Sedletsky, and I’m excited to introduce myself as your go-to full-time licensed Texas REALTOR® and Mortgage Loan Originator.
I proudly represent JPAR® – Real Estate Brokerage as a REALTOR® and Utopia Mortgage LLC as a Mortgage Loan Originator! My designations and certifications reflect my dedication to helping you achieve your real estate goals in Blue Ridge, TX and other locations in the vibrant Dallas-Fort Worth area!
My commitment to ongoing professional development means I’m always enhancing my skills to serve you better. You can count on me as your trusted expert throughout your real estate journey. Plus, I’m fluent in English, Ukrainian, and Russian and ready to assist you every step of the way!
It’s All About You and Your Real Estate Dreams!
My mission is to serve you! With my knowledge and expertise, I’m here to help you achieve all your real estate goals and turn your dreams into reality!
I’m passionate about helping buyers and sellers navigate the exciting real estate landscape in Blue Ridge, Texas! Whether you’re searching for your dream home, exploring land options, or looking for commercial properties, my Real Estate Services have you covered.
Contact me today for all your real estate needs in Blue Ridge, Texas! Call/text 214-940-8149
Discover Yearly Real Estate Market Trends for Blue Ridge, TX
2003-2010
Blue Ridge, TX Real Estate Market in 2003
Blue Ridge, TX Real Estate Market in 2004
Blue Ridge, TX Real Estate Market in 2005
Blue Ridge, TX Real Estate Market in 2006
Blue Ridge, TX Real Estate Market in 2007
Blue Ridge, TX Real Estate Market in 2008
2011-2020
Blue Ridge, TX Real Estate Market in 2011
Blue Ridge, TX Real Estate Market in 2012
Blue Ridge, TX Real Estate Market in 2013
Blue Ridge, TX Real Estate Market in 2014
Blue Ridge, TX Real Estate Market in 2015
Blue Ridge, TX Real Estate Market in 2016
Blue Ridge, TX Real Estate Market in 2017
Blue Ridge, TX Real Estate Market in 2018
This market analysis is intended solely for educational purposes. This market analysis is based on data sourced from NTREIS, Inc. This analysis is exclusively focused on single-family homes and does not account for other property types. The total number of real estate transactions within the specified period and location may vary. Data accuracy cannot be guaranteed due to potential input errors made by NTREIS users. This market analysis does not account for all new construction home sales. If you need detailed information about recorded property sales or other public records, please contact the appropriate city or county office.
Blue Ridge, TX Real Estate: 2015 Analysis of the Single-Family Residential Housing Market
The 2015 real estate market in Blue Ridge, TX displayed remarkable growth and diversity, making it an exciting year for both buyers and sellers. With 34 homes sold, the market showed higher activity than in previous years.
From entry-level properties to premium luxury homes, the market offered something for everyone. With economic factors favoring affordability and transaction efficiency, 2015 became a standout year in Blue Ridge, TX‘s real estate history.
Key Takeaways and Trends from Blue Ridge’s 2015 Real Estate Market
Pricing Range: The market featured a broad price spectrum, from accessible entry-level homes to a record-breaking luxury property, giving potential buyers extensive options.
Market Efficiency: Quicker average DOM and high buyer urgency for desirable properties highlighted an active and efficient market, balanced by ongoing negotiations for high-end inventory.
Unique Outliers: The standout $699,000 luxury property and the diverse array of smaller, older homes showcased the flexibility of Buba’s market in meeting various buyer needs.
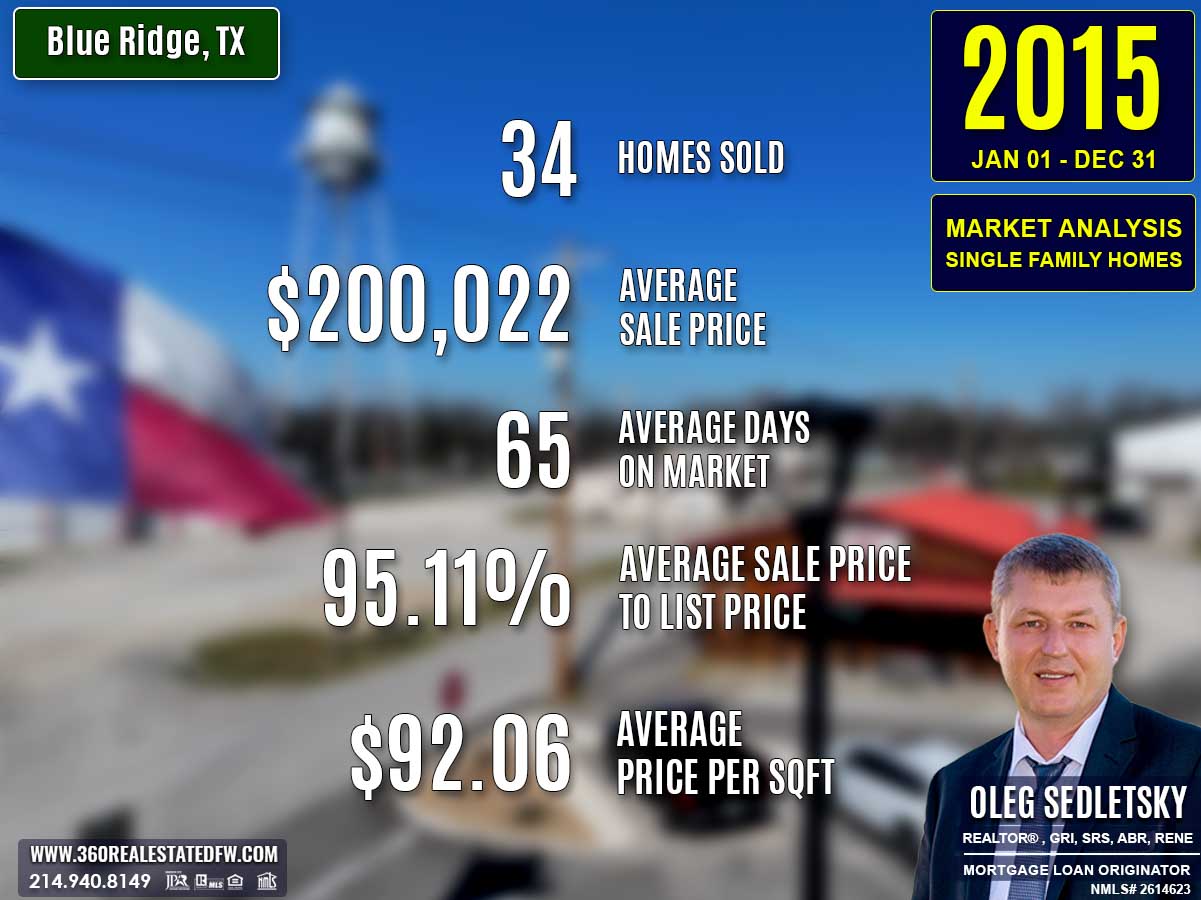
Total Homes Closed
A total of 34 residential single-family homes were closed during 2015. This marked a significant jump from the 22 homes sold in 2014, reflecting growing demand and an active market that catered to a variety of buyers.
Property Pricing Insights
The 2015 market showcased a wide range of property prices, offering affordability and opportunities for high-end investments:
- Minimum Price: $21,000
- Maximum Price: $699,000
- Average Price: $200,022
- Median Price: $142,100
The affordability at the lower range allowed access for first-time homebuyers, while the highest price signaled robust activity in the luxury segment.
Property Size and Features
Bedrooms & Bathrooms
Homes in 2015 were designed to cater to varying household needs:
- Bedrooms: Ranged from 2 to 4, with the majority averaging 3 bedrooms.
- Bathrooms: Offered between 1 to 4 baths, meeting both basic and premium buyer expectations.
Square Footage
Homes ranged in size to provide options for both small families and luxury buyers:
- Minimum Size: 780 sq. ft., appealing to those seeking compact living spaces.
- Maximum Size: 4,500 sq. ft., catering to premium buyers looking for expansive homes.
- Average Size: 1,943 sq. ft., slightly larger than in 2014.
- Median Size: 1,663 sq. ft., offering consistency for standard family preferences.
Lot Size
The lot sizes provided flexibility for buyers seeking different levels of privacy and land use:
- Minimum Lot Size: 0.230 acres.
- Maximum Lot Size: 19.500 acres.
- Average Lot Size: 4.445 acres.
Market Dynamics
Days on Market (DOM)
Homes in 2015 saw quicker transactions compared to 2014:
- Minimum Time: Just 2 days!
- Maximum Time: Extended to 463 days for unique or premium properties.
- Average Time: 65 days, an improvement over the previous year’s 76 days.
Close Price Ratios
- ClsPr/LstPr Ratio: Homes closed at 95.11% of their list price, slightly lower than in 2014.
- ClsPr/OLP Ratio: At 93.09%, this decline indicates more price adjustments for homes over long listing periods.
Price Per Square Foot
The $92.06 per square foot average showed a slight decrease from 2014, reflecting balancing trends in market value.
Insights into the Most Expensive Blue Ridge, TX Property Sold in 2015
The most expensive property sold in 2015 set a benchmark for luxury living in Blue Ridge, Texas.
Highlights of the Property:
- Price: $699,000
- Bedrooms: 4
- Bathrooms: 4 (3 full, 1 half)
- Square Footage: 4,500 sq. ft.
- Price per SqFt: $155.33
- Lot Size: 10.000 acres
- DOM: 8 days
- ClsPr/LstPr Ratio: 103.57%
- ClsPr/OLP Ratio: 103.57%
- Year Built: 2008
This property combined spacious living, modern construction, and an enviable lot size, selling above the original asking price in just 8 days.
Economic context
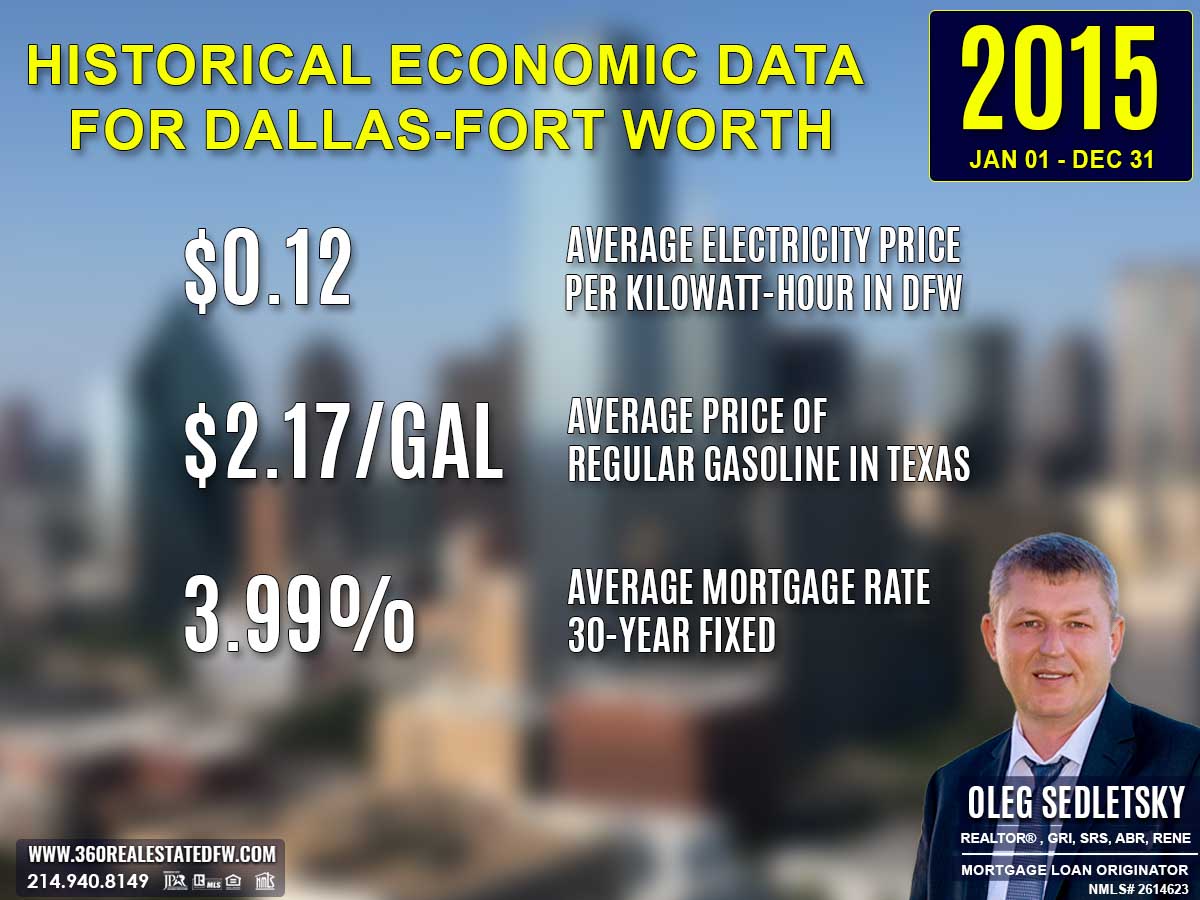
Average Electricity Costs in Dallas-Fort Worth in 2015
The average electricity cost fell to $0.12/kWh, providing slight relief to homeowners and increasing interest in energy-efficient properties.
Texas Average Gas Prices in 2015
Gas prices plummeted to $2.17 per gallon, making longer commutes more manageable, thus encouraging demand for suburban and rural properties in the market.
Average 30-Year Fixed Mortgage Rate in 2015
Mortgage rates declined to 3.99%, boosting affordability and helping facilitate higher sales volume.
Curious about today’s mortgage rates and the home you can comfortably afford?
Submit a no-obligation mortgage application today and get pre-approved to determine your budget and take the first step toward homeownership with confidence.
Summary of Differences Between 2014 and 2015 Real Estate Data for Blue Ridge, TX
The 2015 real estate market in Blue Ridge, Texas saw significant changes from 2014, characterized by higher activity, more affordability, and expanding property options. Below are the key differences:
Property Pricing Insights
- Minimum Price: Dropped to $21,000 in 2015 (from $44,000 in 2014), offering more affordable opportunities for buyers.
- Maximum Price: Surged to $699,000 in 2015 (from $425,000), demonstrating heightened luxury market activity.
- Average Price: Grew to $200,022 (from $179,811), signaling broader price appreciation.
- Median Price: Lowered slightly to $142,100 (from $148,500), indicating stronger sales in more affordable price brackets.
Property Features
-
Bedrooms:
- Ranged from 2 to 4 bedrooms in both years but included properties with smaller footprints in 2015.
-
Bathrooms: Both years offered up to 4 baths, remaining consistent in premium property features.
-
Square Footage:
- Minimum Size: Shrunk to 780 sq. ft. in 2015 (from 1,025 sq. ft. in 2014), signaling an increase in compact property sales.
- Maximum Size: Expanded to 4,500 sq. ft. (from 3,312 sq. ft.), reflecting greater luxury options.
- Average Size: Increased to 1,943 sq. ft. (from 1,722 sq. ft.), appealing to families and larger households.
- Median Size: Slightly up at 1,663 sq. ft. (from 1,643 sq. ft.), showing consistency in typical home sizes.
Lot Size Area
- Minimum Lot Size: Reduced marginally to 0.230 acres (from 0.240 acres), reflecting smaller parcels for entry-level homes.
- Maximum Lot Size: Declined to 19.500 acres (from 28.000 acres), limiting options for buyers seeking very large properties.
- Average Lot Size: Fell to 4.445 acres (from 6.044 acres), indicating a shift toward moderate-sized lots.
Market Dynamics
-
Days on Market (DOM):
- Minimum DOM: Dropped dramatically to 2 days in 2015 (from 4 days in 2014), highlighting quick sales of highly desirable listings.
- Maximum DOM: Extended to 463 days (from 330 days), reflecting prolonged sale times for certain properties.
- Average DOM: Improved to 65 days (from 76 days), showing stronger market efficiency.
-
ClsPr/LstPr Ratio (Close Price to List Price): Lowered to 95.11% in 2015 (from 97.07%), signaling slightly more negotiation in final sale prices.
-
ClsPr/OLP Ratio (Close Price to Original Listing Price): Declined to 93.09% (from 98.33%), suggesting more frequent price reductions.
-
Price Per Square Foot (Pr$/SqFt): Dropped slightly to $92.06 (from $98.74), indicating a slight rollback in per-unit value.
Year Built
- Oldest Property: Predates by 40 years, dating back to 1910 in 2015 (compared to 1950 in 2014), showcasing increased diversity in historical options.
- Newest Property: Advanced to 2015 (compared to 2007 in 2014), reflecting new construction in the marketplace.
- Average Year Built: Declined to 1985 (from 1991), likely due to the inclusion of older listings.
- Median Year Built: Dropped slightly to 1991 (from 1998), showing a broader inclusion of aging inventory.
Notable Market Shifts
- Broader Affordability: The wider range in pricing and smaller property sizes attracted more buyers at lower price points.
- Luxury Market Expansion: More premium properties entered the market, reflected in the higher maximum price and larger square footage.
- Efficient Sales: The faster average DOM indicates an active market, although some high-priced listings extended sale times.
- Moderation in Lot Sizes and Per SqFt Pricing: Reductions in lot sizes and small shifts in price per square foot emphasized affordability while retaining value.
Overall, 2015 reflected an energizing real estate market with higher sales volume, broader buyer choices, and marked affordability improvements, paving the way for a balanced and vibrant housing environment.
Summary of Real Estate Market Analysis for Blue Ridge, TX in 2015
The 2015 real estate market in Blue Ridge, TX showcased robust activity and an array of opportunities for Home-buyers and Home-sellers. With increased closed sales, wider pricing diversity, and faster market turnaround, the year marked substantial progress.
Affordable entry-level homes opened doors for first-time homebuyers, while the emergence of luxury properties reflected growing market confidence. Key performance metrics, such as reduced days on market and accessible mortgage rates, further cemented Blue Ridge, TX‘s position as a thriving and inclusive real estate landscape.
The year 2015 set the tone for sustained growth, making the market well-poised for continued success in subsequent years.
Why Statistics Data is Important
Understanding past market data is essential for making informed decisions in today’s real estate landscape. Historical statistics provide a foundational perspective on trends, aiding in fair pricing and negotiation.
Unlock Exceptional Service!
Assistance with all your real estate needs in the Dallas-Fort Worth area is just a click or call away. Reach out at 214-940-8149 or connect through the links below.
Oleg Sedletsky REALTOR® in Blue Ridge, Texas. Call/Text 214.940.8149
Greetings! I’m Oleg Sedletsky, and I’m excited to introduce myself as your go-to full-time licensed Texas REALTOR® and Mortgage Loan Originator.
I proudly represent JPAR® – Real Estate Brokerage as a REALTOR® and Utopia Mortgage LLC as a Mortgage Loan Originator! My designations and certifications reflect my dedication to helping you achieve your real estate goals in Blue Ridge, TX and other locations in the vibrant Dallas-Fort Worth area!
My commitment to ongoing professional development means I’m always enhancing my skills to serve you better. You can count on me as your trusted expert throughout your real estate journey. Plus, I’m fluent in English, Ukrainian, and Russian and ready to assist you every step of the way!
It’s All About You and Your Real Estate Dreams!
My mission is to serve you! With my knowledge and expertise, I’m here to help you achieve all your real estate goals and turn your dreams into reality!
I’m passionate about helping buyers and sellers navigate the exciting real estate landscape in Blue Ridge, Texas! Whether you’re searching for your dream home, exploring land options, or looking for commercial properties, my Real Estate Services have you covered.
Contact me today for all your real estate needs in Blue Ridge, Texas! Call/text 214-940-8149
Discover Yearly Real Estate Market Trends for Blue Ridge, TX
2003-2010
Blue Ridge, TX Real Estate Market in 2003
Blue Ridge, TX Real Estate Market in 2004
Blue Ridge, TX Real Estate Market in 2005
Blue Ridge, TX Real Estate Market in 2006
Blue Ridge, TX Real Estate Market in 2007
Blue Ridge, TX Real Estate Market in 2008
2011-2020
Blue Ridge, TX Real Estate Market in 2011
Blue Ridge, TX Real Estate Market in 2012
Blue Ridge, TX Real Estate Market in 2013
Blue Ridge, TX Real Estate Market in 2014
Blue Ridge, TX Real Estate Market in 2015
Blue Ridge, TX Real Estate Market in 2016
Blue Ridge, TX Real Estate Market in 2017
Blue Ridge, TX Real Estate Market in 2018
This market analysis is intended solely for educational purposes. This market analysis is based on data sourced from NTREIS, Inc. This analysis is exclusively focused on single-family homes and does not account for other property types. The total number of real estate transactions within the specified period and location may vary. Data accuracy cannot be guaranteed due to potential input errors made by NTREIS users. This market analysis does not account for all new construction home sales. If you need detailed information about recorded property sales or other public records, please contact the appropriate city or county office.
Blue Ridge, TX Real Estate: 2014 Analysis of the Single-Family Residential Housing Market
The 2014 real estate market in Blue Ridge, TX experienced a dynamic rebound from the prior year, marked by rising property values, improved market efficiency, and a return to luxury sales. A total of 22 homes were sold, showcasing the city’s flexibility in catering to diverse home-buyer needs. With stronger pricing trends, faster transactions, and an increase in property quality, Blue Ridge’s market solidified itself as a prime spot for both affordability and high-end investments.
Key Takeaways and Trends from Blue Ridge’s 2014 Real Estate Market
Pricing Range: With highs of $425,000 and lows of $44,000, the market in 2014 showed resilience and reopened doors to luxury sales while maintaining affordability in the entry-level segment. The sharp rise in average and median prices captured the market’s upward momentum.
Market Efficiency: Faster turnovers, a shorter average DOM, and improved closing-to-list price ratios signal a seller-friendly environment with quick buyer activity.
Unique Outliers: The reintroduction of ultra-large properties, expansive acreage, and four-bathroom homes shows growing activity in the premium housing segment.
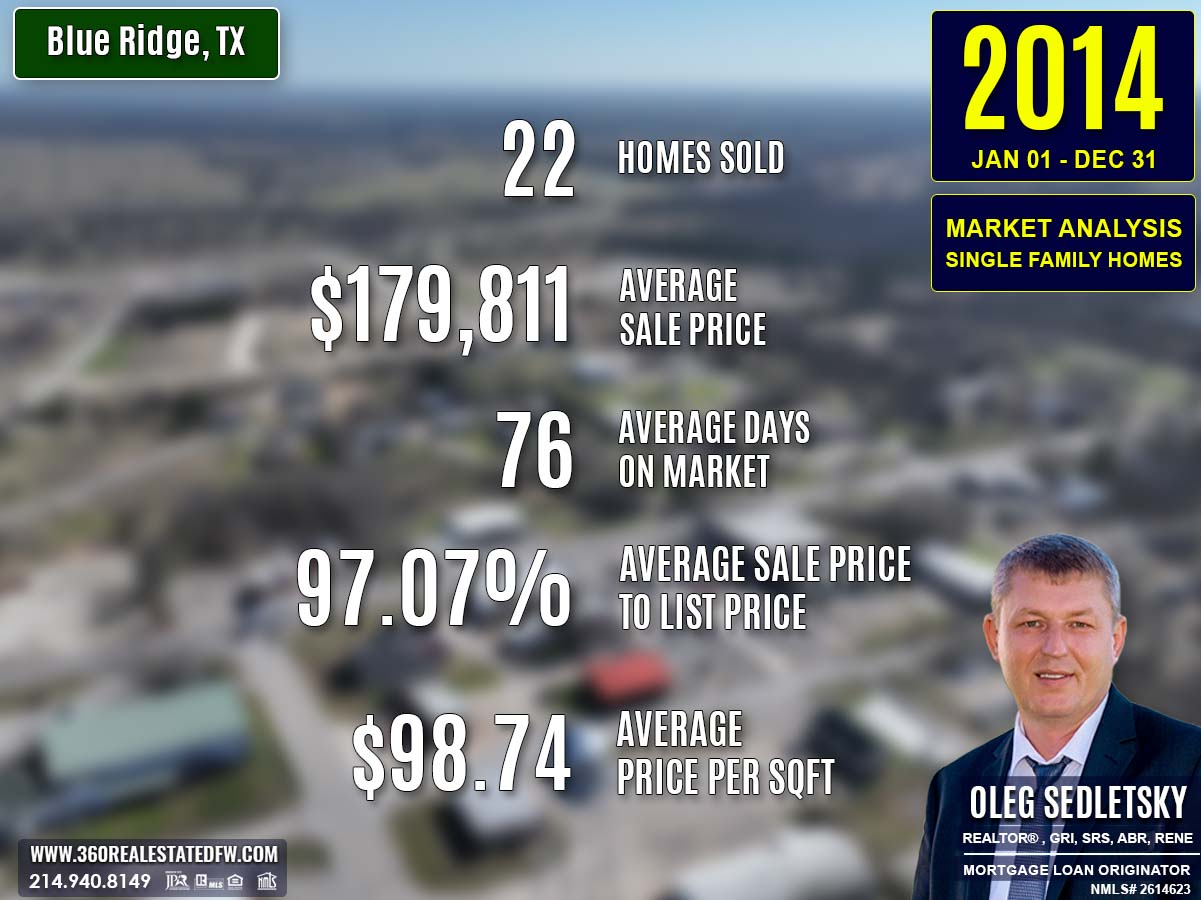
Total Homes Closed
The year saw 22 single-family residential homes closed, an uptick from the 21 in 2013. This slight increase reflects steady demand and growing interest from a wide pool of buyers, especially as the market diversified its offerings.
Property Pricing Insights
The 2014 market saw a significant jump in property values, spanning a broad range to meet the needs of different buyer profiles:
- Minimum Price: $44,000, a substantial increase from 2013’s $25,500, indicating better-valued entry-level homes.
- Maximum Price: $425,000, a marked rise from $260,000, reflecting the revitalization of luxury sales.
- Average Price: $179,811, a major improvement from $120,657, showcasing substantial growth in overall property values.
- Median Price: $148,500, an increase from $102,000, demonstrating sustained demand in the mid-market range.
The broad price spectrum underscored opportunities for first-time homebuyers as well as high-end investors.
Property Size and Features
Bedrooms & Bathrooms
The variety of homes sold in 2014 catered to families and individuals alike:
- Bedrooms: Homes included 2 to 4 bedrooms, with an average of 3 bedrooms.
- Bathrooms: Properties offered 1 to 4 baths, highlighting homes equipped with modern amenities.
Square Footage
Homes offered functional living spaces across different size ranges:
- Minimum Size: 1,025 sq. ft., a notable expansion from 792 sq. ft. in 2013.
- Maximum Size: 3,312 sq. ft., a significant increase from 2,429 sq. ft., pointing to the return of larger, luxury homes.
- Average Size: 1,722 sq. ft., up from 1,684 sq. ft., catering to growing family needs.
- Median Size: 1,643 sq. ft., relatively stable compared to 1,741 sq. ft. the previous year.
Lot Sizes
Lot sizes were more spacious:
- Minimum Lot Size: 0.240 acres, higher than 2013’s 0.070 acres, removing ultra-small options.
- Maximum Lot Size: 28.000 acres, up from 20.000 acres, offering larger plots for premium properties.
- Average Lot Size: 6.044 acres, nearly doubling from 3.559 acres.
Market Dynamics
The renewed energy in Blue Ridge’s market brought noticeable improvements in its dynamics:
-
Days on Market (DOM):
- Minimum: 4 days, faster than 2013’s 7 days.
- Maximum: 330 days, lengthening slightly from 289 days, driven by slower transactions for high-end listings.
- Average: 76 days, a sharp improvement from 103 days, reflecting better efficiency.
-
ClsPr/LstPr Ratio (Close Price to List Price): Increased to 97.07%, up from 95.67%, reflecting precise pricing and confident negotiation.
-
ClsPr/OLP Ratio (Close Price to Original Listing Price): Surged to 98.33%, from 90.65%, indicating fewer price reductions.
-
Price Per Square Foot (Pr$/SqFt): Climbed to $98.74, a significant jump from $69.12, underscoring rising market valuations.
Insights into the Most Expensive Blue Ridge, TX Property Sold in 2014
The year’s most expensive property captured the attention of luxury buyers, combining space, modern amenities, and attractive location.
Highlights:
- Price: $425,000
- Bedrooms: 4
- Bathrooms: 4 (3 full, 1 half)
- Square Footage: 3,312 sq. ft.
- Price Per Square Foot: $128.32
- Lot Size: 15.000 acres
- Days on Market (DOM): 82 days
- ClsPr/LstPr Ratio: 96.61%
- ClsPr/OLP Ratio: 94.87%
- Year Built: 2002
Economic context
Average Electricity Costs in Dallas-Fort Worth in 2014
Electricity costs rose slightly to $0.13 per kilowatt hour, emphasizing the increased value of energy-efficient homes in the market.
Texas Average Gas Prices in 2014
Homeowners benefited from moderate gas prices averaging $3.15 per gallon, making suburban and rural properties with longer commutes more appealing.
Average 30-Year Fixed Mortgage Rate in 2014
Mortgage rates increased slightly to 4.31%, yet remained attractive for homebuyers and investors.
Curious about today’s mortgage rates and the home you can comfortably afford?
Submit a no-obligation mortgage application today and get pre-approved to determine your budget and take the first step toward homeownership with confidence.
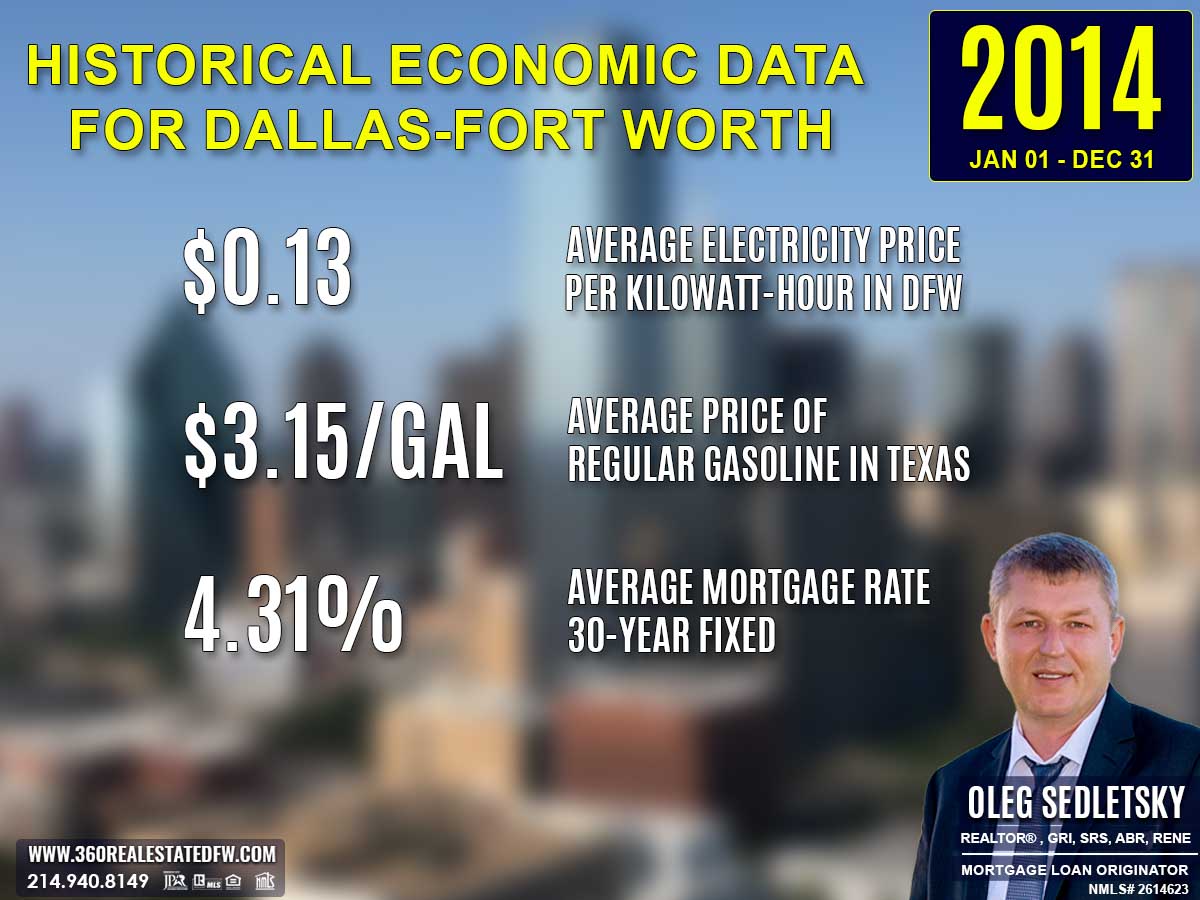
Summary of Differences Between 2013 and 2014 Real Estate Data for Blue Ridge, TX
The real estate market in Blue Ridge, TX in 2014 displayed significant growth and increased efficiency compared to 2013. Below are the key differences:
Property Pricing Insights
- Minimum Price: Increased to $44,000 in 2014 (from $25,500 in 2013), indicating higher value for entry-level homes.
- Maximum Price: Jumped to $425,000 (from $260,000), reflecting renewed activity in the luxury housing market.
- Average Price: Surged to $179,811 (from $120,657), showing overall market growth and a shift toward higher-priced offerings.
- Median Price: Climbed to $148,500 (from $102,000), illustrating stronger mid-market home sales.
Property Features
-
Bedrooms:
- Minimum Bedrooms: Dropped to 2 in 2014 (from 3 in 2013), offering affordability and options for smaller households.
- Maximum Bedrooms: Remained stable at 4 bedrooms.
-
Bathrooms: The maximum number of bathrooms increased to 4 baths in 2014 (from 3 baths in 2013), demonstrating improved diversity of amenities.
-
Square Footage:
- Minimum Size: Rose significantly to 1,025 sq. ft. (from 792 sq. ft.), ensuring even entry-level homes offered better space.
- Maximum Size: Surged to 3,312 sq. ft. (from 2,429 sq. ft.), reflecting luxury home growth.
- Average Size: Saw a modest increase to 1,722 sq. ft. (from 1,684 sq. ft.), catering to larger family needs.
- Median Size: Adjusted slightly to 1,643 sq. ft. (from 1,741 sq. ft.), maintaining consistency in mid-market offerings.
Lot Size Area
- Minimum Lot Size: Increased to 0.240 acres in 2014 (from 0.070 acres in 2013), eliminating ultra-small lot options.
- Maximum Lot Size: Swelled to 28.000 acres (from 20.000 acres), indicating stronger availability of larger plots.
- Average Lot Size: Jumped to 6.044 acres (from 3.559 acres), appealing to buyers seeking more expansive properties.
Market Dynamics
-
Days on Market (DOM):
- Minimum DOM: Dropped to 4 days in 2014 (from 7 days in 2013), showcasing an even faster turnaround for attractive listings.
- Maximum DOM: Increased to 330 days (from 289 days), emphasizing the slower sale of high-end properties.
- Average DOM: Shortened dramatically to 76 days (from 103 days), reflecting improved market efficiency.
-
ClsPr/LstPr Ratio (Close Price to List Price): Improved to 97.07% (from 95.67%), highlighting accurate seller pricing and strong buyer demand.
-
ClsPr/OLP Ratio (Close Price to Original Listing Price): Jumped to 98.33% (from 90.65%), suggesting fewer price reductions and strong market confidence.
-
Price Per Square Foot (Pr$/SqFt): Increased significantly to $98.74 (from $69.12), illustrating a notable rise in property valuation.
Year Built
- Oldest Property: Became slightly newer, with oldest properties dating back to 1950 (compared to 1935 in 2013).
- Newest Property: Advanced to 2007 from 2006, showing ongoing additions to inventory.
- Average Year Built: Upgraded to 1991 (from 1983 in 2013), indicating higher-quality properties.
- Median Year Built: Elevated to 1998 (from 1988), reflecting a shift toward more modern homes.
Notable Market Shifts
- Revived Luxury Market: There was a sharp increase in maximum prices, property sizes, and bathroom counts, signifying a resurgence in demand for high-end luxury homes.
- Improved Market Efficiency: Faster average DOM and higher ClsPr/LstPr and ClsPr/OLP ratios highlighted a seller-friendly environment with strong buyer competition.
- Higher Values Per Square Foot: The steep increase in price per square foot underscored growing property valuations and demand for better-quality homes.
Overall, 2014 cemented Blue Ridge, TX’s real estate market as a thriving and diversified landscape, catering to both affordable and luxury homebuyers.
Summary of Real Estate Market Analysis for Blue Ridge, TX in 2014
The 2014 real estate market in Blue Ridge, TX experienced a substantial upswing, with notable growth across pricing, property features, and market efficiency. A total of 22 homes were sold, signaling steady demand and attracting homebuyers across a wide range of budgets. Rising property values reflected increased investor confidence and a return to luxury home offerings, while affordability remained accessible for first-time home-buyers. Market dynamics showcased faster sales timelines and improved pricing accuracy, creating opportunities for both buyers and sellers to achieve their goals efficiently. With economic factors such as manageable mortgage rates and declining gas prices, Blue Ridge, TX‘s real estate market demonstrated resilience and versatility, setting the stage for a promising future of balanced growth and opportunity.
Why Statistics Data is Important
Understanding past market data is essential for making informed decisions in today’s real estate landscape. Historical statistics provide a foundational perspective on trends, aiding in fair pricing and negotiation.
Unlock Exceptional Service!
Assistance with all your real estate needs in the Dallas-Fort Worth area is just a click or call away. Reach out at 214-940-8149 or connect through the links below.
Oleg Sedletsky REALTOR® in Blue Ridge, Texas. Call/Text 214.940.8149
Greetings! I’m Oleg Sedletsky, and I’m excited to introduce myself as your go-to full-time licensed Texas REALTOR® and Mortgage Loan Originator.
I proudly represent JPAR® – Real Estate Brokerage as a REALTOR® and Utopia Mortgage LLC as a Mortgage Loan Originator! My designations and certifications reflect my dedication to helping you achieve your real estate goals in Blue Ridge, TX and other locations in the vibrant Dallas-Fort Worth area!
My commitment to ongoing professional development means I’m always enhancing my skills to serve you better. You can count on me as your trusted expert throughout your real estate journey. Plus, I’m fluent in English, Ukrainian, and Russian and ready to assist you every step of the way!
It’s All About You and Your Real Estate Dreams!
My mission is to serve you! With my knowledge and expertise, I’m here to help you achieve all your real estate goals and turn your dreams into reality!
I’m passionate about helping buyers and sellers navigate the exciting real estate landscape in Blue Ridge, Texas! Whether you’re searching for your dream home, exploring land options, or looking for commercial properties, my Real Estate Services have you covered.
Contact me today for all your real estate needs in Blue Ridge, Texas! Call/text 214-940-8149
Discover Yearly Real Estate Market Trends for Blue Ridge, TX
2003-2010
Blue Ridge, TX Real Estate Market in 2003
Blue Ridge, TX Real Estate Market in 2004
Blue Ridge, TX Real Estate Market in 2005
Blue Ridge, TX Real Estate Market in 2006
Blue Ridge, TX Real Estate Market in 2007
Blue Ridge, TX Real Estate Market in 2008
2011-2020
Blue Ridge, TX Real Estate Market in 2011
Blue Ridge, TX Real Estate Market in 2012
Blue Ridge, TX Real Estate Market in 2013
Blue Ridge, TX Real Estate Market in 2014
Blue Ridge, TX Real Estate Market in 2015
Blue Ridge, TX Real Estate Market in 2016
Blue Ridge, TX Real Estate Market in 2017
Blue Ridge, TX Real Estate Market in 2018
This market analysis is intended solely for educational purposes. This market analysis is based on data sourced from NTREIS, Inc. This analysis is exclusively focused on single-family homes and does not account for other property types. The total number of real estate transactions within the specified period and location may vary. Data accuracy cannot be guaranteed due to potential input errors made by NTREIS users. This market analysis does not account for all new construction home sales. If you need detailed information about recorded property sales or other public records, please contact the appropriate city or county office.
Blue Ridge, TX Real Estate: 2013 Analysis of the Single-Family Residential Housing Market
The 2013 real estate market in Blue Ridge, TX transitioned into a stabilization phase following the growth witnessed in prior years. With 21 single-family homes sold, the market displayed steady activity while re-calibrating prices and features to align with mid-market demands. Changing home-buyer preferences, affordability trends, and evolving economic conditions influenced the market’s dynamics, paving the way for a sustainable housing landscape.
Key Takeaways and Trends from Blue Ridge’s 2013 Real Estate Market
Pricing Range: The 2013 market experienced a noticeable decline in price ranges, with reduced maximum prices signaling lower luxury sales. Simultaneously, the affordability of entry-level homes remained a priority, as illustrated by declines in minimum and median prices. These trends underscored the market’s focus on value-driven buyers and mid-market affordability.
Market Efficiency: Efficiency remained strong, with shortened DOM and improved ClsPr/LstPr and ClsPr/OLP ratios. Sellers benefitted from faster turnovers, achieving close-to-list prices, while buyers enjoyed fair market rates, sustaining a balanced marketplace.
Unique Outliers: The most prominent outliers included smaller, affordable homes at one end and limited luxury availability at the other. Expansive properties with large lots became noticeably scarcer in 2013, with inventory aligning more closely with functional, family-friendly housing.
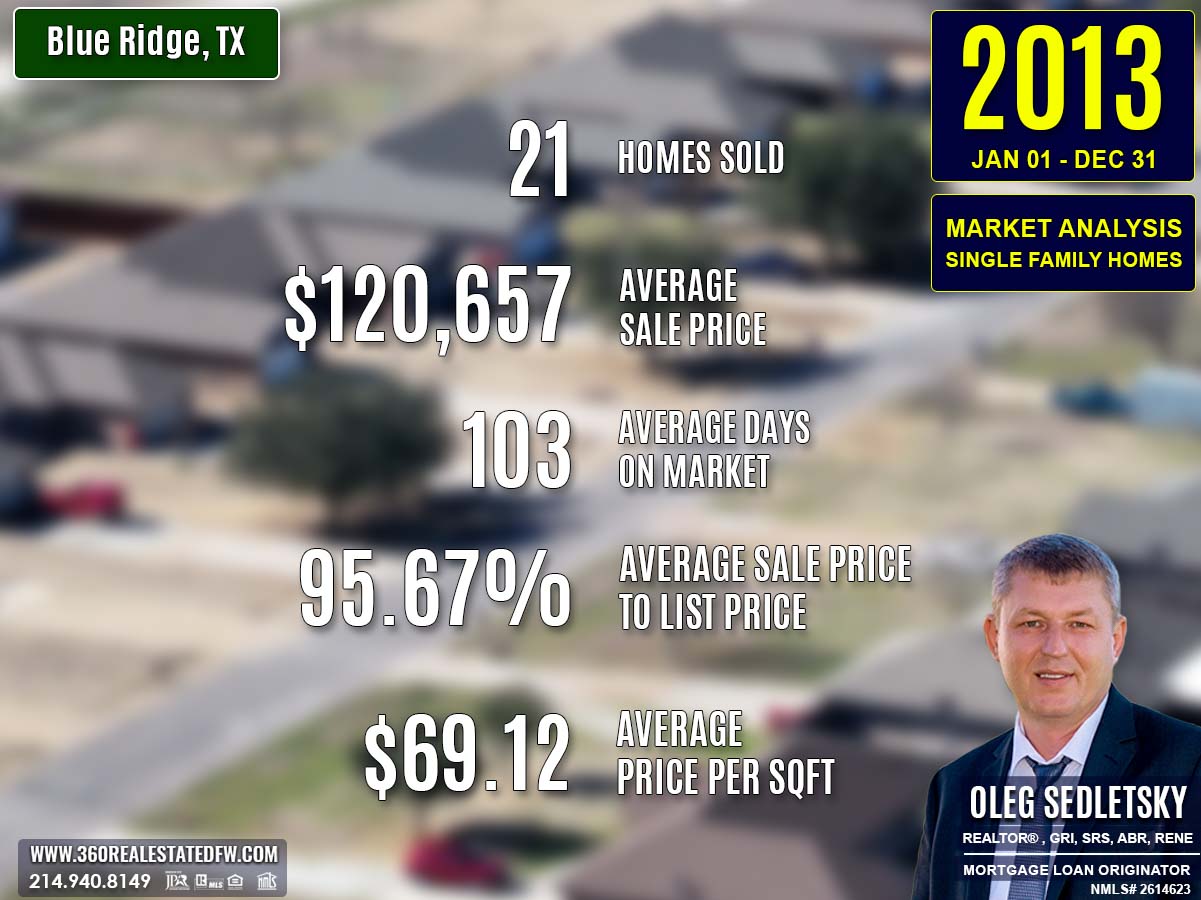
Total Homes Closed
A total of 21 residential single-family homes were sold in 2013. This number marked a slowdown from 27 sales in 2012, reflecting a shift toward steady yet moderate buyer activity.
Property Pricing Insights
Property prices in 2013 adjusted to reflect affordability and the growing preference for mid-market homes:
- Minimum Price: $25,500, a drop from 2012’s $31,501, highlighting better affordability.
- Maximum Price: $260,000, down from $422,000 in 2012, indicating lower luxury market activity.
- Average Price: $120,657, a decline from $170,390 in 2012, showing a general market re-calibration.
- Median Price: $102,000, down from $118,000, underscoring consistent affordability in the mid-market segment.
The downward adjustments in price metrics demonstrated buyer preference for smaller, cost-effective homes over expansive luxury properties.
Property Size and Features
The properties sold in 2013 catered to families and individuals seeking functional, mid-sized homes:
- Bedrooms: Ranged from 3 to 4 bedrooms, averaging 3 bedrooms, accommodating family needs.
- Bathrooms: Offered up to 3 total baths, with most having 2 full baths, aligning with modern living standards.
- Square Footage:
- Minimum Size: 792 sq. ft., smaller than 2012’s smallest at 800 sq. ft., ensuring compact options.
- Maximum Size: 2,429 sq. ft., a significant decline from 4,684 sq. ft. in 2012, indicative of reduced luxury offerings.
- Average Size: 1,684 sq. ft., down from 1,966 sq. ft., reflecting buyer favor toward practical living spaces.
- Median Size: 1,741 sq. ft., relatively consistent with previous years, satisfying mid-market buyers.
Lot Sizes
Lot sizes also experienced a contraction:
- Minimum Lot Size: 0.070 acres, up from 0.000 acres, removing townhome-style listings.
- Maximum Lot Size: 20.000 acres, lower than 47.470 acres in 2012, signaling fewer expansive lots.
- Average Lot Size: 3.559 acres, reduced from 7.686 acres, reflecting manageable ownership preferences.
Market Dynamics
Efficiency remained a hallmark of the Blue Ridge, TX market in 2013, even as transaction volume slowed:
-
Days on Market (DOM):
- Minimum DOM: 7 days, slightly more than 5 in 2012, indicating longer quick sales.
- Maximum DOM: 289 days, shorter than 381, demonstrating better turnover of high-end homes.
- Average DOM: Improved to 103 days, a slight decrease from 111 in 2012.
-
ClsPr/LstPr Ratio (Close Price to List Price): Rose to 95.67%, reflecting sellers achieving prices close to their listings.
-
ClsPr/OLP Ratio (Close Price to Original Listing Price): Improved slightly to 90.65%, showcasing solid market demand and negotiable pricing trends.
-
Price Per Square Foot (Pr$/SqFt): Fell to $69.12 from $83.11 in 2012, reflecting the market’s re-calibrated valuations.
Insights into the Most Expensive Blue Ridge, TX Property Sold in 2013
The highest-priced sale of 2013 epitomized a shift toward functional luxury within the mid-market. Selling for $260,000, this home combined practical interior layouts with manageable outdoor space.
Key Highlights:
- Price: $260,000
- Bedrooms: 4
- Bathrooms: 3 (2 full and 1 half bath)
- Square Footage: 2,255 sq. ft.
- Price Per Square Foot: $115.30
- Lot Size: 3.800 acres
- Days on Market (DOM): 34 days
- ClsPr/LstPr Ratio: 98.11%
- ClsPr/OLP Ratio: 98.11%
- Year Built: 2003
This home appealed to buyers seeking move-in-ready properties with modern amenities on a spacious yet manageable lot.
Economic context
Average Electricity Costs in Dallas-Fort Worth in 2013
Electricity costs edged slightly higher in 2013, with an average price of $0.12 per kilowatt hour. This modest rise nudged utility expenses upward, emphasizing the growing importance of energy-efficient homes in the market.
Texas Average Gas Prices in 2013
The average gas price fell to $3.32 per gallon, offering some relief for homeowners concerned about commuting costs. Properties closer to urban centers became more attractive, as buyers sought savings on transportation amidst economic stabilization.
Average 30-Year Fixed Mortgage Rate in 2013
Mortgage rates climbed to 4.16%, nudging higher but remaining relatively affordable for homebuyers. This slight increase encouraged budget-conscious purchasing patterns.
Curious about today’s mortgage rates and the home you can comfortably afford?
Submit a no-obligation mortgage application today and get pre-approved to determine your budget and take the first step toward homeownership with confidence.

Summary of Differences Between 2012 and 2013 Real Estate Data for Blue Ridge, TX
While the 2012 real estate market in Blue Ridge, TX showed growth and strong activity, 2013 displayed a stabilization period with a shift in pricing trends and property features. Here are the key changes:
Property Pricing Insights
- Minimum Price: Decreased to $25,500 in 2013 (from $31,501 in 2012), marking an increase in affordability for entry-level buyers.
- Maximum Price: Dropped to $260,000 in 2013 (from $422,000 in 2012), reflecting decreased activity in the luxury market.
- Average Price: Declined significantly to $120,657 (from $170,390 in 2012), signaling a market re-calibration to more moderate prices.
- Median Price: Fell to $102,000 (from $118,000), underscoring a shift toward mid-market affordability.
Property Features
-
Bedrooms:
- Minimum Bedrooms: Increased to 3 in 2013 (from 1 in 2012), focusing on family-sized homes.
- Maximum Bedrooms: Decreased to 4 (from 5 in 2012), limiting availability for larger households.
-
Bathrooms: The maximum decreased to 3 baths in 2013 (from 5 baths in 2012), reflecting fewer luxury home offerings.
-
Square Footage:
- Minimum Size: Shrunk slightly to 792 sq. ft. (from 800 sq. ft.), maintaining compact housing options.
- Maximum Size: Decreased to 2,429 sq. ft. (from 4,684 sq. ft.), lowering inventory of large homes.
- Average Size: Reduced to 1,684 sq. ft. (from 1,966 sq. ft.), showing a preference for mid-sized homes.
- Median Size: Stayed relatively stable at 1,741 sq. ft. (from 1,724 sq. ft.), reinforcing buyer preferences.
Lot Size Area
- Minimum Lot Size: Increased to 0.070 acres in 2013 (from 0.000 acres in 2012), eliminating zero-lot-line options.
- Maximum Lot Size: Lowered significantly to 20.000 acres (from 47.470 acres), tightening availability of large plots.
- Average Lot Size: Decreased to 3.559 acres (from 7.686 acres), reflecting demand for more manageable spaces.
Market Dynamics
-
Days on Market (DOM):
- Minimum DOM: Increased slightly to 7 days (from 5 days in 2012).
- Maximum DOM: Reduced to 289 days (from 381 days), encouraging faster turnover of higher-end properties.
- Average DOM: Shortened to 103 days (from 111 days), highlighting improved overall market efficiency.
-
ClsPr/LstPr Ratio (Close Price to List Price): Edged up to 95.67% (from 95.16%), showing sellers were able to close closer to their asking prices.
-
ClsPr/OLP Ratio (Close Price to Original Listing Price): Improved slightly to 90.65% (from 90.62%), signaling reduced price negotiation.
-
Price Per Square Foot (Pr$/SqFt): Fell to $69.12 (from $83.11), reflecting re-calibrated property valuations.
Year Built
- Oldest Property: Became older, as the oldest property shifted to 1935 (from 1960 in 2012).
- Newest Property: Changed to 2006 (from 2009), indicating less newly-built inventory.
- Average Year Built: Dropped to 1983 (from 1994), showcasing an emphasis on older homes.
- Median Year Built: Lowered to 1988 (from 2000), underscoring the market’s slight shift away from modern construction.
Key Observations
- Re-calibration in Pricing: Decreases in maximum, average, and median prices point to a shift from high-end to mid-market properties, aligning with affordability trends.
- Shift in Property Features: The inventory prioritized mid-sized, family-friendly homes over expansive or luxury properties.
- Improved Market Activity: Shorter average DOM and stable closing-to-list ratios suggest a more efficient marketplace, even as activity slowed slightly.
- Lot Sizes and Age Trend: Smaller lots and older homes gained prominence, indicating a shift in buyer priorities toward manageable properties and affordability.
Overall, the 2013 market in Blue Ridge, TX moved toward stabilization and re-calibration after 2012’s highs, balancing affordability with consistent buyer demand.
Summary of Real Estate Market Analysis for Blue Ridge, TX in 2013
The 2013 Blue Ridge, TX real estate market reflected a transitional phase, focused on re-calibrated prices and family-oriented properties. Home-Buyers continued to show interest in well-valued homes, while Home-Sellers adjusted to market trends favoring practicality over excess. Despite lower transaction volume, strong closing-to-list ratios and reasonable DOM pointed to a healthy and balanced marketplace.
Why Statistics Data is Important
Understanding past market data is essential for making informed decisions in today’s real estate landscape. Historical statistics provide a foundational perspective on trends, aiding in fair pricing and negotiation.
Unlock Exceptional Service!
Assistance with all your real estate needs in the Dallas-Fort Worth area is just a click or call away. Reach out at 214-940-8149 or connect through the links below.
Oleg Sedletsky REALTOR® in Blue Ridge, Texas. Call/Text 214.940.8149
Greetings! I’m Oleg Sedletsky, and I’m excited to introduce myself as your go-to full-time licensed Texas REALTOR® and Mortgage Loan Originator.
I proudly represent JPAR® – Real Estate Brokerage as a REALTOR® and Utopia Mortgage LLC as a Mortgage Loan Originator! My designations and certifications reflect my dedication to helping you achieve your real estate goals in Blue Ridge, TX and other locations in the vibrant Dallas-Fort Worth area!
My commitment to ongoing professional development means I’m always enhancing my skills to serve you better. You can count on me as your trusted expert throughout your real estate journey. Plus, I’m fluent in English, Ukrainian, and Russian and ready to assist you every step of the way!
It’s All About You and Your Real Estate Dreams!
My mission is to serve you! With my knowledge and expertise, I’m here to help you achieve all your real estate goals and turn your dreams into reality!
I’m passionate about helping buyers and sellers navigate the exciting real estate landscape in Blue Ridge, Texas! Whether you’re searching for your dream home, exploring land options, or looking for commercial properties, my Real Estate Services have you covered.
Contact me today for all your real estate needs in Blue Ridge, Texas! Call/text 214-940-8149
Discover Yearly Real Estate Market Trends for Blue Ridge, TX
2003-2010
Blue Ridge, TX Real Estate Market in 2003
Blue Ridge, TX Real Estate Market in 2004
Blue Ridge, TX Real Estate Market in 2005
Blue Ridge, TX Real Estate Market in 2006
Blue Ridge, TX Real Estate Market in 2007
Blue Ridge, TX Real Estate Market in 2008
2011-2020
Blue Ridge, TX Real Estate Market in 2011
Blue Ridge, TX Real Estate Market in 2012
Blue Ridge, TX Real Estate Market in 2013
Blue Ridge, TX Real Estate Market in 2014
Blue Ridge, TX Real Estate Market in 2015
Blue Ridge, TX Real Estate Market in 2016
Blue Ridge, TX Real Estate Market in 2017
Blue Ridge, TX Real Estate Market in 2018
This market analysis is intended solely for educational purposes. This market analysis is based on data sourced from NTREIS, Inc. This analysis is exclusively focused on single-family homes and does not account for other property types. The total number of real estate transactions within the specified period and location may vary. Data accuracy cannot be guaranteed due to potential input errors made by NTREIS users. This market analysis does not account for all new construction home sales. If you need detailed information about recorded property sales or other public records, please contact the appropriate city or county office.
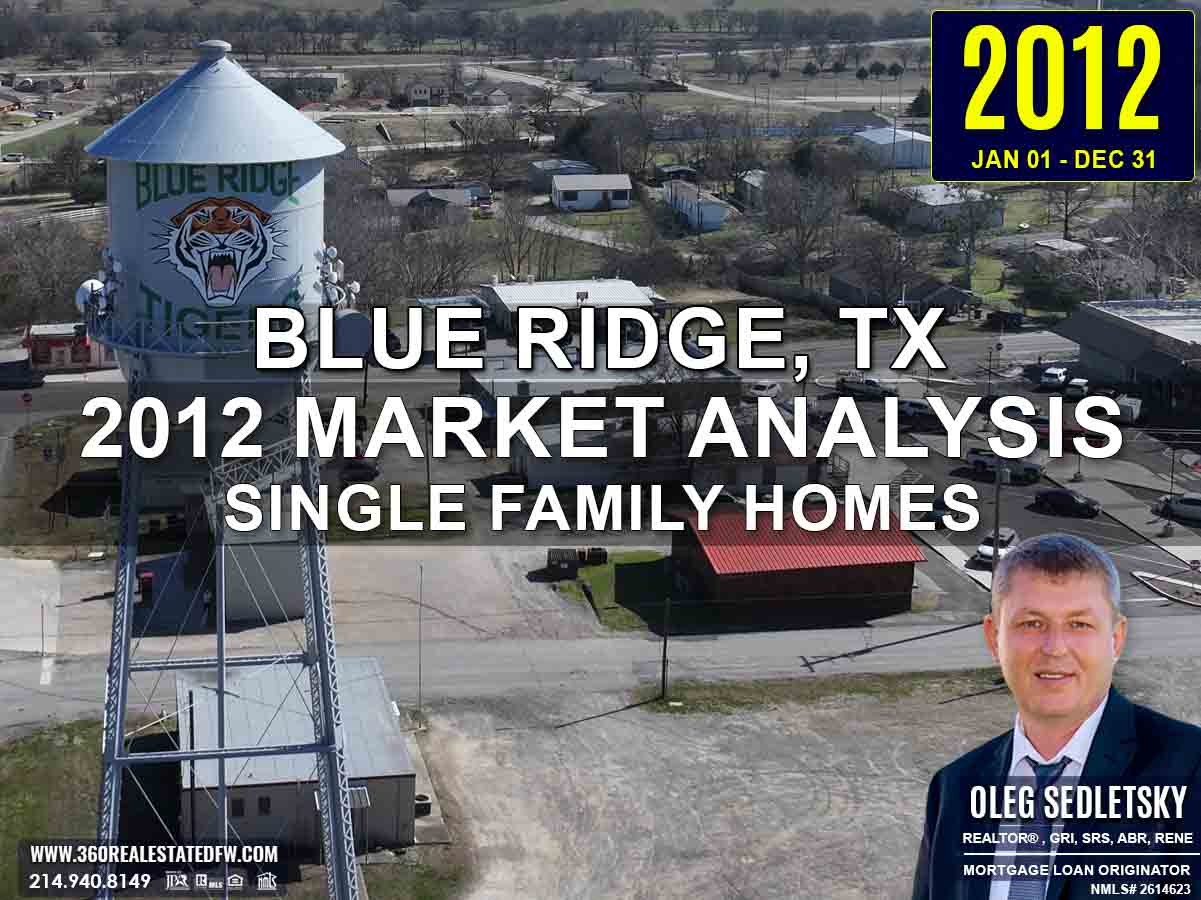
Blue Ridge, TX Real Estate: 2012 Analysis of the Single-Family Residential Housing Market
The 2012 real estate market in Blue Ridge, TX demonstrated robust growth, marked by increased transaction activity, a booming luxury segment, and diverse inventory catering to a wider buyer demographic. With 27 properties sold, nearly doubling the sales of the previous year, the market signaled a strong recovery driven by favorable economic conditions like low mortgage rates and improving buyer confidence.
Key Takeaways and Trends from Blue Ridge’s 2012 Real Estate Market
Pricing Range: The range of prices increased significantly, with the maximum price rising from $300,000 to $422,000, reflecting a reinvigorated demand for high-end homes. Meanwhile, the median price surged to $118,000, demonstrating growing strength in the mid-market segment. This rise in prices was accompanied by improved buyer expectations of property value.
Market Efficiency: Although sales efficiency slowed slightly, with average DOM rising to 111 days, the ClsPr/LstPr ratio of 95.16% indicated that properties consistently sold closer to their asking prices. This balance suggested a more mature market capable of accommodating both sellers’ and buyers’ needs efficiently.
Unique Outliers: Luxury properties had a standout year in 2012. The largest homes exceeded 4,600 sq. ft. on spacious lots of up to 47 acres, meeting buyer demand for size and exclusivity. At the same time, inventory also expanded to include compact, entry-level homes priced as low as $31,501, catering to first-time buyers and smaller families.
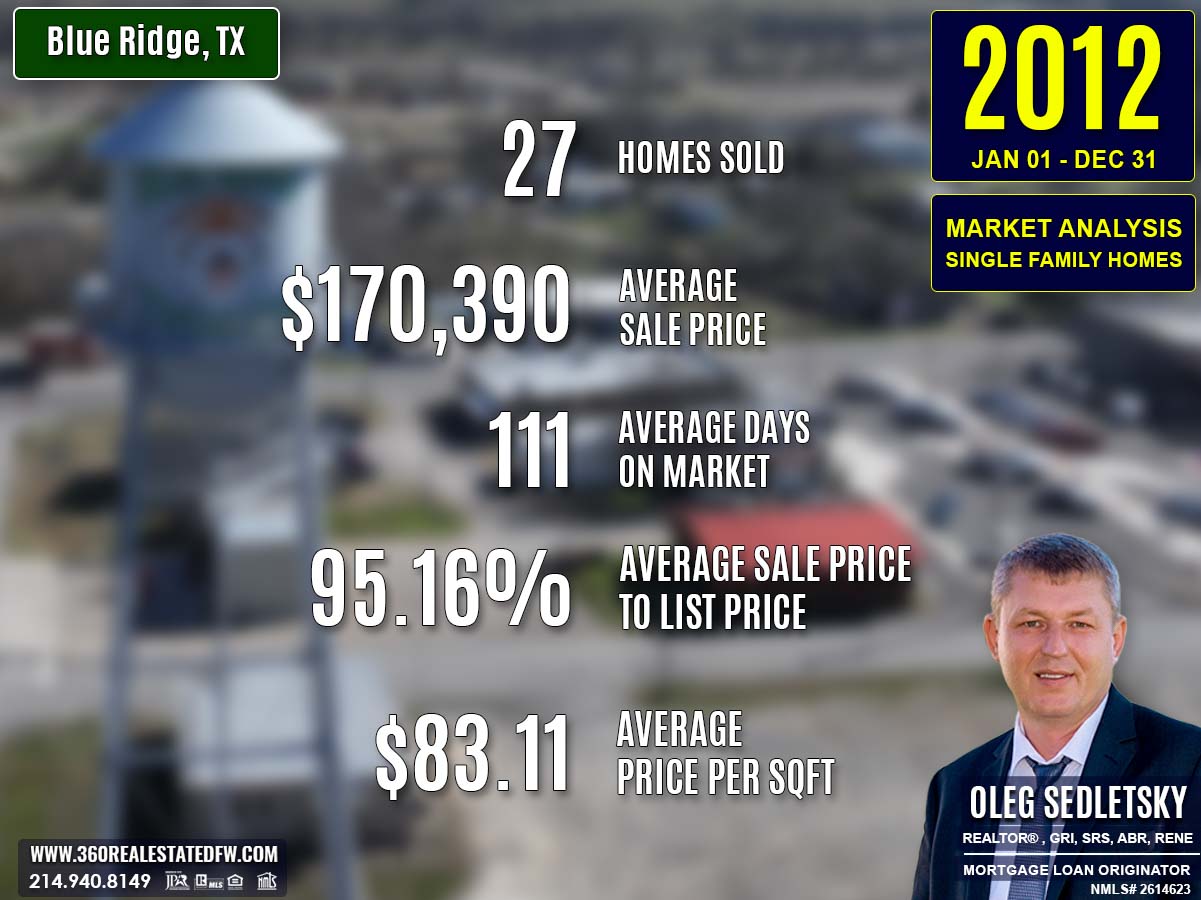
Total Homes Closed
A total of 27 residential single-family homes closed in 2012, a significant jump from the 14 homes sold in 2011. This surge in activity showcased renewed interest in property investments and marked a turning point for the local market.
Property Pricing Insights
The pricing trends in 2012 provided opportunities for both affordability-driven and luxury-seeking buyers:
- Minimum Price: $31,501 (a slight increase from 2011’s $26,000).
- Maximum Price: $422,000 (up from $300,000, indicating a resurgence in high-end property transactions).
- Average Price: $170,390 (an impressive rise from $102,052 in 2011, reflecting stronger valuations).
- Median Price: $118,000 (up from $78,650, showing strengthened mid-market activity).
The spike in both average and median prices suggested a healthier market trending toward competitive pricing across all segments.
Property Size and Features
The 2012 market offered larger homes and diverse layouts, appealing to both families and individuals:
- Bedrooms: Homes provided 1 to 5 bedrooms, with an average of 3 bedrooms, balancing smaller residences with options for larger households.
- Bathrooms: Properties featured up to 5 total baths (4 full and 1 half), averaging 2 baths—a notable shift to accommodating modern living standards.
- Square Footage:
- Minimum Size: 800 sq. ft. (slightly below 2011’s 866 sq. ft., highlighting compact, affordable choices).
- Maximum Size: 4,684 sq. ft. (a substantial increase from 2,862 sq. ft., showcasing a strong luxury segment).
- Average Size: 1,966 sq. ft., reflecting buyers’ preference for more spacious homes.
- Median Size: 1,724 sq. ft., a slight growth aligning with mid-market buyer needs.
- Lot Size Area: Homes offered significantly larger options, with maximum lot sizes reaching 47.470 acres and an average of 7.686 acres, ideal for buyers seeking privacy or land for development.
Market Dynamics
The market in 2012 experienced a blend of faster selling times and improved seller efficiency in achieving listed prices:
- Days on Market (DOM):
- Minimum DOM: Rose to 5 days (from just 2 days in 2011).
- Maximum DOM: Increased to 381 days (compared to 282 days in 2011), reflecting some lingering inventory in luxury properties.
- Average DOM: Grew to 111 days (from 101 days), demonstrating a slight slowdown in market velocity.
- ClsPr/LstPr Ratio: Improved to 95.16%, meaning sellers closed at prices much closer to their listings.
- ClsPr/OLP Ratio: Climbed significantly to 90.62%, suggesting a decrease in price cuts needed to finalize sales.
- Price Per Square Foot (Pr$/SqFt): Jumped to $83.11 (from $61.97), signifying better valuations for residential properties.
This marked a market stabilization, with sellers achieving higher returns while buyers continued to find well-valued properties.
Insights into the Most Expensive Blue Ridge, TX Property Sold in 2012
The most luxurious property of 2012 emphasized high-end amenities and space, attracting serious buyer interest. With a selling price of $422,000, this impressive home stood out for its spacious layout and prime features.
Key Highlights:
- Price: $422,000
- Bedrooms: 5
- Bathrooms: 5 total (4 full and 1 half bath)
- Square Footage: 4,684 sq. ft.
- Price Per Square Foot: $90.09
- Lot Size: 18.690 acres
- Days on Market (DOM): 27
- ClsPr/LstPr (Close Price to List Price): 93.99%
- ClsPr/OLP (Close Price to Original Listing Price): 93.99%
- Year Built: 1986
This property showcased the strong interest in luxury homes, built on expansive lots and modern layouts.
Economic context
Average Electricity Costs in Dallas-Fort Worth in 2012
The average electricity price remained steady at $0.11 per kilowatt hour, providing predictable utility costs for homeowners. Energy-conscious buyers continued exploring options to optimize household expenses while retrofitting older homes to modern standards.
Texas Average Gas Prices in 2012
Gas prices climbed slightly to $3.42 per gallon, increasing commuting costs. Buyers’ preferences shifted toward properties closer to work or with accessibility to public transportation, balancing rising transportation costs with housing affordability.
Average 30-Year Fixed Mortgage Rate in 2012
With mortgage rates dropping historically low to 3.88%, affordability drove significant activity in all price ranges. This continued to encourage home-buyers to invest in larger or higher-end homes while keeping monthly payments manageable.
Curious about today’s mortgage rates and the home you can comfortably afford?
Submit a no-obligation mortgage application today and get pre-approved to determine your budget and take the first step toward homeownership with confidence.

Summary of Differences Between 2011 and 2012 Real Estate Data for Blue Ridge, TX
The 2012 real estate market in Blue Ridge, TX outperformed 2011 in terms of activity and pricing, with several key changes indicating a more dynamic and diverse marketplace.
Property Pricing Insights
- Minimum Current Price: Increased to $31,501 (from $26,000 in 2011), reflecting a slight uplift in the entry-level market.
- Maximum Current Price: Jumped significantly to $422,000 (from $300,000 in 2011), highlighting resurgence in luxury property sales.
- Average Price: Skyrocketed to $170,390 (from $102,052), almost doubling and signaling stronger buyer demand and property valuations.
- Median Price: Grew considerably to $118,000 (from $78,650), showing robust mid-market activity.
Property Features
-
Bedrooms:
- Minimum Bedrooms: Decreased to 1 (from 2 in 2011), accommodating smaller households.
- Maximum Bedrooms: Expanded to 5 (up from 4), providing more options for larger families.
-
Bathrooms: Grew from a maximum of 3 in 2011 to 5 in 2012, marking an appeal for higher-end, multi-bathroom properties.
-
Square Footage:
- Minimum Size: Reduced slightly to 800 sq. ft. (from 866 sq. ft. in 2011), creating affordable compact home options.
- Maximum Size: Swelled to 4,684 sq. ft. (from 2,862 sq. ft.), showcasing a return of larger luxury homes.
- Average Size: Increased to 1,966 sq. ft. (from 1,749 sq. ft.), meeting buyer preference for homes with more space.
- Median Size: Held steady near 1,724 sq. ft.
Lot Size Area
- Minimum Lot Size: Dropped to 0.000 acres (from 0.254 acres in 2011), likely reflecting properties with no yard or shared spaces.
- Maximum Lot Size: Expanded to 47.470 acres (from 40.808 acres), creating premium opportunities for buyers seeking expansive land.
- Average Lot Size: Fell to 7.686 acres (from 9.087 acres), indicating moderate downsizing in typical property plots.
Market Dynamics
-
Days on Market (DOM):
- Minimum DOM: Increased to 5 days (from 2 days in 2011), slowing slightly for the fastest sales.
- Maximum DOM: Increased to 381 days (from 282 days), reflecting lingering higher-end inventory.
- Average DOM: Rose to 111 days (from 101 days), suggesting a marginal slowdown in market turnover.
-
ClsPr/LstPr (Close Price to List Price Ratio): Improved to 95.16% (from 90.62%), indicating sellers were achieving prices closer to their expectations.
-
ClsPr/OLP (Close Price to Original Listing Price Ratio): Rose significantly to 90.62% (from 84.81%), showing reduced price cuts and strong buyer competition.
-
Price Per SqFt (Pr$/SqFt): Climbed to $83.11 (from $61.97), reflecting healthier valuations across all segments.
Year Built
- Oldest Property: Became newer, with the oldest property built in 1960 (from 1910 in 2011).
- Newest Property: Moved forward to 2009 (from 2005), indicating more modern inventory.
- Average Year Built: Advanced to 1994 (from 1976), reflecting the skew toward newer homes.
- Median Year Built: Jumped to 2000 (from 1981), showcasing an overall focus on relatively modern properties.
Key Observations
- Significant Market Growth: A sharp rise in total transactions (from 14 in 2011 to 27 in 2012) demonstrated renewed buyer confidence and market activity.
- Higher-End Properties: Luxury homes regained popularity, with increased maximum price, square footage, and bathrooms.
- Strong Valuations: Higher average and median prices, along with increased price per square foot, highlighted a recalibration of the market toward healthier pricing.
- Broader Inventory Diversity: With a mix of smaller, entry-level homes and expansive luxury options, the 2012 market catered to a wider buyer base.
Overall, the 2012 market returned stronger both in volume and pricing, capitalizing on optimal economic conditions like low mortgage rates. It set the stage for continued growth and diversity.
Summary of Real Estate Market Analysis for Blue Ridge, TX in 2012
The 2012 real estate market in Blue Ridge, TX highlighted impressive growth across all segments. Transaction activity nearly doubled, driven by increased affordability, larger homes, and the resurgence of luxury inventory. Improved price valuations, a wider range of housing options, and record-low mortgage rates created an ideal environment for both homebuyers and home-sellers, suggesting a market at its most balanced in recent years.
Why Statistics Data is Important
Understanding past market data is essential for making informed decisions in today’s real estate landscape. Historical statistics provide a foundational perspective on trends, aiding in fair pricing and negotiation.
Unlock Exceptional Service!
Assistance with all your real estate needs in the Dallas-Fort Worth area is just a click or call away. Reach out at 214-940-8149 or connect through the links below.
Oleg Sedletsky REALTOR® in Blue Ridge, Texas. Call/Text 214.940.8149
Greetings! I’m Oleg Sedletsky, and I’m excited to introduce myself as your go-to full-time licensed Texas REALTOR® and Mortgage Loan Originator.
I proudly represent JPAR® – Real Estate Brokerage as a REALTOR® and Utopia Mortgage LLC as a Mortgage Loan Originator! My designations and certifications reflect my dedication to helping you achieve your real estate goals in Blue Ridge, TX and other locations in the vibrant Dallas-Fort Worth area!
My commitment to ongoing professional development means I’m always enhancing my skills to serve you better. You can count on me as your trusted expert throughout your real estate journey. Plus, I’m fluent in English, Ukrainian, and Russian and ready to assist you every step of the way!
It’s All About You and Your Real Estate Dreams!
My mission is to serve you! With my knowledge and expertise, I’m here to help you achieve all your real estate goals and turn your dreams into reality!
I’m passionate about helping buyers and sellers navigate the exciting real estate landscape in Blue Ridge, Texas! Whether you’re searching for your dream home, exploring land options, or looking for commercial properties, my Real Estate Services have you covered.
Contact me today for all your real estate needs in Blue Ridge, Texas! Call/text 214-940-8149
Discover Yearly Real Estate Market Trends for Blue Ridge, TX
2003-2010
Blue Ridge, TX Real Estate Market in 2003
Blue Ridge, TX Real Estate Market in 2004
Blue Ridge, TX Real Estate Market in 2005
Blue Ridge, TX Real Estate Market in 2006
Blue Ridge, TX Real Estate Market in 2007
Blue Ridge, TX Real Estate Market in 2008
2011-2020
Blue Ridge, TX Real Estate Market in 2011
Blue Ridge, TX Real Estate Market in 2012
Blue Ridge, TX Real Estate Market in 2013
Blue Ridge, TX Real Estate Market in 2014
Blue Ridge, TX Real Estate Market in 2015
Blue Ridge, TX Real Estate Market in 2016
Blue Ridge, TX Real Estate Market in 2017
Blue Ridge, TX Real Estate Market in 2018
This market analysis is intended solely for educational purposes. This market analysis is based on data sourced from NTREIS, Inc. This analysis is exclusively focused on single-family homes and does not account for other property types. The total number of real estate transactions within the specified period and location may vary. Data accuracy cannot be guaranteed due to potential input errors made by NTREIS users. This market analysis does not account for all new construction home sales. If you need detailed information about recorded property sales or other public records, please contact the appropriate city or county office.
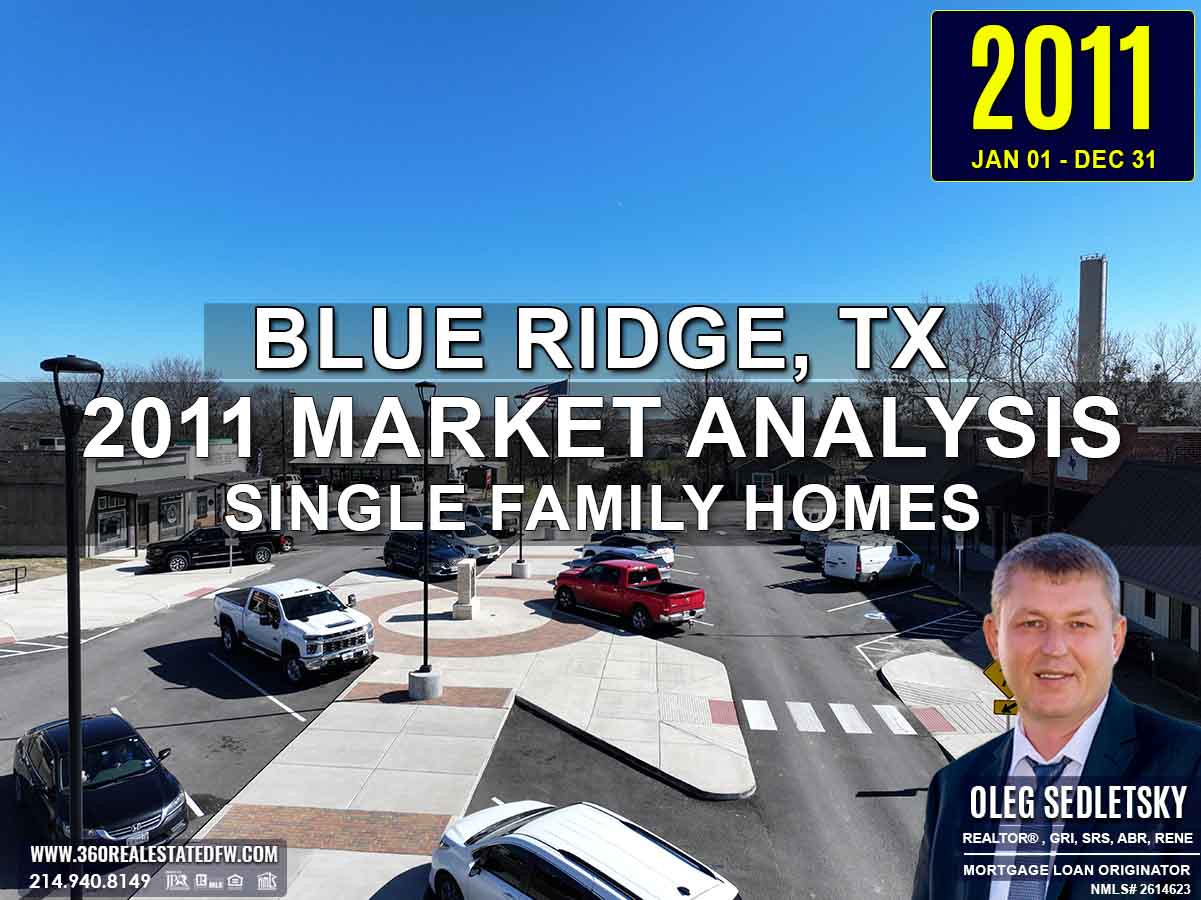
Blue Ridge, TX Real Estate: 2011 Analysis of the Single-Family Residential Housing Market
The 2011 real estate market in Blue Ridge, TX showed significant changes, characterized by increased pricing, quicker sales, and an emphasis on mid-sized and larger properties. With 14 closed transactions, this year reflected a drop in sales volume but demonstrated healthier valuations and improved market dynamics. Buyers and sellers adjusted to the evolving trends, navigating an efficient market with a more balanced pricing strategy.
Key Takeaways and Trends from Blue Ridge’s 2011 Real Estate Market
Pricing Range: The market refined its focus, with the minimum price increasing significantly to $26,000 while the maximum price adjusted slightly to $300,000. The rise in both median and average prices reflected improving evaluations and higher mid-market engagement.
Market Efficiency: The faster minimum DOM of 2 days and reduced maximum DOM showcased a more vibrant and competitive marketplace. Sellers saw improved buyer demand, especially for well-priced homes, and managed minor improvements in sale-to-list price ratios.
Unique Outliers: The availability of larger lot sizes, reaching a maximum of 40.808 acres, gave buyers new opportunities to access expansive outdoor spaces. However, smaller luxury homes dominated the high end, with maximum square footage reduced from 4,179 sq. ft. in the previous year to 2,862 sq. ft., aligning more with buyer preferences for value-based family homes.
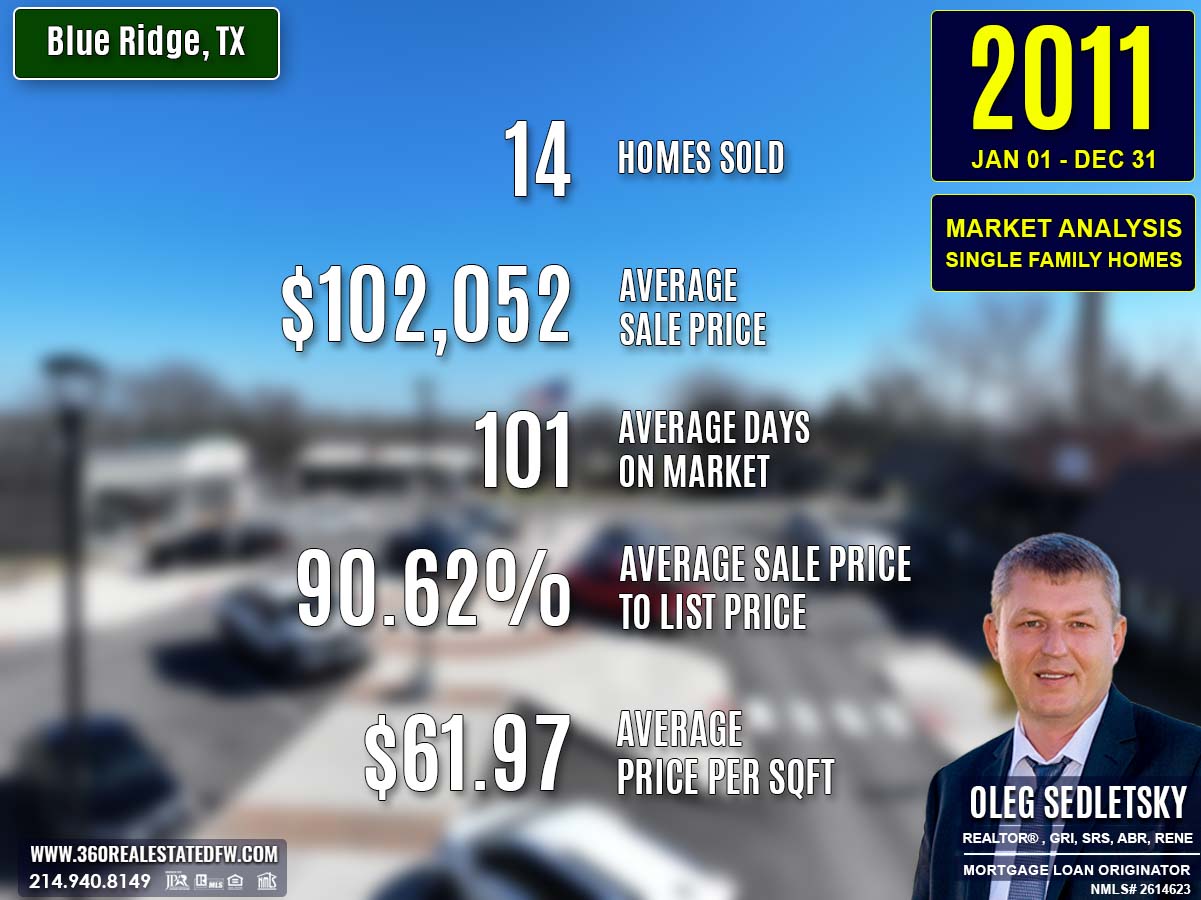
Total Homes Closed
2011 saw 14 homes closed, a reduction from the 18 transactions in 2010. While the volume dipped, the market became more efficient, reflecting heightened competition for desirable properties.
Property Pricing Insights
The pricing dynamics in 2011 highlighted recovery in property values alongside affordability:
- Minimum Price: $26,000 (a significant increase from $5,100 in 2010, removing ultra-low-budget homes).
- Maximum Price: $300,000 (slightly below 2010’s high of $322,000, showing a more focused demand in the luxury segment).
- Average Price: $102,052 (up from $94,495, signaling a healthier market).
- Median Price: $78,650 (an improvement from $72,500, showcasing steady mid-market growth).
The rise in average and median prices indicates a re-calibrated market favoring balanced pricing over extreme affordability or luxury.
Property Size and Features
The 2011 market offered a more diverse range of property sizes and features with an emphasis on practicality and larger lot sizes:
- Bedrooms: Properties had 2 to 4 bedrooms, maintaining an average of 3 bedrooms.
- Bathrooms: Homes came with 1 to 3 bathrooms, maintaining an average of 2 bathrooms to suit families.
- Square Footage:
- Minimum Size: 866 sq. ft. (up from 744 sq. ft., offering more functional entry-level properties).
- Maximum Size: 2,862 sq. ft. (a reduction from the larger homes of 2010, which maxed out at 4,179 sq. ft.).
- Average Size: 1,749 sq. ft., showing growth from 2010’s average size of 1,610 sq. ft., and catering to buyers seeking more spacious homes.
- Median Size: 1,720 sq. ft., a step up from last year’s 1,420 sq. ft.
The market reflected a balance between mid-sized affordability and larger properties for families needing additional space.
Market Dynamics
2011 was a year of significant improvement in market efficiency and pricing consistency, as reflected in metrics like DOM and valuation trends:
- Days on Market (DOM):
- Minimum DOM: 2 days (a dramatic improvement from 6 days in 2010).
- Maximum DOM: 282 days (a sharp drop from 495 days, revealing quicker sales even at the higher end).
- Average DOM: Decreased to 101 days (from 135 days), showcasing a faster average market turnover.
- ClsPr/LstPr Ratio: Improved to 90.62%, suggesting stable seller-to-buyer pricing negotiations.
- ClsPr/OLP Ratio: Enjoyed a slight uptick to 84.81%, reflecting a reduction in listing price reductions.
- Price Per SqFt (Pr$/SqFt): Increased to $61.97, emphasizing healthier valuations and buyer interest in homes with better amenities.
The improved metrics underscored a more balanced and responsive market, with sellers achieving quicker deals and buyers finding quality homes across price ranges.
Insights into the Most Expensive Blue Ridge, TX Property Sold in 2011
The standout luxurious property of 2011 resumed the market’s refined appeal for high-quality spaces. Selling for $300,000, this charming home highlighted expansive living and modern amenities.
Key metrics include:
- Price: $300,000
- Square footage: 2,372 sq. ft.
- Price per sq. ft.: $126.48
- Bedrooms: 4
- Bathrooms: 3 full baths
- Lot size: 37.180 acres
- Days on Market (DOM): 147 days
- ClsPr/LstPr and ClsPr/OLP: 92.31%
- Year Built: 1972
This property’s combination of acreage, spacious layout, and modern features added to its high-end appeal, drawing buyer interest in a relatively short sales timeline.
Economic context
The economic environment in Blue Ridge, TX during 2011 exhibited notable shifts that influenced the local real estate market.
Average Electricity Costs in Dallas-Fort Worth in 2011
The average electricity price for 2011 decreased to $0.11 per kilowatt hour, offering homeowners reduced utility costs. This drop encouraged buyers to optimize living expenses and invest in energy-efficient properties.
Texas Average Gas Prices in 2011
Gas prices climbed considerably to $3.37 per gallon. This rise impacted commuter costs, incentivizing buyers to explore suburban or efficient locations closer to work to cut travel-related expenses.
Average 30-Year Fixed Mortgage Rate in 2011
The average fixed mortgage rate dropped slightly to 4.65%, creating low borrowing costs and making homeownership attractive to new buyers. This decline in rates allowed potential buyers to lock in favorable monthly payments, making even larger or upgraded homes more accessible. For first-time home-buyers and investors alike, 2011 presented a unique opportunity to capitalize on low borrowing costs and secure long-term savings. Taking the first step toward homeownership by locking in mortgage rates was crucial
Curious about today’s mortgage rates and the home you can comfortably afford?
Submit a no-obligation mortgage application today and get pre-approved to determine your budget and take the first step toward homeownership with confidence.

Summary of Differences Between 2010 and 2011 Real Estate Data for Blue Ridge, TX
The 2011 real estate market in Blue Ridge, TX evolved significantly compared to 2010, reflecting healthier property valuations and faster sales cycles despite some contrasting dynamics.
Property Pricing Insights
- Minimum Current Price: Increased from $5,100 in 2010 to $26,000 in 2011, removing ultra-low-cost options from the market.
- Maximum Current Price: Slightly decreased from $322,000 to $300,000, signaling a tapering in luxury demand.
- Average Price: Rose from $94,495 to $102,052, marking improved property valuations.
- Median Price: Increased from $72,500 to $78,650, showcasing steady growth in mid-market pricing.
Property Features
-
Bedrooms:
- Minimum Bedrooms: Increased from 1 in 2010 to 2 in 2011, addressing the demand for larger homes.
- Maximum Bedrooms: Held steady at 4 bedrooms, providing balance for family buyers.
-
Bathrooms: The maximum number of bathrooms dropped from 5 in 2010 to 3 in 2011, reflecting fewer high-end properties.
-
Square Footage:
- Minimum Size: Increased from 744 sq. ft. in 2010 to 866 sq. ft. in 2011, indicating fewer compact entries into the market.
- Maximum Size: Dropped from 4,179 sq. ft. to 2,862 sq. ft., signaling reduced luxury inventory.
- Average Size: Rose from 1,610 sq. ft. to 1,749 sq. ft., reflecting an overall uptick in home size.
- Median Size: Increased from 1,420 sq. ft. to 1,720 sq. ft., solidifying the preference for mid-sized homes.
Lot Size Area
- Minimum Lot Size: Increased from 0.180 acres in 2010 to 0.254 acres in 2011, ensuring slightly larger yard areas for buyers.
- Maximum Lot Size: Spiked from 7.776 acres to an impressive 40.808 acres, demonstrating greater availability of expansive lots.
- Average Lot Size: Jumped from 1.961 acres to 9.087 acres, reinforcing the appeal of properties with more land.
Market Dynamics
-
Days on Market (DOM):
- Minimum DOM: Improved from 6 days in 2010 to an exceptionally fast 2 days in 2011, signaling heightened demand for desirable listings.
- Maximum DOM: Decreased notably from 495 days to 282 days, reflecting greater market efficiency.
- Average DOM: Declined from 135 days to 101 days, indicating quicker turnover on average.
-
ClsPr/LstPr (Close Price to List Price Ratio): Slightly improved from 90.49% in 2010 to 90.62%, reflecting stable negotiation margins for sellers.
-
ClsPr/OLP (Close Price to Original Listing Price Ratio): Improved marginally from 84.59% to 84.81%, highlighting reduced price reductions to close deals.
-
Price Per SqFt (Pr$/SqFt): Increased from $54.58 to $61.97, representing better property valuations per square foot.
Year Built
- Oldest Property: Expanded inventory diversity, with the oldest property dating back to 1910 in 2011 compared to 1953 in 2010.
- Newest Property: Held steady with the most recent homes built in 2005 in both years.
- Average Year Built: Declined from 1988 in 2010 to 1976 in 2011, indicating a tilt toward selling older homes.
- Median Year Built: Dropped from 1987 to 1981, continuing the trend of older inventory dominating sales.
Key Observations
- More Efficient Market: Faster sales and reduced maximum DOM indicate better alignment between buyer demand and available inventory.
- Improved Prices: Growth in average property size, median pricing, and price per square foot represent healthier valuations.
- Varied Lot Sizes: The wide range in lot sizes brought diversity, offering buyers options for larger plots.
- Older Homes Dominate: A shift toward older properties reflects changing buyer priorities, possibly to capitalize on affordable renovation opportunities.
The 2011 market showcased modest improvements in value and efficiency, signaling cautious optimism amidst ongoing economic adjustments.
Summary of Real Estate Market Analysis for Blue Ridge, TX in 2011
The 2011 real estate market in Blue Ridge, TX showed marked improvements in valuations, sales dynamics, and inventory diversity. While the total number of transactions dropped compared to 2010, the market demonstrated increased efficiency with faster sales and solid pricing trends.
Home-Buyers benefited from moderately priced homes and expanded options for spacious lots while facing higher commuting costs due to rising gas prices. Home-Sellers experienced stronger closing ratios with less need for significant price reductions. The year highlighted a balanced housing market, appealing to both value-driven and quality-seeking buyers. These trends signaled cautious optimism and laid a solid foundation for ongoing recovery and growth in Blue Ridge’s real estate sector.
Why Statistics Data is Important
Understanding past market data is essential for making informed decisions in today’s real estate landscape. Historical statistics provide a foundational perspective on trends, aiding in fair pricing and negotiation.
Unlock Exceptional Service!
Assistance with all your real estate needs in the Dallas-Fort Worth area is just a click or call away. Reach out at 214-940-8149 or connect through the links below.
Oleg Sedletsky REALTOR® in Blue Ridge, Texas. Call/Text 214.940.8149
Greetings! I’m Oleg Sedletsky, and I’m excited to introduce myself as your go-to full-time licensed Texas REALTOR® and Mortgage Loan Originator.
I proudly represent JPAR® – Real Estate Brokerage as a REALTOR® and Utopia Mortgage LLC as a Mortgage Loan Originator! My designations and certifications reflect my dedication to helping you achieve your real estate goals in Blue Ridge, TX and other locations in the vibrant Dallas-Fort Worth area!
My commitment to ongoing professional development means I’m always enhancing my skills to serve you better. You can count on me as your trusted expert throughout your real estate journey. Plus, I’m fluent in English, Ukrainian, and Russian and ready to assist you every step of the way!
It’s All About You and Your Real Estate Dreams!
My mission is to serve you! With my knowledge and expertise, I’m here to help you achieve all your real estate goals and turn your dreams into reality!
I’m passionate about helping buyers and sellers navigate the exciting real estate landscape in Blue Ridge, Texas! Whether you’re searching for your dream home, exploring land options, or looking for commercial properties, my Real Estate Services have you covered.
Contact me today for all your real estate needs in Blue Ridge, Texas! Call/text 214-940-8149
Discover Yearly Real Estate Market Trends for Blue Ridge, TX
2003-2010
Blue Ridge, TX Real Estate Market in 2003
Blue Ridge, TX Real Estate Market in 2004
Blue Ridge, TX Real Estate Market in 2005
Blue Ridge, TX Real Estate Market in 2006
Blue Ridge, TX Real Estate Market in 2007
Blue Ridge, TX Real Estate Market in 2008
2011-2020
Blue Ridge, TX Real Estate Market in 2011
Blue Ridge, TX Real Estate Market in 2012
Blue Ridge, TX Real Estate Market in 2013
Blue Ridge, TX Real Estate Market in 2014
Blue Ridge, TX Real Estate Market in 2015
Blue Ridge, TX Real Estate Market in 2016
Blue Ridge, TX Real Estate Market in 2017
Blue Ridge, TX Real Estate Market in 2018
This market analysis is intended solely for educational purposes. This market analysis is based on data sourced from NTREIS, Inc. This analysis is exclusively focused on single-family homes and does not account for other property types. The total number of real estate transactions within the specified period and location may vary. Data accuracy cannot be guaranteed due to potential input errors made by NTREIS users. This market analysis does not account for all new construction home sales. If you need detailed information about recorded property sales or other public records, please contact the appropriate city or county office.