
Princeton, TX Real Estate: A Comprehensive Analysis of the 2012 Single-Family Residential Housing Market
2012 real estate market in Princeton, Texas saw a rebound in activity after 2011. This analysis encompasses the sale of 152 residential single-family homes, providing insights on pricing trends, market efficiency, and property features. A standout feature was an increase in pool homes and a stable demand for new construction properties.
Key Takeaways and Trends from Princeton’s 2012 Real Estate Market
- Pricing Range:
Property values ranged from $21,000 to $399,000, with a higher average ($123,624) and median price ($122,500) than the previous year. - Market Efficiency:
Faster sales (69 days on average) and improved close-to-list ratios signified healthier market activity. - Unique Outliers:
The most expensive property sold was notable for its high acreage and extensive square footage, though its DOM indicated a longer transaction time. - Mortgage Rates Impact:
A decrease in the average 30-year fixed mortgage rate (to 3.88%) likely incentivized buyers and spurred the increase in sales volume and activity.
Total Homes Closed
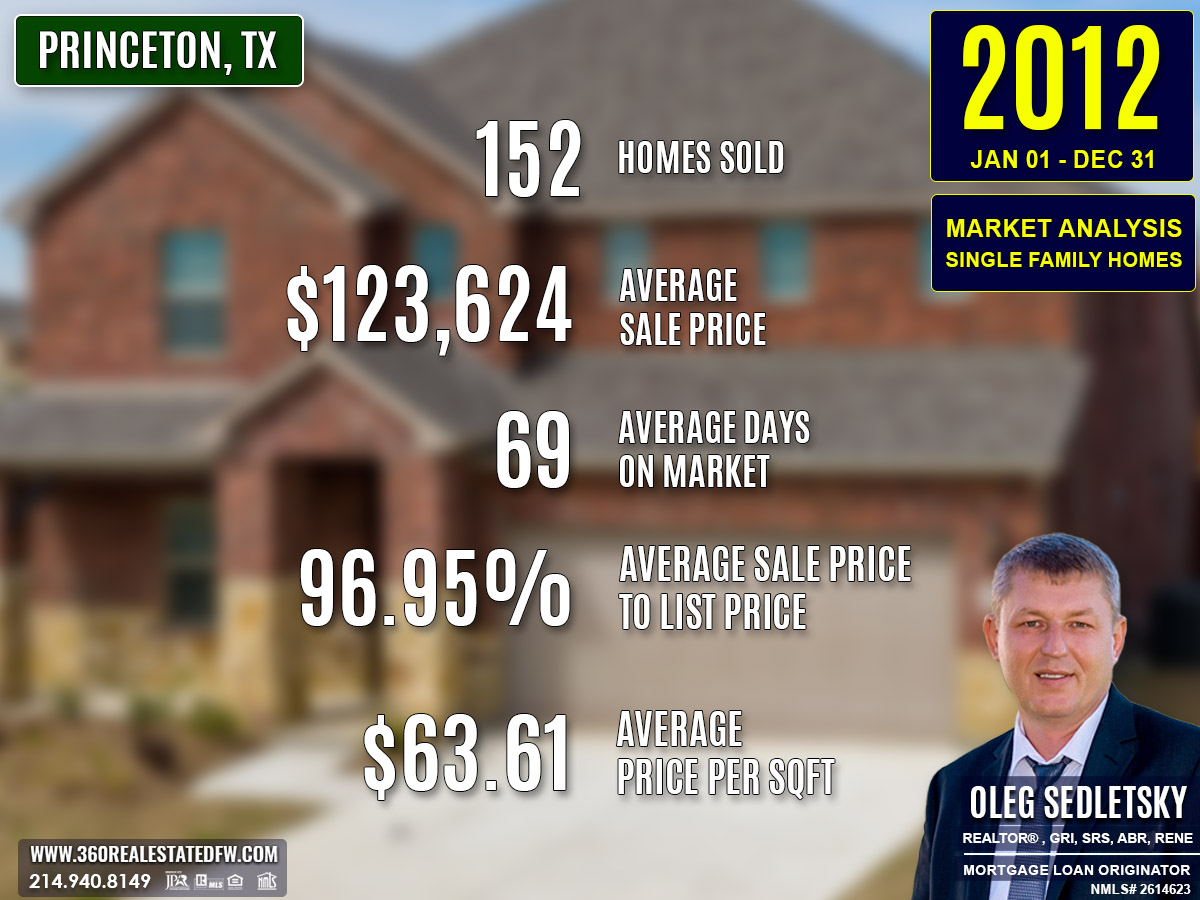
- Total homes closed: 152 homes sold in 2012, an increase from the 139 homes sold in 2011.
- New construction homes: 32 new builds, a slight decrease from 34 in the previous year.
- Homes with pools: 7 pool homes sold, reflecting a significant increase compared to just 1 in 2011.
Property Pricing Insights
Property prices in Bobak saw growth in 2012:
- Minimum price: $21,000 (an increase compared to 2011’s minimum of $13,000).
- Maximum price: $399,000 (lower than the previous year’s $550,000).
- Average price: $123,624, marking a rise from 2011’s $106,426.
- Median price: $122,500, noticeably higher than the $108,000 recorded in the prior year.
This upward pricing movement reflects improved market demand and buyer activity.
Property Size and Features
Princeton’s homes in 2012 exhibited diverse features catering to various demographics:
- Bedrooms: Averages stayed steady at 3, with homes ranging from 1 to 6 bedrooms.
- Bathrooms: Properties had an average of 2 full bathrooms, with a range from 1 to 5 bathrooms.
- Square footage: Residences spanned from 768 sqft to 4,118 sqft, with an average size of 1,958 sqft, slightly larger than 2011.
- Lot size: Properties had an average lot size of 0.887 acres, exceeding the 2011 average of 0.748 acres and ranging up to 16.257 acres.
Market Dynamics
Key metrics shaping Princeton’s market dynamics in 2012 include:
- Days on Market (DOM): Homes averaged 69 days on market, demonstrating faster sales compared to 2011’s 90 days.
- ClsPr/LstPr Ratio: Average close-to-list price ratio was 96.95%, reflecting improved seller confidence.
- ClsPr/OLP Ratio: Original listing price ratio climbed to 92.33%, signifying fewer price reductions during sales.
- Average price per sqft: Increased slightly to $63.61, up from $56.40 in 2011.
These figures indicate stronger buyer activity and heightened competitiveness in the market.
Insights into the Most Expensive Princeton, TX Property Sold in 2012
The most notable sale of the year was a luxury property purchased for $399,000. The expansive home combined modern features and spacious living, making it a desirable listing.
Key Metrics:
- Price: $399,000
- Beds/Baths: 4 bedrooms, 5 bathrooms
- Square Footage: 3,460 sqft
- Price per sqft: $115.32
- Lot Size: 16.257 acres
- Days on Market (DOM): 216 days
- ClsPr/LstPr Ratio: 93.88%
- ClsPr/OLP Ratio: 79.80%
- Year Built: 1996
Despite taking 216 days to sell, this property’s unique features justified its price point and listing duration.
Economic context
Average Electricity Costs in Dallas-Fort Worth in 2012
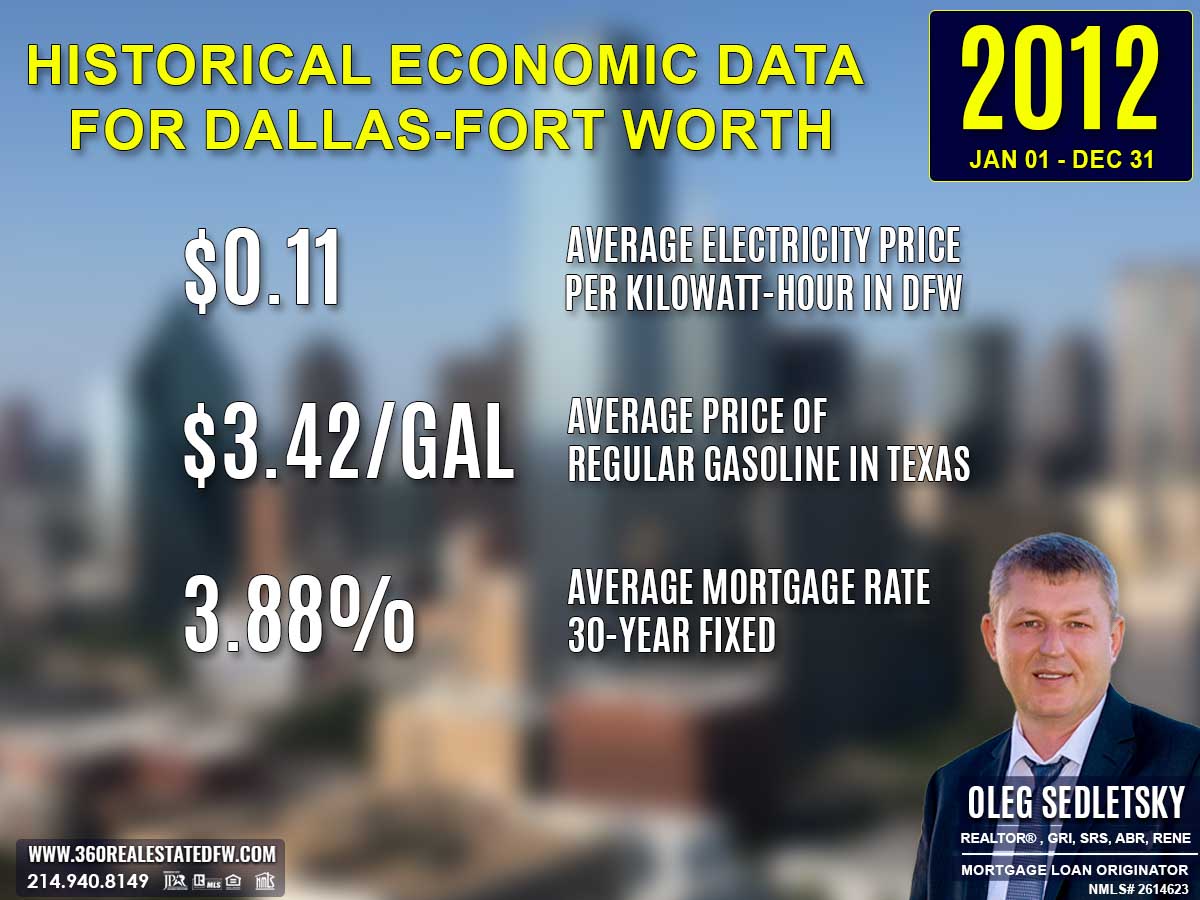
Electricity prices remained steady at $0.11 per kilowatt-hour in 2012, unchanged from 2011. This stability helped maintain predictability in household budgets, supporting steady investment in real estate. homebuyers could better evaluate prospective homes based on fixed utility costs, encouraging confident decision-making.
Average Price for Regular Gasoline in Texas in 2012
Gas prices rose slightly to $3.42 per gallon in 2012, up from $3.37 in 2011. homebuyers continued to prioritize location and proximity to public transit or work, as elevated gas prices increased commuting expenses. Properties in walkable neighborhoods likely gained more attention during this period.
Average 30-Year Fixed Mortgage Rate in 2012
Mortgage rates dropped significantly to 3.88% in 2012, down from 4.65% the previous year. This marked a historic low that spurred homebuyer activity, particularly for those locking in long-term affordability. Pre-approvals through local mortgage loan originators became an invaluable step in maximizing homebuyer advantages amidst this rate decline.
Curious about today’s mortgage rates and the home you can comfortably afford?
Submit a no-obligation mortgage application today and get pre-approved to determine your budget and take the first step toward homeownership with confidence.
Overview of Differences Between the 2011 and 2012 Real Estate Markets in Princeton, Texas
Volume of Sales
Home sales increased from 139 homes in 2011 to 152 homes in 2012, indicating an 8.5% rise in market activity.
Pricing
- Minimum price rose from $13,000 in 2011 to $21,000 in 2012, reflecting stronger entry-level activity.
- Maximum price fell from $550,000 to $399,000, showing less demand for high-end homes.
- Average price increased from $106,426 in 2011 to $123,624 in 2012, a 16% growth.
- Median price grew from $108,000 to $122,500, signaling rising typical property values.
Market Efficiency
- Days on Market (DOM) dropped from 90 days in 2011 to 69 days in 2012, suggesting faster sales.
- ClsPr/LstPr ratio improved slightly, from 95.84% to 96.95%, indicating better seller-to-buyer agreement on pricing.
- ClsPr/OLP ratio showed improvement, climbing from 89.99% to 92.33%, reflecting reduced listing price reductions.
Property Features
- Average square footage increased from 1,846 sqft in 2011 to 1,958 sqft in 2012, meeting higher space demands.
- Lot size grew slightly, from an average of 0.748 acres to 0.887 acres, offering larger properties overall.
- Homes with pools rose significantly, from just 1 in 2011 to 7 in 2012, suggesting greater appeal for luxury amenities.
- New construction homes declined slightly, from 34 in 2011 to 32 in 2012, showing a minimal slowdown in that segment.
Economic Context
Average 30-year fixed mortgage rates fell from 4.65% in 2011 to 3.88% in 2012, increasing affordability and incentivizing buyer participation. However, average gas prices rose from $3.37 to $3.42 per gallon, potentially tightening budgets elsewhere.
This comparison highlights significant growth in 2012, with more sales, higher pricing, faster market activity, and increased buyer demand for larger and pool-equipped homes. Economic shifts like lower mortgage rates likely fueled these positive trends.
Summary of Real Estate Market Analysis for Princeton, TX in 2012
The 2012 Princeton, TX real estate market revealed foundations of recovery and growth, with pricing stability and increased activity indicating buyer optimism. Inventory reflected a mix of modern builds and spacious homes, meeting varied demands. Faster turnover and stronger price negotiations underscored market confidence. If these trends hold, 2013 could continue this positive trajectory.
The Importance of Statistical Data in Princeton, Texas Real Estate Market
Did you know that appraisers and Realtors rely on historical statistical data to determine a property’s current value?
Analyzing historical market data is essential for making informed decisions in today’s real estate market. Examining past trends provides valuable insights that facilitate accurate pricing, more strategic negotiations, and a comprehensive understanding of market dynamics. By understanding market dynamics, both homebuyers and home-sellers can leverage the conditions to achieve their goals.
Unlock Exceptional Service!
Assistance with all your real estate needs in the Dallas-Fort Worth area is just a click or call away. Reach out at 214-940-8149 or connect through the links below.

Greetings! I’m Oleg Sedletsky, and I’m excited to introduce myself as your go-to full-time licensed Texas REALTOR® and Mortgage Loan Originator.
I proudly represent JPAR® – Real Estate Brokerage as a REALTOR® and Utopia Mortgage LLC as a Mortgage Loan Originator! My designations and certifications reflect my dedication to helping you achieve your real estate goals in Princeton, TX and other locations in the vibrant Dallas-Fort Worth area!
My commitment to ongoing professional development means I’m always enhancing my skills to serve you better. You can count on me as your trusted expert throughout your real estate journey. Plus, I’m fluent in English, Ukrainian, and Russian and ready to assist you every step of the way!

It’s All About You and Your Real Estate Goals!
My mission is to serve you! With my knowledge and expertise, I’m here to help you achieve all your real estate goals!
I’m passionate about helping buyers and sellers navigate the exciting real estate landscape in Princeton, Texas! Whether you’re searching for your dream home, exploring land options, or looking for commercial properties, my Real Estate Services have you covered.
Contact me today for all your real estate needs in Princeton, Texas! Call/text 214-940-8149
A Comprehensive Analysis of Single-Family Residential Housing Market in Princeton, TX: 2010 to Present
Discover the trends, stats, and insights shaping Princeton’s real estate market year by year!
2010-2020
Princeton, TX Real Estate Market Report 2010: Analysis and Trends
Princeton, TX Real Estate Market Report 2011: Analysis and Trends
Princeton, TX Real Estate Market Report 2012: Analysis and Trends
Princeton, TX Real Estate Market Report 2013: Analysis and Trends
Princeton, TX Real Estate Market Report 2014: Analysis and Trends
Princeton, TX Real Estate Market Report 2015: Analysis and Trends
Princeton, TX Real Estate Market Report 2016: Analysis and Trends
Princeton, TX Real Estate Market Report 2017: Analysis and Trends
Princeton, TX Real Estate Market Report 2018: Analysis and Trends
Princeton, TX Real Estate Market Report 2019: Analysis and Trends
Princeton, TX Real Estate Market Report 2020: Analysis and Trends
This market analysis is intended solely for educational purposes. This market analysis is based on data sourced from NTREIS, Inc. This analysis is exclusively focused on single-family homes and does not account for other property types. The total number of real estate transactions within the specified period and location may vary. Data accuracy cannot be guaranteed due to potential input errors made by NTREIS users. This market analysis does not account for all new construction home sales. If you need detailed information about recorded property sales or other public records, please contact the appropriate city or county office.
Princeton, TX Real Estate: A Comprehensive Analysis of the 2011 Single-Family Residential Housing Market
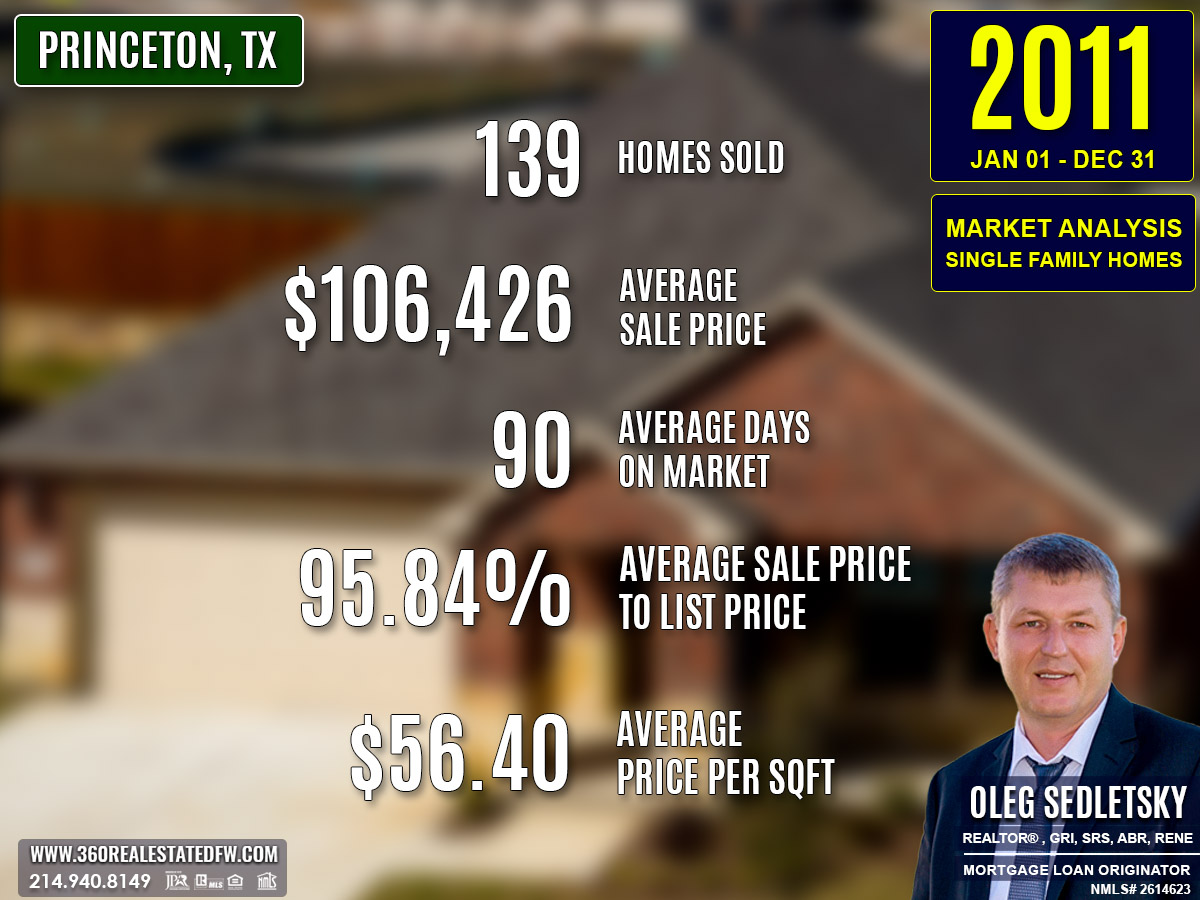
The Princeton, Texas real estate market in 2011 experienced notable changes compared to the previous year. This analysis explores 139 closed single-family home sales, providing insights into pricing, property sizes, market efficiency, and standout trends. I’ll further highlight the most expensive property sold and analyze the differences from the 2010 market.
Key Takeaways and Trends from Princeton’s 2011 Real Estate Market
Pricing Range: The range expanded slightly, from $13,000 to $550,000, with median and average prices dipping, reflecting more mid-market transactions.
Market Efficiency: With higher DOM and lower close-to-list ratios than 2010, the 2011 market experienced lengthier and possibly more competitive negotiations.
Unique Outliers: Luxurious homes, such as the 13-bedroom property, were sharp contrasts to more common mid-range housing options.
Mortgage Rates Impact: A slightly lower average mortgage rate of 4.65% (vs. 4.86% in 2010) should have incentivized more buyers; however, other economic factors, like increased average gas prices, may have tempered this boost.
Total Homes Closed
- Total homes closed in 2011 were 139, showcasing slightly lower activity compared to the 176 homes sold in 2010.
- New construction homes: 34 sales highlight a modest decrease in new builds compared to the prior year.
- Homes with pools: Only 1 sale involved a home with a pool, indicating a decline from 7 such properties in 2010.
Property Pricing Insights
The pricing landscape in 2011 revealed a wide range:
- Minimum price: $13,000 — an increase compared to 2010.
- Maximum price: $550,000 — slightly higher than the previous year.
- Average price: $106,426 — reflecting a modest decrease from 2010’s $115,316.
- Median price: $108,000 — slightly lower than last year’s $116,950.
This suggests a slight softening in home prices, with both middle and top-tier pricing showing minor shifts.
Property Size and Features
The range and average for property sizes and features show consistency:
- Bedrooms: Homes had an average of 3 bedrooms, ranging from 2 to 13 bedrooms.
- Bathrooms: The average was 2 full bathrooms, with homes providing a range of 1 to 6 bathrooms.
- Square footage: Properties ranged from 875 sqft to a substantial 6,735 sqft, averaging 1,846 sqft, showing minor growth from 2010.
- Lot Size: The average lot size was 0.748 acres, slightly smaller than last year, with lots extending up to 23.26 acres.
Variation in home size and lot area catered to diverse buyer preferences.
Market Dynamics
Key metrics illustrating market efficiency include:
- Days on Market (DOM): Homes averaged 90 days on market, a noticeable increase from the 74-day average in 2010.
- ClsPr/LstPr Ratio: On average, homes sold at 95.84% of their listing price, slightly dipping from the previous year.
- ClsPr/OLP Ratio: The ratio to the original listing price was 89.99%, indicating more significant price adjustments compared to 2010.
- Price per square foot: Averaged $56.40, reflecting a decline from the $63.87 in 2010.
These figures suggest a slightly less competitive market, with slower sales and lower pricing per square foot.
Insights into the Most Expensive Princeton, TX Property Sold in 2011
The pinnacle of 2011’s market activity was a luxury property that sold for $550,000. This home, featuring remarkable size and features, marked the highest sale of the year.
Key Metrics:
- Price: $550,000
- Beds/Baths: 13 bedrooms, 6 bathrooms (all full baths)
- Square Footage: 6,735 sqft
- Price per sqft: $81.66
- Lot Size: 12.00 acres
- Days on Market (DOM): 199 days
- ClsPr/LstPr Ratio: 100.00%
- ClsPr/OLP Ratio: 100.00%
- Year Built: 1999
Its significant size, competitive pricing, and full asking price sale make it a true outlier in the market.
Economic context

Average Electricity Costs in Dallas-Fort Worth in 2011
Electricity prices dipped again to $0.11 per kilowatt-hour in 2011, down from $0.12 in 2010. This slight drop continued to help households manage their budgets with more flexibility for discretionary spending or home-related investments. The lower cost of utilities could boost the appeal of larger homes that might otherwise consume more electricity.
Average Price for Regular Gasoline in Texas in 2011
Gas prices rose noticeably to $3.37 per gallon in 2011, up from $2.64 in 2010. The steep increase likely caused homebuyers to favor properties closer to work or transit hubs. homebuyers in suburban or rural areas likely faced greater challenges due to higher commuting costs.
Average 30-Year Fixed Mortgage Rate in 2011
Mortgage rates dropped further to 4.65% in 2011 from 4.86% in the prior year. This ongoing trend of declining rates supported affordability and encouraged activity among homebuyers. First-time buyers were reminded to get pre-approved through local mortgage loan originators to better understand their purchasing power.
Curious about today’s mortgage rates and the home you can comfortably afford?
Submit a no-obligation mortgage application today and get pre-approved to determine your budget and take the first step toward homeownership with confidence.
Overview of Differences Between the 2010 and 2011 Real Estate Markets in Princeton, Texas
Volume of Sales
2010 saw 176 homes sold, while 2011 recorded a lower total of 139 homes, reflecting a decline in market activity.
Pricing
- Minimum price rose from $12,900 in 2010 to $13,000 in 2011, showing a slight increase.
- Maximum price increased modestly from $515,000 to $550,000, highlighting continuing interest in high-end properties.
- Average price decreased from $115,316 to $106,426, suggesting a softening market.
- Median price fell from $116,950 to $108,000, further indicating a decline in typical home values.
Market Efficiency
- Days on Market (DOM) stretched from an average of 74 days in 2010 to 90 days in 2011, signaling slower sales.
- The ClsPr/LstPr ratio dipped from 97.28% to 95.84%, showing buyers negotiated slightly deeper discounts off the listing price.
- ClsPr/OLP fell from 93.31% to 89.99%, reflecting more significant price adjustments from original listings.
Property Features
- Average square footage remained similar, increasing slightly from 1,816 sqft to 1,846 sqft, while lot size decreased from an average of 0.863 acres to 0.748 acres.
- Homes with pools dropped steeply from 7 in 2010 to only 1 in 2011, indicating reduced luxury demand.
- New construction sales fell from 54 to 34, showing slower activity in this segment.
Economic Context
Mortgage rates dropped from 4.86% in 2010 to 4.65% in 2011, making borrowing slightly more affordable. Despite this, the market saw reduced activity and pricing shifts, possibly due to broader economic influences like higher gas prices (rising from $2.64 to $3.37 per gallon).
This comparison highlights a cooling market in 2011, with fewer transactions, lower average pricing, and slower sales, though high-end properties and value adjustments exhibited unique trends.
Summary of Real Estate Market Analysis for Princeton, TX in 2011
The 2011 real estate market in Princeton, Texas reflected a year of subtle shifts and adjustments, signaling a period of stabilization rather than rapid growth. With a decline in sales volume from 176 homes in 2010 to 139 in 2011, homebuyer activity visibly slowed down. Home values softened slightly, with the average price dropping to $106,426, while the median price settled at $108,000. Despite these decreases, the market continued to showcase diversity, offering options ranging from affordable starter homes priced as low as $13,000 to high-end properties reaching $550,000.
The Importance of Statistical Data in Princeton, Texas Real Estate Market
Did you know that appraisers and Realtors rely on historical statistical data to determine a property’s current value?
Analyzing historical market data is essential for making informed decisions in today’s real estate market. Examining past trends provides valuable insights that facilitate accurate pricing, more strategic negotiations, and a comprehensive understanding of market dynamics. By understanding market dynamics, both homebuyers and home-sellers can leverage the conditions to achieve their goals.
Unlock Exceptional Service!
Assistance with all your real estate needs in the Dallas-Fort Worth area is just a click or call away. Reach out at 214-940-8149 or connect through the links below.
Greetings! I’m Oleg Sedletsky, and I’m excited to introduce myself as your go-to full-time licensed Texas REALTOR® and Mortgage Loan Originator.
I proudly represent JPAR® – Real Estate Brokerage as a REALTOR® and Utopia Mortgage LLC as a Mortgage Loan Originator! My designations and certifications reflect my dedication to helping you achieve your real estate goals in Princeton, TX and other locations in the vibrant Dallas-Fort Worth area!
My commitment to ongoing professional development means I’m always enhancing my skills to serve you better. You can count on me as your trusted expert throughout your real estate journey. Plus, I’m fluent in English, Ukrainian, and Russian and ready to assist you every step of the way!
It’s All About You and Your Real Estate Goals!
My mission is to serve you! With my knowledge and expertise, I’m here to help you achieve all your real estate goals!
I’m passionate about helping buyers and sellers navigate the exciting real estate landscape in Princeton, Texas! Whether you’re searching for your dream home, exploring land options, or looking for commercial properties, my Real Estate Services have you covered.
Contact me today for all your real estate needs in Princeton, Texas! Call/text 214-940-8149
A Comprehensive Analysis of Single-Family Residential Housing Market in Princeton, TX: 2010 to Present
Discover the trends, stats, and insights shaping Princeton’s real estate market year by year!
2010-2020
Princeton, TX Real Estate Market Report 2010: Analysis and Trends
Princeton, TX Real Estate Market Report 2011: Analysis and Trends
Princeton, TX Real Estate Market Report 2012: Analysis and Trends
Princeton, TX Real Estate Market Report 2013: Analysis and Trends
Princeton, TX Real Estate Market Report 2014: Analysis and Trends
Princeton, TX Real Estate Market Report 2015: Analysis and Trends
Princeton, TX Real Estate Market Report 2016: Analysis and Trends
Princeton, TX Real Estate Market Report 2017: Analysis and Trends
Princeton, TX Real Estate Market Report 2018: Analysis and Trends
Princeton, TX Real Estate Market Report 2019: Analysis and Trends
Princeton, TX Real Estate Market Report 2020: Analysis and Trends
This market analysis is intended solely for educational purposes. This market analysis is based on data sourced from NTREIS, Inc. This analysis is exclusively focused on single-family homes and does not account for other property types. The total number of real estate transactions within the specified period and location may vary. Data accuracy cannot be guaranteed due to potential input errors made by NTREIS users. This market analysis does not account for all new construction home sales. If you need detailed information about recorded property sales or other public records, please contact the appropriate city or county office.
Princeton, TX Real Estate: A Comprehensive Analysis of the 2010 Single-Family Residential Housing Market
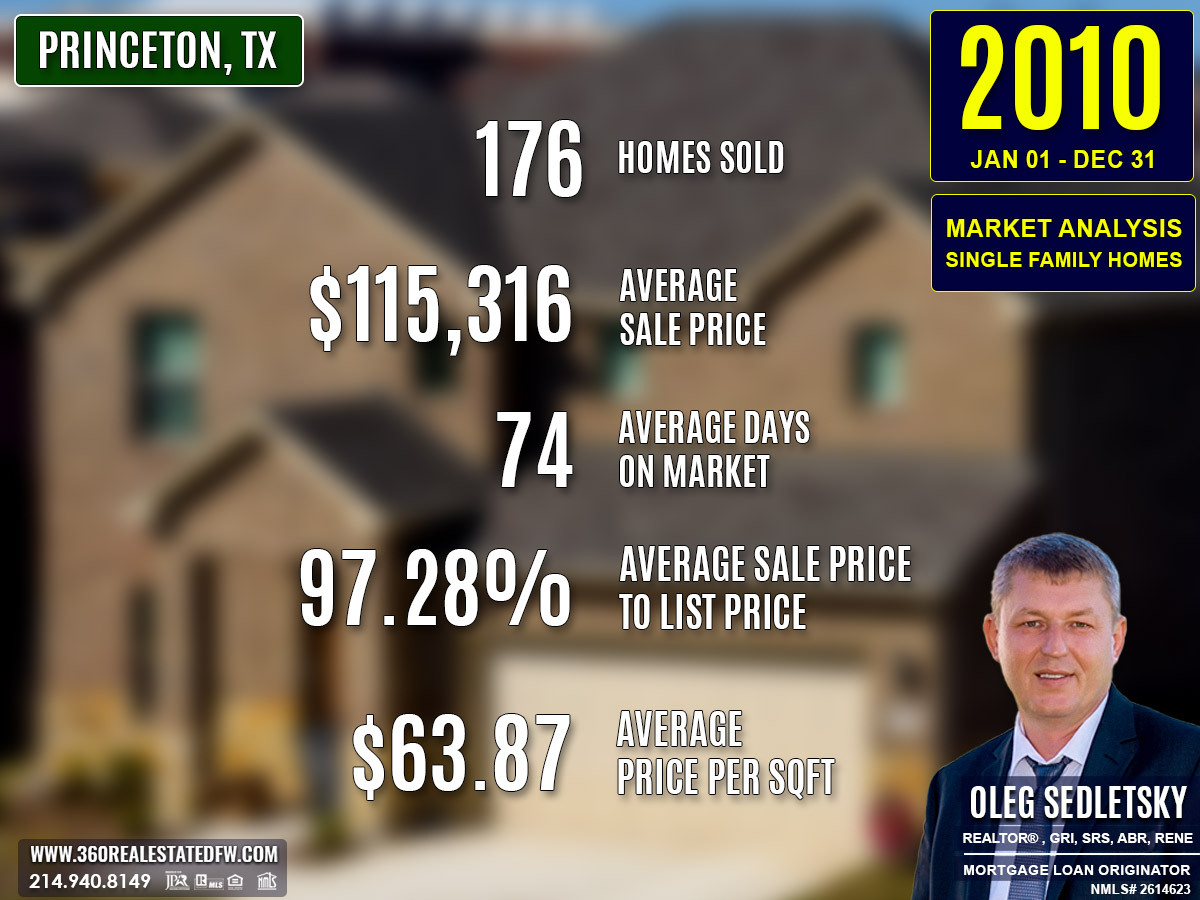
The real estate market in Princeton, Texas in 2010 witnessed diverse activity in the single-family residential sector. This analysis explores 176 closed home sales during the year, unveiling key metrics like pricing, home features, market efficiency, and trends. Additionally, I’ll highlight the most expensive property sold and examine the market dynamics contributing to the year’s performance.
Key Takeaways and Trends from Princeton’s 2010 Real Estate Market
Pricing Range: Prices ranged from $12,900 to $515,000, with an average of $115,316, making this market attractive to buyers of various economic profiles.
Market Efficiency: With an average DOM of 74 days and a ClsPr/LstPr of 97.28%, the market operated efficiently. Sellers achieved near-listing prices while keeping turnover time reasonable.
Unique Outliers: High-end properties, like the most expensive one sold, stand out as luxurious outliers with larger acreage, more amenities, and significantly adjusted closing prices.
Mortgage Rates Impact: The average 30-year fixed mortgage rate of 4.86% likely encouraged homebuyers to enter the market, making borrowing relatively affordable compared to historical highs.
Total Homes Closed
- Total homes closed: 176
- Homes with pools: 7
- New construction homes accounted for 54 sales, showcasing significant activity in that segment.
Property Pricing Insights
Here’s a breakdown of property pricing for 2010:
- Minimum price: $12,900
- Maximum price: $515,000
- Average price: $115,316
- Median price: $116,950
Homes in Princeton, TX provided a highly accessible range, catering to budget-friendly buyers and upscale purchasers alike.
Property Size and Features
- Bedrooms: Most homes had 3 bedrooms (average), ranging from 2 to 6 bedrooms.
- Bathrooms: Average of 2 full baths, with a range from 1 to 4 bathrooms.
- Square footage: Ranged from 768 sqft to 4,084 sqft, with an average of 1,816 sqft.
- Lot Size: Average lot size was 0.863 acres, spanning from compact lots to as large as 30.22 acres.
This diversity in size and features indicates flexibility in home options catering to varied buyer needs.
Market Dynamics
- Days on Market (DOM): The average time on the market was 74 days, with some homes selling as quickly as within 54 days and others taking up to 499 days.
- ClsPr/LstPr Ratio: On average, homes sold at 97.28% of their listing price.
- ClsPr/OLP Ratio: The ratio to the original listing price averaged 93.31%, highlighting minor adjustments in pricing during the selling process.
- Price per square foot: The average was $63.87 per sqft, with pricing reaching a high of $235.73 per sqft.
This reflects a fairly efficient market, with competitive pricing and manageable selling times.
Insights into the Most Expensive Princeton, TX Property Sold in 2010
The standout home of the year sold for $515,000. This premium property set benchmarks in terms of luxury and scale.
Key Metrics:
- Price: $515,000
- Beds/Baths: 4 beds, 4 baths (3 full, 1 half)
- Square Footage: 4,084 sqft
- Price per sqft: $126.10
- Lot Size: 30.22 acres
- Days on Market (DOM): 136 days
- ClsPr/LstPr Ratio: 74.10%
- ClsPr/OLP Ratio: 57.54%
- Year Built: 1996
Its sprawling acreage and generous size maintain its prestige as an outlier in the local market.
Economic context

Average Electricity Costs in Dallas-Fort Worth in 2010
Electricity costs decreased further to $0.12 per kilowatt-hour in 2010, down from $0.13 in 2009. The drop allowed households to manage monthly budgets a bit more effectively. For real estate, affordability in utility costs could make energy-conscious homes an easier sell, particularly as homebuyers explored long-term cost savings.
Average Price for Regular Gasoline in Texas in 2010
Gasoline prices rebounded slightly, averaging $2.64 per gallon in 2010, compared to $2.21 in 2009. The rise in fuel costs likely pushed many homebuyers to evaluate commute expenses alongside their home budgets. Urban areas and transit-centered communities may have seen increased interest as reliable transport options became a key factor.
Average 30-Year Fixed Mortgage Rate in 2010
Mortgage rates declined further to 4.86% in 2010, offering favorable conditions for potential homebuyers. This drop made monthly payments more manageable and contributed to a gradual recovery in the housing market. Pre-approvals with local mortgage loan originators were essential for homebuyers to confidently pursue homes in competitive markets.
Curious about today’s mortgage rates and the home you can comfortably afford?
Submit a no-obligation mortgage application today and get pre-approved to determine your budget and take the first step toward homeownership with confidence.
Summary of Real Estate Market Analysis for Princeton, TX in 2010
The 2010 Princeton, Texas real estate market offered affordability, diversity, and steady performance. Competitive pricing, solid demand for new construction homes, and a manageable average DOM reflected a balanced environment for both homebuyers and home-sellers.
The Importance of Statistical Data in Princeton, Texas Real Estate Market
Did you know that appraisers and Realtors rely on historical statistical data to determine a property’s current value?
Analyzing historical market data is essential for making informed decisions in today’s real estate market. Examining past trends provides valuable insights that facilitate accurate pricing, more strategic negotiations, and a comprehensive understanding of market dynamics. By understanding market dynamics, both homebuyers and home-sellers can leverage the conditions to achieve their goals.
Unlock Exceptional Service!
Assistance with all your real estate needs in the Dallas-Fort Worth area is just a click or call away. Reach out at 214-940-8149 or connect through the links below.
Greetings! I’m Oleg Sedletsky, and I’m excited to introduce myself as your go-to full-time licensed Texas REALTOR® and Mortgage Loan Originator.
I proudly represent JPAR® – Real Estate Brokerage as a REALTOR® and Utopia Mortgage LLC as a Mortgage Loan Originator! My designations and certifications reflect my dedication to helping you achieve your real estate goals in Princeton, TX and other locations in the vibrant Dallas-Fort Worth area!
My commitment to ongoing professional development means I’m always enhancing my skills to serve you better. You can count on me as your trusted expert throughout your real estate journey. Plus, I’m fluent in English, Ukrainian, and Russian and ready to assist you every step of the way!
It’s All About You and Your Real Estate Goals!
My mission is to serve you! With my knowledge and expertise, I’m here to help you achieve all your real estate goals!
I’m passionate about helping buyers and sellers navigate the exciting real estate landscape in Princeton, Texas! Whether you’re searching for your dream home, exploring land options, or looking for commercial properties, my Real Estate Services have you covered.
Contact me today for all your real estate needs in Princeton, Texas! Call/text 214-940-8149
A Comprehensive Analysis of Single-Family Residential Housing Market in Princeton, TX: 2010 to Present
Discover the trends, stats, and insights shaping Princeton’s real estate market year by year!
2010-2020
Princeton, TX Real Estate Market Report 2010: Analysis and Trends
Princeton, TX Real Estate Market Report 2011: Analysis and Trends
Princeton, TX Real Estate Market Report 2012: Analysis and Trends
Princeton, TX Real Estate Market Report 2013: Analysis and Trends
Princeton, TX Real Estate Market Report 2014: Analysis and Trends
Princeton, TX Real Estate Market Report 2015: Analysis and Trends
Princeton, TX Real Estate Market Report 2016: Analysis and Trends
Princeton, TX Real Estate Market Report 2017: Analysis and Trends
Princeton, TX Real Estate Market Report 2018: Analysis and Trends
Princeton, TX Real Estate Market Report 2019: Analysis and Trends
Princeton, TX Real Estate Market Report 2020: Analysis and Trends
This market analysis is intended solely for educational purposes. This market analysis is based on data sourced from NTREIS, Inc. This analysis is exclusively focused on single-family homes and does not account for other property types. The total number of real estate transactions within the specified period and location may vary. Data accuracy cannot be guaranteed due to potential input errors made by NTREIS users. This market analysis does not account for all new construction home sales. If you need detailed information about recorded property sales or other public records, please contact the appropriate city or county office.

Lucas, TX Real Estate: A Comprehensive Analysis of the 2024 Single-Family Residential Housing Market
The real estate market in Lucas, Texas remained active in 2024, showing notable increases in transaction volume and consistency in pricing.
With sustained median values and rising transaction volumes, it showcased the strengths of its property diversity and range of amenities. HomeBuyers’ selective focus on premium features and pricing management by home-sellers created a market poised for balanced growth, even in challenging economic conditions.
Key Takeaways and Trends from Lucas’s 2024 Real Estate Market
1. Pricing Range:
- Prices spanned from $390,000 to $3,851,000, offering options for both entry-level and affluent buyers.
- The average price of $1,103,542 and median of $950,000 reflected strong mid-market activity.
2. Market Efficiency:
- Longer average DOM (57 days) highlighted buyer deliberation amidst stable pricing trends.
- ClsPr/LstPr and ClsPr/OLP ratios indicated ongoing negotiation leverage for buyers, despite demand for premium features.
3. Unique Outliers:
- The year’s priciest sale of $3,851,000 showcases the demand for ultra-luxe properties with modern construction and pools.
- 42 new construction homes drove buyer interest toward energy efficiency and contemporary layouts, while pool homes (68 sold) remained a key lifestyle amenity.
4. Mortgage Rates Impact:
The declining average mortgage rate of 6.90% slightly improved buyer confidence compared to 2023, though buyer selectivity slowed transactions.

Total Homes Closed
With 148 homes sold, transactions marked an improvement from the previous year. The market saw strong interest in high-quality homes, with 42 new construction properties sold, highlighting a focus on modern, energy-efficient designs. Additionally, 68 pool-equipped homes catered to lifestyle-oriented buyers, reflecting demand for leisure-enhancing features.
Property Pricing Insights
Property prices in 2024 ranged widely, catering to various homebuyer demographics.
- Minimum Price: $390,000
- Maximum Price: $3,851,000
- Average Price: $1,103,542
- Median Price: $950,000
- Average Price per Square Foot: $276.08
These figures highlight a balanced market, with competitive pricing across mid-tier and luxury segments.
Property Size and Features
Lucas’s housing options spanned diverse needs, emphasizing flexibility and modern amenities.
- Bedrooms: Ranged from 2 to 7, with an average of 4 bedrooms.
- Bathrooms: Varied from 2 to 10, averaging 4 bathrooms.
- Square Footage: Homes ranged between 1,404 sq. ft. and 8,729 sq. ft., averaging 3,890 sq. ft.
- Lot Sizes: Spanned from 0.182 acres to 13.381 acres, with an average size of 1.49 acres.
Market Dynamics
While transaction volumes rose, market efficiency slightly declined, indicative of ongoing economic influences.
- Days on Market (DOM): Homes averaged 57 days on market, with a median of 43 days.
- ClsPr/LstPr Ratio (Close Price to Listing Price): Averaged 96.55%, pointing to reasonable negotiation margins for buyers.
- ClsPr/OLP Ratio (Close Price to Original Listing Price): Declined slightly to 93.65%, signaling moderate price corrections during the listing period.
- Average Price per Square Foot: Settled at $276.08, showing stable property value trends.
Insights into the Most Expensive Lucas, TX Property Sold in 2024
The top sale in 2024 emphasizes the market’s capacity for luxury offerings. This 7,760 sq. ft. new construction home with modern amenities and a pool exemplified top-tier design and was priced to match. Key metrics include:
- Price: $3,851,000
- Beds/Baths: 5 bedrooms, 8 bathrooms (5 full, 3 half)
- Square Footage: 7,760 sq. ft.
- Price per Square Foot: $496.26
- Lot Size: 2.05 acres
- Days on Market (DOM): 121 days
- ClsPr/LstPr Ratio: 99.00%
- ClsPr/OLP Ratio: 99.00%
- Year Built: 2024
This high-value property underscores ongoing demand for luxurious, well-constructed homes, even in extended sales periods.
Economic context
Average Electricity Costs in Dallas-Fort Worth in 2024
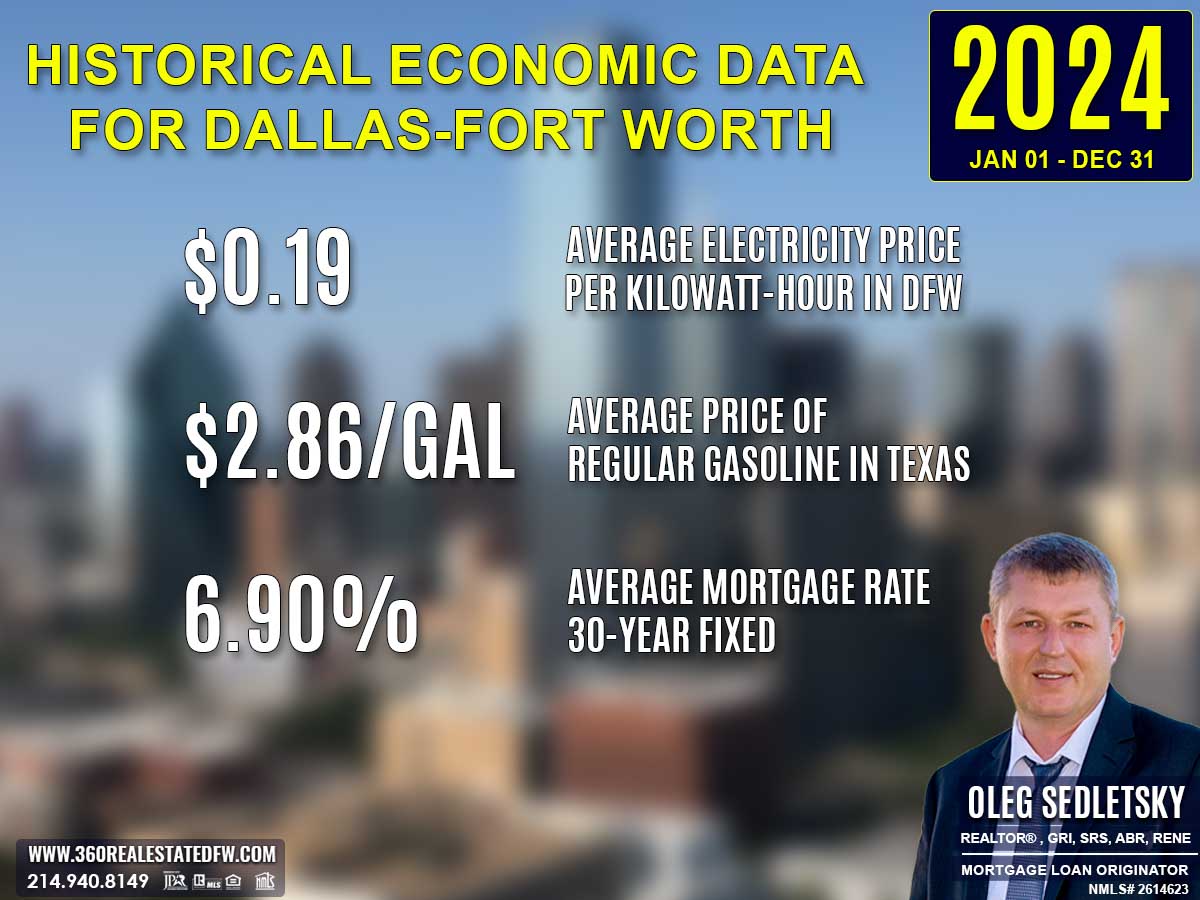
Electricity prices rose again to $0.19 per kilowatt-hour in 2024, up from $0.17 in 2023. The steady rise in energy costs underscored the growing value of homes equipped with renewable energy solutions. Energy-conscious designs likely remained a key factor in real estate market trends.
Average Price for Regular Gasoline in Texas in 2024
Gas prices settled slightly lower at $2.86 per gallon in 2024, down from $3.06 in 2023. This decrease, while modest, might have encouraged more exploratory behavior from buyers considering homes in more distant locations. The reduced cost of transportation relieved some financial stress for commuting.
Average 30-Year Fixed Mortgage Rate in 2024
The average 30-year fixed mortgage rate fell marginally to 6.90% in 2024, down from 7.00% in 2023. While still elevated, this slight decline could provide homebuyers with additional opportunities to re-enter the market. Pre-approvals with a local mortgage loan originator remained critical in helping buyers react quickly to evolving financial conditions and maintain a competitive edge.
Curious about today’s mortgage rates and the home you can comfortably afford?
Submit a no-obligation mortgage application today and get pre-approved to determine your budget and take the first step toward homeownership with confidence.
Overview of Differences Between the 2023 and 2024 Real Estate Markets in Lucas, Texas
Total Homes Sold
Transactions increased in 2024, with 148 homes sold, up from 132 in 2023, indicating an active market recovery.
Pricing Insights
- The minimum home price dropped to $390,000 in 2024, compared to $535,000 in 2023, expanding options for entry-level buyers.
- The maximum price increased to $3,851,000 in 2024, up from $3,402,800 in 2023, showcasing robust activity in the luxury segment.
- The average sale price fell slightly to $1,103,542 in 2024, from $1,169,366 in 2023, reflecting a broader market mix.
- The median price decreased to $950,000 in 2024, compared to $1,050,000 in 2023, signaling stronger mid-market transactions.
- The average price per square foot dropped slightly to $276.08 in 2024, from $293.66 in 2023, reflecting small shifts in value across property types.
Property Features
- Properties in 2024 offered 2 to 7 bedrooms, compared to 3 to 7 bedrooms in 2023, with the average remaining at 4 bedrooms.
- The range of bathrooms expanded to 2 to 10 in 2024, compared to 2 to 8 in 2023, while still averaging 4.
- Average square footage reduced slightly to 3,890 sq. ft. in 2024, down from 4,036 sq. ft. in 2023.
- Lot sizes shrank minimally, with an average of 1.49 acres in 2024, compared to 1.648 acres in 2023.
Market Dynamics
- Homes sold faster in 2024, with an average Days on Market (DOM) of 57 days, compared to 59 days in 2023, and a median DOM of 43 days, down from 38 days.
- The ClsPr/LstPr ratio declined slightly to 96.55% in 2024, compared to 97.25% in 2023, showing greater buyer leverage.
- The ClsPr/OLP ratio also dipped to 93.65% in 2024, from 94.55% in 2023, reflecting continued price corrections during sales.
Trends and Outliers
- The most expensive sale in 2024 was a 7,760 sq. ft. luxury home with a pool that sold for $3,851,000, compared to 2023’s $3.4M estate.
- New construction surged, with 42 homes sold in 2024, up from 33 in 2023, emphasizing demand for modern living.
- The popularity of homes with pools rose, with 68 pool-equipped properties sold in 2024, compared to 56 in 2023, underscoring lifestyle-centric buying preferences.
Key Takeaways
The 2024 market built on the gains of 2023 with increased transactions and expanded affordability options at the low end, while luxury sales continued to flourish. Selective pricing adjustments and a rise in new constructions further reflected dynamic buyer interest. Mid-tier and lifestyle-oriented features like pools remained consistent drivers of activity amidst evolving market conditions.
Summary of Real Estate Market Analysis for Lucas, TX in 2024
The 2024 real estate market in Lucas, Texas showcased a remarkable balance between adaptability and growth, navigating economic headwinds like mortgage rates averaging 6.90% and fluctuating living costs. The market achieved increased transactions while maintaining diverse property offerings, ranging from affordable homes to luxury estates. Sellers adeptly adjusted to buyer priorities, facilitating steady property values and competitive pricing.
The integration of modern, energy-efficient living through new construction homes and lifestyle-focused features like pools underscored the ability to meet evolving demands. Despite a mix of economic pressures, the market’s resilience and diversity reinforced its strength, setting the stage for continued success in future years.
The Importance of Statistical Data in Lucas, Texas Real Estate Market
Did you know that appraisers and Realtors rely on historical statistical data to determine a property’s current value?
Analyzing historical market data is essential for making informed decisions in today’s real estate market. Examining past trends provides valuable insights that facilitate accurate pricing, more strategic negotiations, and a comprehensive understanding of market dynamics.
Unlock Exceptional Service!
Assistance with all your real estate needs in the Dallas-Fort Worth area is just a click or call away. Reach out at 214-940-8149 or connect through the links below.

Greetings! I’m Oleg Sedletsky, and I’m excited to introduce myself as your go-to full-time licensed Texas REALTOR® and Mortgage Loan Originator.
I proudly represent JPAR® – Real Estate Brokerage as a REALTOR® and Utopia Mortgage LLC as a Mortgage Loan Originator! My designations and certifications reflect my dedication to helping you achieve your real estate goals in Lucas, TX and other locations in the vibrant Dallas-Fort Worth area!
My commitment to ongoing professional development means I’m always enhancing my skills to serve you better. You can count on me as your trusted expert throughout your real estate journey. Plus, I’m fluent in English, Ukrainian, and Russian and ready to assist you every step of the way!
It’s All About You and Your Real Estate Goals!
My mission is to serve you! With my knowledge and expertise, I’m here to help you achieve all your real estate goals!
I’m passionate about helping buyers and sellers navigate the exciting real estate landscape in Lucas, Texas! Whether you’re searching for your dream home, exploring land options, or looking for commercial properties, my Real Estate Services have you covered.
Contact me today for all your real estate needs in Lucas, Texas! Call/text 214-940-8149
A Comprehensive Analysis of Single-Family Residential Housing Market in Lucas, TX: 2003 to Present
2003-2010
Lucas, TX Real Estate Market Report 2003: Analysis and Trends
Lucas, TX Real Estate Market Report 2004: Analysis and Trends
Lucas, TX Real Estate Market Report 2005: Analysis and Trends
Lucas, TX Real Estate Market Report 2006: Analysis and Trends
Lucas, TX Real Estate Market Report 2007: Analysis and Trends
Lucas, TX Real Estate Market Report 2008: Analysis and Trends
Lucas, TX Real Estate Market Report 2009: Analysis and Trends
Lucas, TX Real Estate Market Report 2010: Analysis and Trends
2011-2020
Lucas, TX Real Estate Market Report 2011: Analysis and Trends
Lucas, TX Real Estate Market Report 2012: Analysis and Trends
Lucas, TX Real Estate Market Report 2013: Analysis and Trends
Lucas, TX Real Estate Market Report 2014: Analysis and Trends
Lucas, TX Real Estate Market Report 2015: Analysis and Trends
Lucas, TX Real Estate Market Report 2016: Analysis and Trends
Lucas, TX Real Estate Market Report 2017: Analysis and Trends
Lucas, TX Real Estate Market Report 2018: Analysis and Trends
Lucas, TX Real Estate Market Report 2019: Analysis and Trends
Lucas, TX Real Estate Market Report 2020: Analysis and Trends
This market analysis is intended solely for educational purposes. This market analysis is based on data sourced from NTREIS, Inc. This analysis is exclusively focused on single-family homes and does not account for other property types. The total number of real estate transactions within the specified period and location may vary. Data accuracy cannot be guaranteed due to potential input errors made by NTREIS users. This market analysis does not account for all new construction home sales. If you need detailed information about recorded property sales or other public records, please contact the appropriate city or county office.

Lucas, TX Real Estate: A Comprehensive Analysis of the 2023 Single-Family Residential Housing Market
The real estate market in Lucas, Texas during 2023 navigated a dynamic landscape shaped by economic challenges, including elevated mortgage rates averaging 7.00% and gas prices at $3.06 per gallon.
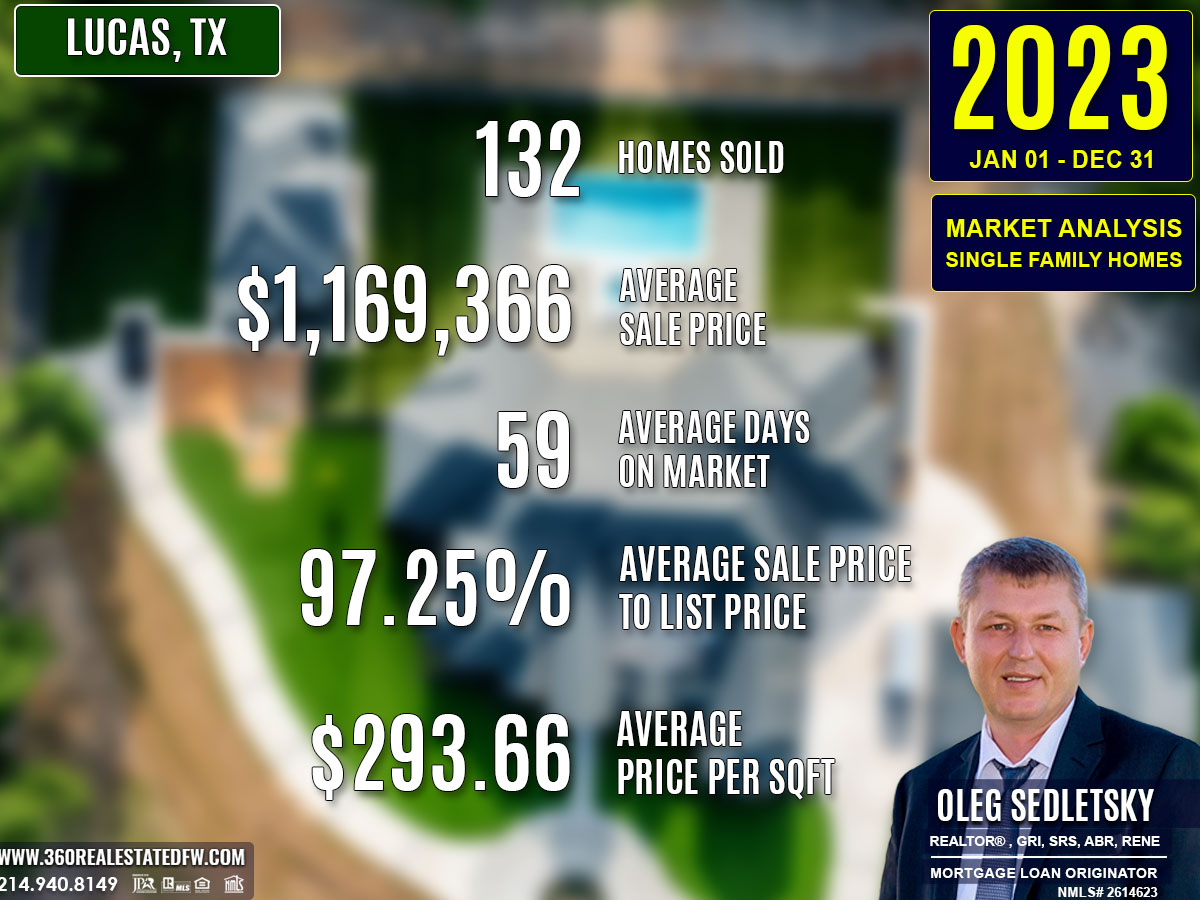
Despite these pressures, the market demonstrated resilience by closing 132 transactions, indicating a slight rebound from the prior year. HomeBuyers were drawn to modern features, while lifestyle-centric amenities like pools continued to capture interest. Home-Sellers adjusted expectations amidst longer sales cycles and increased emphasis on competitive pricing.
Key Takeaways and Trends from Lucas’s 2023 Real Estate Market
1. Pricing Range
- Property prices ranged between $535,000 and $3,402,800, offering options for both entry-level buyers and affluent investors.
- The average price of $1,169,366 and median price of $1,050,000 emphasized increased property value stability.
2. Market Efficiency
- Longer sales periods, with average DOM at 59 and median DOM at 38, indicated slower finalization of sales.
- Slightly reduced ClsPr/LstPr (97.25%) and ClsPr/OLP (94.55%) ratios pointed to an increase in buyer-driven price negotiations.
3. Unique Outliers
- The year’s top sale, a $3,402,800 luxury estate, exemplified the demand for ultra-modern, custom-crafted homes, incorporating notable features such as pools and vast spaces.
- New constructions (33 sold) further highlighted the continued appeal of energy-efficient, modern designs, while pool features (56 sold) confirmed enduring lifestyle-centric priorities.
4. Mortgage Rates Impact
The sharp rise in the 30-year fixed mortgage to 7.00% impacted affordability, resulting in longer sales cycles, moderate price adjustments, and a focus on core features like square footage or location.
Total Homes Closed
Lucas, TX recorded 132 residential single-family home sales, representing diverse offerings across mid-tier and luxury segments.
- 33 new construction homes sold, underscoring a strong interest in modern designs and energy-efficient properties.
- 56 homes with pools were sold, highlighting ongoing demand for leisure-enhancing amenities amidst lifestyle-focused purchasing trends.
Property Pricing Insights
HomeBuyers and home-sellers engaged across a wide price spectrum, reflecting market diversity.
- Minimum Home Price: $535,000
- Maximum Home Price: $3,402,800
- Average Home Price: $1,169,366
- Median Home Price: $1,050,000
- Average Price per Square Foot: $293.66
Property Size and Features
Lucas’s homes in 2023 catered to varying buyer needs, offering flexible sizes and upscale features.
Bedrooms: Ranged from 3 to 7, with a typical home featuring an average of 4 bedrooms.
Bathrooms: Varied from 2 to 8, with an average of 4 bathrooms.
Square Footage: Properties spanned from 1,404 sq. ft. to 8,095 sq. ft., with an average size of 4,036 sq. ft.
Lot Sizes: Ranged between 0.199 acres and 12.162 acres
Market Dynamics
The market in 2023 reflected stabilized demand but with longer sales cycles and greater price sensitivity.
- Days on Market (DOM): Homes spent an average of 59 days on market, reflecting a modest slowdown. The median DOM was 38 days, indicating a mix of quick and extended transactions.
- ClsPr/LstPr Ratio (Close Price to Listing Price): Averaged 97.25%, signaling moderate buyer negotiations.
- ClsPr/OLP Ratio (Close Price to Original Listing Price): Averaged 94.55%, highlighting an increase in price adjustments.
- Average Price per Square Foot: Prices reached $293.66, continuing to trend upward despite fewer ultra-high-end sales compared to prior years.
Insights into the Most Expensive Lucas, TX Property Sold in 2023
The most expensive property sold in Lucas, TX during 2023 was a 6-bedroom, 7-bathroom luxury estate, a brand-new construction with a pool custom-built by Homes By J Anthony. This 6,490 sq. ft. home set on 2.29 acres sold for $3,402,800, reflecting both high-end craftsmanship and prime desirability. Its rapid sale within 3 days and above-list price achievements showcased the strength of the luxury segment.
- Price: $3,402,800
- Beds/Baths: 6 bedrooms, 7 bathrooms (6 full, 1 half)
- Square Footage: 6,490 sq. ft.
- Price per Square Foot: $524.31
- Lot Size: 2.29 acres
- Days on Market (DOM): 3 days
- ClsPr/LstPr Ratio: 114.38%
- ClsPr/OLP Ratio: 114.38%
- Year Built: 2022
This design-forward estate exemplifies the strong demand for bespoke, high-value properties in Lucas’s 2023 market.
Economic context

Average Electricity Costs in Dallas-Fort Worth in 2023
Electricity prices dropped slightly to $0.17 per kilowatt-hour in 2023, compared to $0.18 in 2022. While this small decrease provided some relief, energy-efficient homes remained a top priority for homebuyers. Such features offered long-term cost savings that appealed to budget-conscious households.
Average Price for Regular Gasoline in Texas in 2023
Gas prices fell to $3.06 per gallon in 2023, down from $3.47 the previous year. This decline could have renewed interest in suburban properties by making commutes more affordable. homebuyers may have placed higher importance on access to amenities and infrastructure to balance the potential for rising future gas prices.
Average 30-Year Fixed Mortgage Rate in 2023
Mortgage rates increased to 7.00% in 2023, up sharply from 5.53% the prior year. This jump added significant pressure to affordability and homebuyers’ decision-making. Pre-approvals through local mortgage loan originators became essential in helping buyers secure competitive rates and stay within budget during challenging conditions.
Curious about today’s mortgage rates and the home you can comfortably afford?
Submit a no-obligation mortgage application today and get pre-approved to determine your budget and take the first step toward homeownership with confidence.
Overview of Differences Between the 2022 and 2023 Real Estate Markets in Lucas, Texas
Total Homes Sold
An increase in activity was observed with 132 homes sold in 2023, up from 124 in 2022, indicating a slight recovery despite ongoing economic challenges.
Pricing Insights
- The minimum home price rose to $535,000 in 2023, compared to $470,000 in 2022, setting a higher entry point for buyers.
- The maximum price decreased to $3,402,800 in 2023, down from $3,725,000 in 2022, reflecting fewer ultra-luxury transactions.
- The average sale price increased slightly to $1,169,366 in 2023, compared to $1,143,277 in 2022, showcasing steady appreciation.
- The median price jumped to $1,050,000 in 2023, up from $941,087 in 2022, emphasizing a shift toward higher mid-market pricing.
- The average price per square foot rose modestly to $293.66 in 2023, from $287.99 in 2022, maintaining growth in property values.
Property Features
Homes offered similar bedroom and bathroom ranges, from 3 to 7 bedrooms and 2 to 8 bathrooms in 2023, aligning closely with 2022.
The average square footage increased slightly to 4,036 sq. ft. in 2023, compared to 3,929 sq. ft. in 2022.
Lot sizes saw a slight decrease, with larger outliers recorded in 2022 at 13.3810 acres, compared to a maximum of 12.162 acres in 2023.
Market Dynamics
- Days on Market (DOM) expanded significantly, with homes averaging 59 days on market in 2023, up from 44 days in 2022.
- The ClsPr/LstPr ratio decreased to 97.25% in 2023, from 100.09% in 2022, reflecting increased buyer negotiations.
- The ClsPr/OLP ratio fell slightly to 94.55% in 2023, from 97.91% in 2022, showing more frequent price adjustments.
- Rising mortgage rates (7.00% in 2023 compared to 5.53% in 2022) slowed transactions and tempered market activity.
Trends and Outliers
- The most expensive property in 2023, a custom-built $3.4M estate with a pool, sold in just 3 days, demonstrating extreme demand for luxurious, move-in-ready homes. This contrasts with the longer sales timeline of the $3.7M estate in 2022.
- 33 new construction homes were sold in 2023, up from 25 in 2022, signaling heightened interest in modern and energy-efficient builds.
- The number of homes sold with pools dipped slightly to 56 in 2023, compared to 60 in 2022, while remaining a key driver of lifestyle purchasing trends.
Key Takeaway
The real estate market in 2023 displayed incremental recovery, with higher transaction volumes and steady price growth despite ongoing obstacles like rising mortgage rates. Affluent and mid-market homebuyers continued to shape the market, favoring new constructions, luxury amenities, and competitive pricing. These trends signaled a balanced yet evolving market positioned for future adaptability.
Summary of Real Estate Market Analysis for Lucas, TX in 2023
The 2022 real estate market in Lucas, TX demonstrated remarkable balance and resilience despite significant economic challenges, including sharp increases in mortgage rates reaching 7.00% and elevated living costs.
While these conditions tempered transaction speed and introduced heightened price negotiations, the market adapted by showcasing a diverse range of properties that matched evolving buyer priorities. The emphasis on modern construction, leisure features like pools, and high-end amenities reflected the ability to cater to both mid-market families and luxury investors.
Home-Sellers adjusted expectations to accommodate selective buyer behavior, while property values remained robust, with higher median and per square foot pricing. This adaptability and strategic diversity ensured Lucas’s housing market continued to thrive, paving the way for sustained growth in the face of challenges.
The Importance of Statistical Data in Lucas, Texas Real Estate Market
Did you know that appraisers and Realtors rely on historical statistical data to determine a property’s current value?
Analyzing historical market data is essential for making informed decisions in today’s real estate market. Examining past trends provides valuable insights that facilitate accurate pricing, more strategic negotiations, and a comprehensive understanding of market dynamics.
Unlock Exceptional Service!
Assistance with all your real estate needs in the Dallas-Fort Worth area is just a click or call away. Reach out at 214-940-8149 or connect through the links below.
Greetings! I’m Oleg Sedletsky, and I’m excited to introduce myself as your go-to full-time licensed Texas REALTOR® and Mortgage Loan Originator.
I proudly represent JPAR® – Real Estate Brokerage as a REALTOR® and Utopia Mortgage LLC as a Mortgage Loan Originator! My designations and certifications reflect my dedication to helping you achieve your real estate goals in Lucas, TX and other locations in the vibrant Dallas-Fort Worth area!
My commitment to ongoing professional development means I’m always enhancing my skills to serve you better. You can count on me as your trusted expert throughout your real estate journey. Plus, I’m fluent in English, Ukrainian, and Russian and ready to assist you every step of the way!
It’s All About You and Your Real Estate Goals!
My mission is to serve you! With my knowledge and expertise, I’m here to help you achieve all your real estate goals!
I’m passionate about helping buyers and sellers navigate the exciting real estate landscape in Lucas, Texas! Whether you’re searching for your dream home, exploring land options, or looking for commercial properties, my Real Estate Services have you covered.
Contact me today for all your real estate needs in Lucas, Texas! Call/text 214-940-8149
A Comprehensive Analysis of Single-Family Residential Housing Market in Lucas, TX: 2003 to Present
2003-2010
Lucas, TX Real Estate Market Report 2003: Analysis and Trends
Lucas, TX Real Estate Market Report 2004: Analysis and Trends
Lucas, TX Real Estate Market Report 2005: Analysis and Trends
Lucas, TX Real Estate Market Report 2006: Analysis and Trends
Lucas, TX Real Estate Market Report 2007: Analysis and Trends
Lucas, TX Real Estate Market Report 2008: Analysis and Trends
Lucas, TX Real Estate Market Report 2009: Analysis and Trends
Lucas, TX Real Estate Market Report 2010: Analysis and Trends
2011-2020
Lucas, TX Real Estate Market Report 2011: Analysis and Trends
Lucas, TX Real Estate Market Report 2012: Analysis and Trends
Lucas, TX Real Estate Market Report 2013: Analysis and Trends
Lucas, TX Real Estate Market Report 2014: Analysis and Trends
Lucas, TX Real Estate Market Report 2015: Analysis and Trends
Lucas, TX Real Estate Market Report 2016: Analysis and Trends
Lucas, TX Real Estate Market Report 2017: Analysis and Trends
Lucas, TX Real Estate Market Report 2018: Analysis and Trends
Lucas, TX Real Estate Market Report 2019: Analysis and Trends
Lucas, TX Real Estate Market Report 2020: Analysis and Trends
This market analysis is intended solely for educational purposes. This market analysis is based on data sourced from NTREIS, Inc. This analysis is exclusively focused on single-family homes and does not account for other property types. The total number of real estate transactions within the specified period and location may vary. Data accuracy cannot be guaranteed due to potential input errors made by NTREIS users. This market analysis does not account for all new construction home sales. If you need detailed information about recorded property sales or other public records, please contact the appropriate city or county office.

Lucas, TX Real Estate: A Comprehensive Analysis of the 2022 Single-Family Residential Housing Market
The real estate market in Lucas, Texas experienced notable shifts in dynamics throughout 2022.
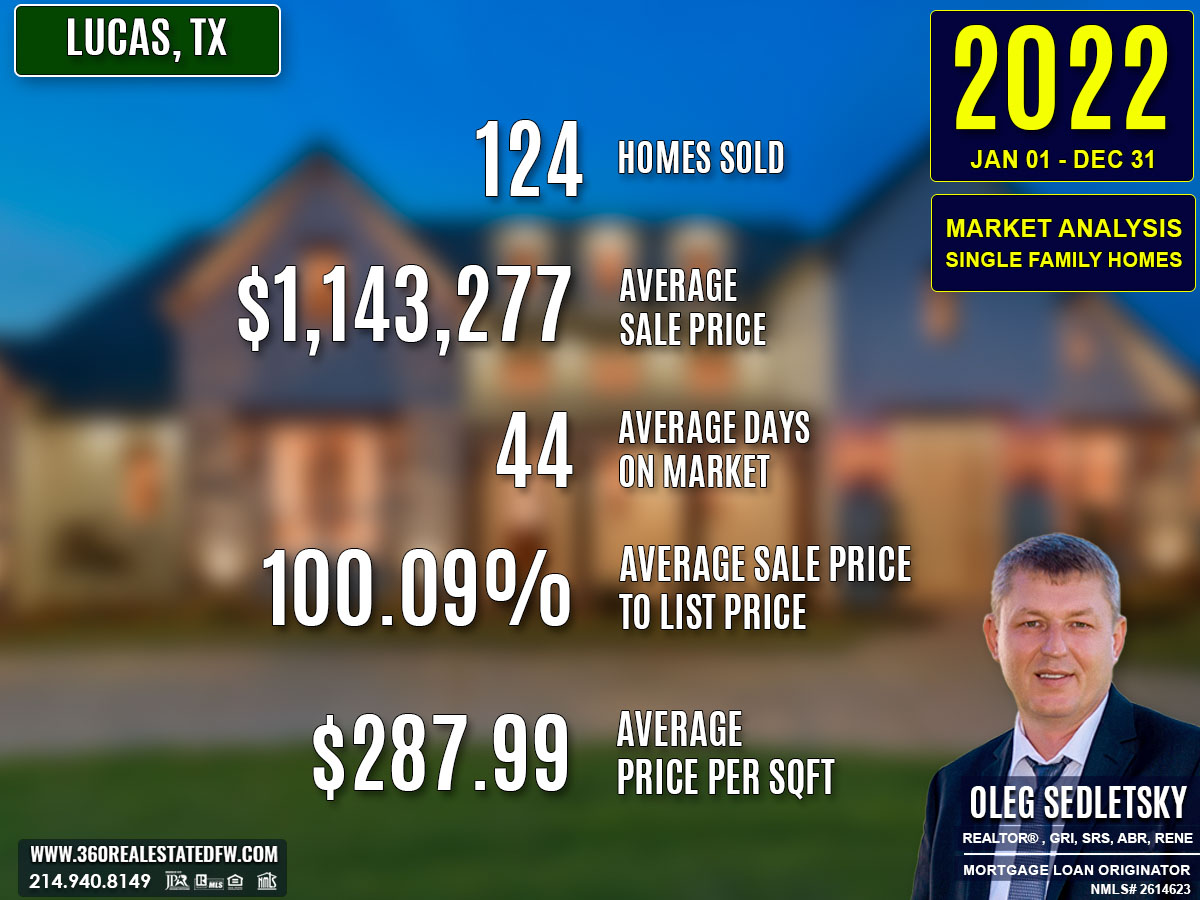
With rising mortgage rates averaging 5.53%, elevated gas prices of $3.47 per gallon, and higher electricity costs, buyer affordability faced growing pressures. Despite these economic conditions, the market showed resilience, recording 124 transactions and maintaining a diverse range of offerings. HomeBuyers continued to prioritize lifestyle-friendly features such as pools, while Home-Sellers benefitted from stable home values and competitive market activity.
Key Takeaways and Trends from Lucas’s 2022 Real Estate Market
1. Pricing Range
- Home prices ranged between $470,000 and $3,725,000, offering options for a variety of buyers.
- High-tier pricing reflected demand for exclusive properties despite economic headwinds, while the median price of $941,087 underscored sustained mid-market activity.
2. Market Efficiency
- The median DAYS on Market (DOM) of 17 days showcased robust but balanced liquidity, despite slightly slower sales compared to 2021.
- ClsPr/LstPr ratios holding at or just above 100% reflected a market still leaning toward sellers, albeit with occasional price negotiations.
3. Unique Outliers
- The most notable property sale, at $3,725,000, highlighted the growing diversity in Lucas’s market, complete with large luxury amenities that appealed to upscale buyers.
- 60 pool homes exemplified the continued emphasis on leisure and lifestyle, while the sale of 25 newly constructed homes pointed to ongoing interest in modern, energy-efficient builds.
4. Mortgage Rates Impact
- The rise in 30-year mortgage rates to 5.53% curbed buyer affordability, likely contributing to the decline in total transactions compared to 2021.
- Rising costs, in conjunction with elevated gas and electricity prices, challenged buyer spending power across most segments.
Total Homes Closed
Lucas, TX saw 124 homes sold in 2022, marking a slower pace compared to prior years.
- 25 new construction homes added fresh inventory, with modern design trends and energy-efficient features.
- 60 homes with pools reflected strong demand for leisure-focused properties, supporting the pandemic-era trend of lifestyle upgrades.
Property Pricing Insights
The real estate pricing ranged broadly, catering to both entry-level buyers and high-net-worth individuals.
- Minimum Home Price: $470,000
- Maximum Home Price: $3,725,000
- Average Home Price: $1,143,277
- Median Home Price: $941,087
- Average Price per Square Foot: $287.99
Property Size and Features
Lucas’s homes in 2022 showcased flexibility in size and accommodations to meet varying buyer needs.
- Bedrooms: Ranged from 3 to 8, with a typical home offering 4 bedrooms.
- Bathrooms: Varied between 2 and 8, averaging 4 bathrooms.
- Square Footage: Smaller homes started at 1,312 sq. ft., while luxury properties reached up to 7,596 sq. ft., with an average of 3,929 sq. ft.
- Lot Sizes: Ranged widely, from 0.41 acres to expansive lots as large as 13+ acres.
Market Dynamics
The market in 2022 reflected a steady pace of transactions, favoring sellers but with hints of buyer price sensitivity.
- Days on Market (DOM): Homes averaged 44 days on market, with a median DOM of 17 days, hinting at steady buyer interest.
- ClsPr/LstPr Ratio: Sellers achieved 100.09% of their listing prices, evidencing competitive negotiations.
- ClsPr/OLP Ratio: Averaged at 97.91%, indicating occasional price adjustments during listing periods.
- Average Price per Square Foot: Increased to $287.99, showing a continued upward trend in property values.
Insights into the Most Expensive Lucas, TX Property Sold in 2022
The standout transaction in 2022 was a $3,725,000 luxury estate, representing the pinnacle of Lucas’s real estate market. This impressive 5-bedroom, 7-bathroom home offered privacy, modern luxury, and ample space for entertaining. Key metrics are outlined below:
- Price: $3,725,000
- Beds/Baths: 5 bedrooms, 7 bathrooms (5 full, 2 half)
- Square Footage: 7,596 sq. ft.
- Price per Square Foot: $490.39
- Lot Size: 2.17 acres
- Days on Market (DOM): 50 days
- ClsPr/LstPr Ratio: 87.65%
- ClsPr/OLP Ratio: 78.42%
- Year Built: 2016
Despite its prestige, the property sold below the original list price, highlighting price sensitivity, even in the luxury market.
Economic context

Average Electricity Costs in Dallas-Fort Worth in 2022
Average electricity prices spiked to $0.18 per kilowatt-hour in 2022, a sharp increase from $0.14 in 2021. Higher energy expenses placed added strain on household budgets, driving demand for energy savings. Homes with modern insulation, solar installations, or energy-saving appliances gained significant appeal during this period.
Average Price for Regular Gasoline in Texas in 2022
Gas prices surged to $3.47 per gallon in 2022, jumping from $2.65 in 2021. The substantial increase in transportation costs likely swayed homebuyers to favor central locations or areas close to public transit. Long commutes to suburban or rural homes might have lost some appeal in light of elevated gas prices.
Average 30-Year Fixed Mortgage Rate in 2022
Mortgage rates climbed steeply to 5.53% in 2022, up from 3.15% the year before. The notable rise in rates significantly impacted affordability, persuading many to reassess their homeownership goals. Homebuyers were urged to secure pre-approval with a local mortgage loan originator to better understand their financial limits in a tightened market.
Curious about today’s mortgage rates and the home you can comfortably afford?
Submit a no-obligation mortgage application today and get pre-approved to determine your budget and take the first step toward homeownership with confidence.
Overview of Differences Between the 2021 and 2022 Real Estate Markets in Lucas, Texas
Total Homes Sold
A significant decline in transactions occurred, with 124 homes sold in 2022 compared to 179 in 2021, highlighting a slowdown in buying activity.
Pricing Insights
- The minimum price increased to $470,000 in 2022, up from $332,500 in 2021, raising the entry point for buyers.
- The maximum price dropped to $3,725,000 in 2022, down from $5,000,000 in 2021, reflecting fewer ultra-high-end sales.
- The average sale price rose to $1,143,277 in 2022, compared to $999,952 in 2021, showcasing continued property value appreciation despite fewer sales.
- The median price also increased significantly to $941,087 in 2022, up from $890,000 in 2021, indicating higher mid-market pricing.
- The average price per square foot increased sharply to $287.99 in 2022, compared to $245.14 in 2021.
Property Features
Bedroom selection shifted slightly, with homes offering between 3 and 8 bedrooms in 2022, compared to 2 to 7 in 2021.
Average square footage decreased slightly to 3,929 sq. ft. in 2022, compared to 4,044 sq. ft. in 2021, while maximum square footage also dropped to 7,596 sq. ft. from 12,218 sq. ft.
Lot sizes showed major variability due to outliers, with a high in 2022 of 13+ acres
Market Dynamics
Homes took longer to sell on average, with the DOM (Days on Market) rising to 44 days in 2022, compared to 27 days in 2021. The median DOM also increased from 7 days to 17 days, pointing to reduced competition.
Sellers generally achieved their listing price, with the ClsPr/LstPr ratio holding steady at 100.09% in 2022, while the ClsPr/OLP ratio declined to 97.91%, reflecting more frequent price adjustments.
Rising mortgage rates (5.53% in 2022 vs. 3.15% in 2021) directly impacted affordability, slowing the pace of transactions.
Trends and Outliers
The most expensive property sold in 2022, a $3,725,000 estate, highlighted demand for luxury, but it fell short of 2021’s $5,000,000 record-breaking sale.
Lifestyle properties remained in demand, although slightly fewer pool homes were sold in 2022 (60) compared to 78 in 2021.
25 new construction homes were sold in 2022, up from 22 in 2021, showing sustained interest in modern, energy-efficient builds.
Key Takeaway
The real estate market in 2022 faced headwinds due to rising interest rates and broader economic pressures, leading to fewer transactions but higher home pricing across mid-tier and luxury segments. Buyers adjusted their budgets and expectations, while sellers experienced slightly slower sales cycles. Despite these challenges, the market maintained its appeal with diverse offerings and remained strong in adapting to economic shifts.
Summary of Real Estate Market Analysis for Lucas, TX in 2022
The 2022 real estate market in Lucas, Texas showcased remarkable resilience and adaptability despite challenging economic conditions, such as rising mortgage rates, higher living costs, and widespread economic uncertainty.
While transaction volume declined, the market maintained robust property values, with both average and median sale prices reflecting sustained demand for mid-tier and high-value homes. Key trends, such as the popularity of pool-equipped properties and an active segment for new constructions, highlighted shifting buyer priorities towards lifestyle-centric and modern designs.
The ability of Lucas’s market to cater to entry-level buyers and affluent investors alike showcased its balance and diversity. Although the pace of sales slowed overall, the market continued to thrive, demonstrating a steady foundation for future growth amidst evolving economic landscapes.
The Importance of Statistical Data in Lucas, Texas Real Estate Market
Did you know that appraisers and Realtors rely on historical statistical data to determine a property’s current value?
Analyzing historical market data is essential for making informed decisions in today’s real estate market. Examining past trends provides valuable insights that facilitate accurate pricing, more strategic negotiations, and a comprehensive understanding of market dynamics.
Unlock Exceptional Service!
Assistance with all your real estate needs in the Dallas-Fort Worth area is just a click or call away. Reach out at 214-940-8149 or connect through the links below.
Greetings! I’m Oleg Sedletsky, and I’m excited to introduce myself as your go-to full-time licensed Texas REALTOR® and Mortgage Loan Originator.
I proudly represent JPAR® – Real Estate Brokerage as a REALTOR® and Utopia Mortgage LLC as a Mortgage Loan Originator! My designations and certifications reflect my dedication to helping you achieve your real estate goals in Lucas, TX and other locations in the vibrant Dallas-Fort Worth area!
My commitment to ongoing professional development means I’m always enhancing my skills to serve you better. You can count on me as your trusted expert throughout your real estate journey. Plus, I’m fluent in English, Ukrainian, and Russian and ready to assist you every step of the way!
It’s All About You and Your Real Estate Goals!
My mission is to serve you! With my knowledge and expertise, I’m here to help you achieve all your real estate goals!
I’m passionate about helping buyers and sellers navigate the exciting real estate landscape in Lucas, Texas! Whether you’re searching for your dream home, exploring land options, or looking for commercial properties, my Real Estate Services have you covered.
Contact me today for all your real estate needs in Lucas, Texas! Call/text 214-940-8149
A Comprehensive Analysis of Single-Family Residential Housing Market in Lucas, TX: 2003 to Present
2003-2010
Lucas, TX Real Estate Market Report 2003: Analysis and Trends
Lucas, TX Real Estate Market Report 2004: Analysis and Trends
Lucas, TX Real Estate Market Report 2005: Analysis and Trends
Lucas, TX Real Estate Market Report 2006: Analysis and Trends
Lucas, TX Real Estate Market Report 2007: Analysis and Trends
Lucas, TX Real Estate Market Report 2008: Analysis and Trends
Lucas, TX Real Estate Market Report 2009: Analysis and Trends
Lucas, TX Real Estate Market Report 2010: Analysis and Trends
2011-2020
Lucas, TX Real Estate Market Report 2011: Analysis and Trends
Lucas, TX Real Estate Market Report 2012: Analysis and Trends
Lucas, TX Real Estate Market Report 2013: Analysis and Trends
Lucas, TX Real Estate Market Report 2014: Analysis and Trends
Lucas, TX Real Estate Market Report 2015: Analysis and Trends
Lucas, TX Real Estate Market Report 2016: Analysis and Trends
Lucas, TX Real Estate Market Report 2017: Analysis and Trends
Lucas, TX Real Estate Market Report 2018: Analysis and Trends
Lucas, TX Real Estate Market Report 2019: Analysis and Trends
Lucas, TX Real Estate Market Report 2020: Analysis and Trends
This market analysis is intended solely for educational purposes. This market analysis is based on data sourced from NTREIS, Inc. This analysis is exclusively focused on single-family homes and does not account for other property types. The total number of real estate transactions within the specified period and location may vary. Data accuracy cannot be guaranteed due to potential input errors made by NTREIS users. This market analysis does not account for all new construction home sales. If you need detailed information about recorded property sales or other public records, please contact the appropriate city or county office.
Lucas, TX Real Estate: A Comprehensive Analysis of the 2021 Single-Family Residential Housing Market
The year 2021 marked a continuation of unprecedented changes in the housing market, fueled by the second year of the COVID-19 pandemic. Buyers placed greater emphasis on luxury, functionality, and leisure as they adapted to evolving lifestyles and remote work.
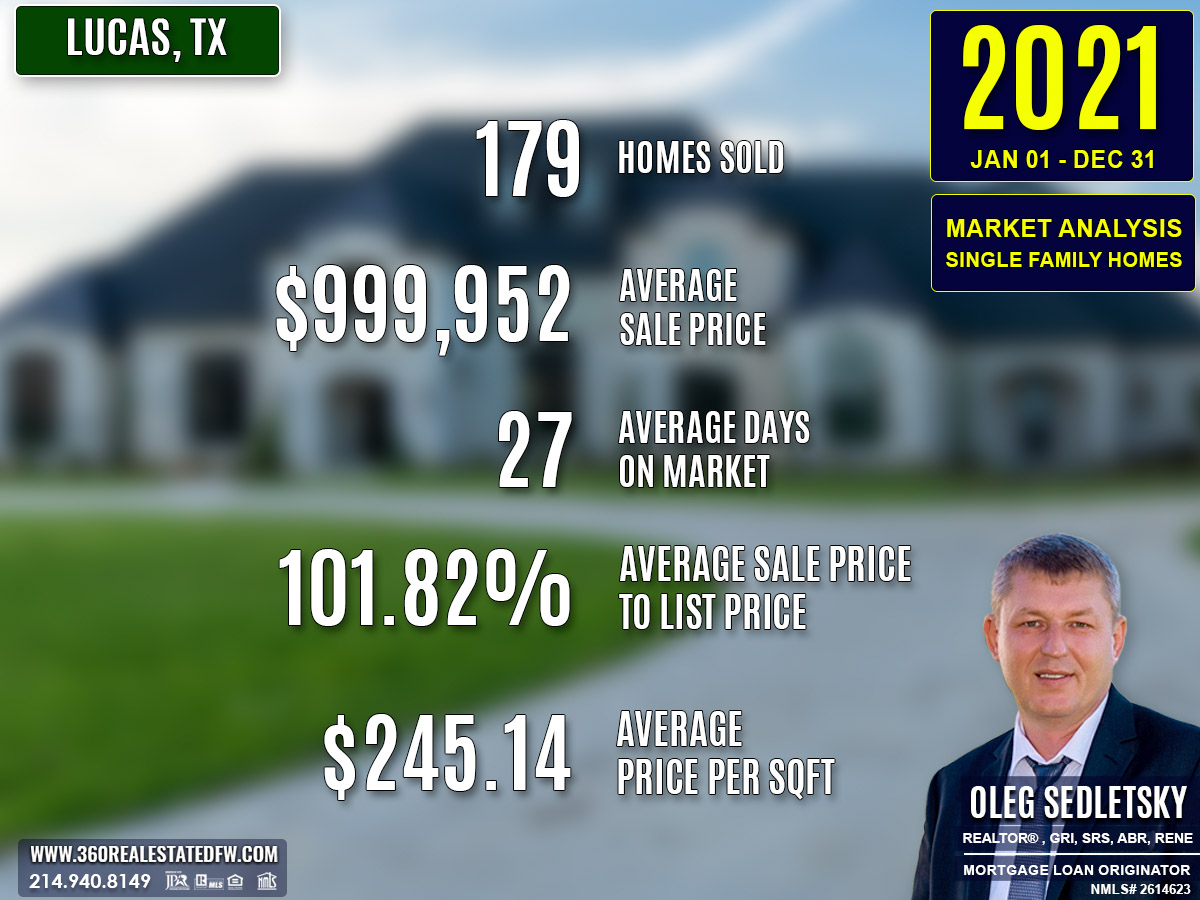
Under these conditions, the real estate market in Lucas, Texas experienced notable growth., with 179 homes sold, enhanced demand for high-end properties with pools, and a seller-favored competitive environment. Favorable economic conditions, including a low 3.15% average mortgage rate, further enabled buyers to make significant investments in real estate.
Key Takeaways and Trends from Lucas’s 2021 Real Estate Market
1. Pricing Range
- Prices spanned from $332,500 to $5,000,000, offering options for both budget-conscious and luxury buyers.
- The median price of $890,000 indicated solid mid-market activity buoyed by growth in high-value transactions.
2. Market Efficiency
- Homes sold notably faster, with a median DOM of just 7 days, setting a record for transaction speeds.
- Higher listing-to-close ratios (ClsPr/LstPr and ClsPr/OLP surpassing 101%) underscored intense buyer competition.
3. Unique Outliers
- The sale of 78 pool homes reflected shifting preferences for lifestyle amenities amid lingering pandemic constraints.
- The most expensive property sale emphasized the rising demand for premier luxury estates with oversized lots and unique features.
4. Mortgage Rates Impact
With the average mortgage rate falling to 3.15%, buyers had greater purchasing power, which contributed to elevated demand and rising prices across all market segments.
Total Homes Closed
A total of 179 homes were sold in Lucas, TX during 2021, reflecting steady growth from the previous year.
- 78 pool properties were sold, demonstrating the rising demand for leisure-focused features.
- 22 new construction homes offered energy-efficient features and modern amenities, catering to buyers prioritizing updated designs.
Property Pricing Insights
Lucas’s 2021 housing market showcased a broad pricing spectrum, from entry-level options to high-end estates.
- Minimum Price: $332,500
- Maximum Price: $5,000,000
- Average Price: $999,952
- Median Price: $890,000
- Average Price per Square Foot: $245.14
The overall market reflected robust growth in property values, with prices climbing to unprecedented highs. The upper tier saw impressive performance, particularly with luxury properties.
Property Size and Features
Buyers sought spacious homes that catered to work-from-home flexibility and lifestyle improvements.
- Bedrooms: Ranged from 2 to 7, with an average of 4 bedrooms.
- Bathrooms: Varied between 1 and 7, averaging 4 bathrooms.
- Square Footage: Home sizes ranged from 1,593 sq. ft. to a massive 12,218 sq. ft., with an average of 4,044 sq. ft.
- Lot Sizes: Properties spanned from 0.340 acres to 12.608 acres, offering ample outdoor space with an average lot size of 1.871 acres.
Market Dynamics
The Lucas, Texas real estate market in 2021 was defined by rapid sales and a high degree of competition.
- Days on Market (DOM): Homes sold significantly faster, averaging only 27 days, with a median DOM of 7 days, allowing sellers to close deals with minimal delays.
- ClsPr/LstPr Ratio: Sellers achieved an average of 101.82% of listing prices, signaling frequent bidding wars.
- ClsPr/OLP Ratio: Stood at 101.19%, reflecting strong seller power and limited price reductions.
- Average Price per Square Foot: Increased to $245.14, a testament to heightened property valuations.
Insights into the Most Expensive Lucas, TX Property Sold in 2021
The most expensive property sold in Lucas during 2021 was an opulent luxury estate priced at an impressive $5,000,000, setting a new benchmark for the city’s real estate market.
This property showcased world-class luxury, reflecting the appetite for exceptional amenities and design.
- Price: $5,000,000
- Beds/Baths: 5 bedrooms, 7 bathrooms (6 full, 1 half)
- Square Footage: 12,218 sq. ft.
- Price per Square Foot: $409.23
- Lot Size: 2.42 acres
- Days on Market (DOM): 107 days
- ClsPr/LstPr Ratio: 84.75%
- ClsPr/OLP Ratio: 84.75%
- Year Built: 2016
While taking longer to sell and witnessing a lower-than-average ClsPr/LstPr ratio, this estate highlighted luxury and scale, appealing to niche buyers valuing grandeur and exclusivity.
Economic context
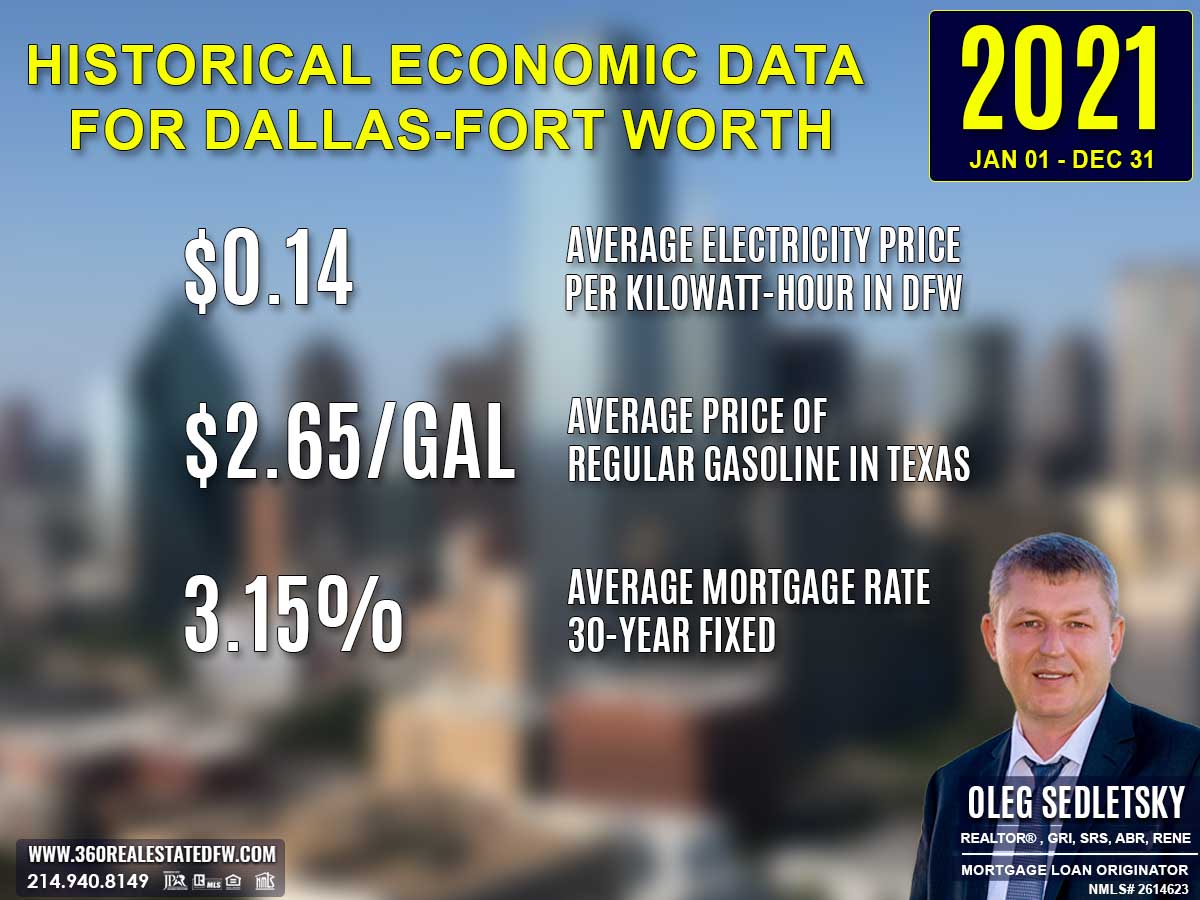
Average Electricity Costs in Dallas-Fort Worth in 2021
Electricity prices rose again to $0.14 per kilowatt-hour in 2021, up from $0.13 in 2020. This upward trend in energy costs likely pushed buyers to prioritize homes with efficient heating and cooling systems. Green-certified homes may have seen increased interest as buyers sought to offset higher utility bills.
Average Price for Regular Gasoline in Texas in 2021
Gas prices climbed to $2.65 per gallon in 2021, up from $1.82 in the prior year. This sharp increase put pressure on household budgets, especially for buyers with long commutes. Urban properties or homes in transit-accessible locations likely became more appealing as buyers aimed to minimize transportation expenses.
Average 30-Year Fixed Mortgage Rate in 2021
The average 30-year fixed mortgage rate dropped slightly to 3.15% in 2021, down from 3.38% in 2020. This decline further fueled homebuying demand, making mortgages more affordable despite rising home prices. Potential homebuyers were strongly advised to secure pre-approval through local mortgage loan originators to enhance their financial readiness during highly competitive conditions.
Curious about today’s mortgage rates and the home you can comfortably afford?
Submit a no-obligation mortgage application today and get pre-approved to determine your budget and take the first step toward homeownership with confidence.
Overview of Differences Between the 2020 and 2021 Real Estate Markets in Lucas, Texas
Total Homes Sold
There was an increase in transactions, rising from 170 homes in 2020 to 179 in 2021, signaling continued growth despite ongoing pandemic conditions.
Pricing Insights
- The minimum price rose to $332,500 in 2021 from $210,000 in 2020, reflecting higher entry points into the market.
- The maximum price more than doubled to $5,000,000 in 2021, compared to $1,749,000 in 2020, showcasing the city’s ability to attract higher-value transactions.
- The average price surged to $999,952, up from $750,027 in 2020, while the median price increased to $890,000, compared to $695,000 in 2020, underlining a stronger mid-market and high-tier activity.
- The average price per square foot jumped to $245.14 in 2021, compared to $188.03 in 2020, indicating broader property value appreciation.
Property Features
- The most noteworthy size jump was in maximum square footage, increasing to 12,218 sq. ft. in 2021 from 8,260 sq. ft. in 2020, catering to buyers seeking more lavish spaces.
- There was a slight increase in the average square footage, rising from 4,020 sq. ft. in 2020 to 4,044 sq. ft. in 2021.
- Lot sizes tightened slightly for the maximum range, with 12.608 acres in 2021, compared to 18.463 acres in 2020, though the average remained stable at around 1.87 acres.
Market Dynamics
- Homes sold faster in 2021, with an average Days on Market (DOM) dropping sharply to 27 days, compared to 76 days in 2020.
- The median DOM dropped even more significantly to just 7 days in 2021, from 36 days the previous year.
- Sellers experienced greater market strength in 2021, as the ClsPr/LstPr ratio rose to 101.82%, compared to 97.66% in 2020.
- Similarly, the ClsPr/OLP ratio increased to 101.19%, from 95.52% in 2020.
Trends and Outliers
- There was heightened demand for leisure properties, with the sale of 78 pool homes in 2021, compared to 69 in 2020, continuing the lifestyle-focused trend.
- The most expensive property sold in 2021 was a $5,000,000 luxury estate, significantly exceeding the $1,749,000 top transaction in 2020, marking a new high for Lucas.
Economic Factors
- The mortgage rate dipped from 3.38% in 2020 to 3.15% in 2021, further boosting buyers’ purchasing power and facilitating high-value transactions.
- Gas prices rose sharply to an average of $2.65 in 2021, compared to $1.82 in 2020, potentially influencing operating costs associated with larger properties.
Key Takeaway
The year 2021 saw accelerated growth in transaction volume, property valuations, and stronger seller advantages, driven by quicker sales and rising property values. Lucas’s real estate market catered to a broader spectrum of buyers while entering new territory with higher-priced luxury sales, reflecting its resilience and adaptability.
Summary of Real Estate Market Analysis for Lucas, TX in 2021
In 2021 Lucas, Texas real estate market illustrated exceptional resilience and adaptability during the second year of the COVID-19 pandemic. Buyers demonstrated shifting priorities, with increased demand for properties offering lifestyle amenities like pools and spacious layouts for both work and leisure.
The market broke new ground with a record-setting luxury estate sale and saw rapid transaction speeds, propelled by unparalleled market efficiency. Low mortgage rates further enhanced affordability, enabling strong buyer engagement despite rising gas prices and economic uncertainties. With its ability to balance a diverse range of buyer needs and maintain a thriving, competitive atmosphere, Lucas’s housing market stands as a testament to robust growth and innovation, paving the way for continued success in fluctuating conditions.
The Importance of Statistical Data in Lucas, Texas Real Estate Market
Did you know that appraisers and Realtors rely on historical statistical data to determine a property’s current value?
Analyzing historical market data is essential for making informed decisions in today’s real estate market. Examining past trends provides valuable insights that facilitate accurate pricing, more strategic negotiations, and a comprehensive understanding of market dynamics.
Unlock Exceptional Service!
Assistance with all your real estate needs in the Dallas-Fort Worth area is just a click or call away. Reach out at 214-940-8149 or connect through the links below.
Greetings! I’m Oleg Sedletsky, and I’m excited to introduce myself as your go-to full-time licensed Texas REALTOR® and Mortgage Loan Originator.
I proudly represent JPAR® – Real Estate Brokerage as a REALTOR® and Utopia Mortgage LLC as a Mortgage Loan Originator! My designations and certifications reflect my dedication to helping you achieve your real estate goals in Lucas, TX and other locations in the vibrant Dallas-Fort Worth area!
My commitment to ongoing professional development means I’m always enhancing my skills to serve you better. You can count on me as your trusted expert throughout your real estate journey. Plus, I’m fluent in English, Ukrainian, and Russian and ready to assist you every step of the way!
It’s All About You and Your Real Estate Goals!
My mission is to serve you! With my knowledge and expertise, I’m here to help you achieve all your real estate goals!
I’m passionate about helping buyers and sellers navigate the exciting real estate landscape in Lucas, Texas! Whether you’re searching for your dream home, exploring land options, or looking for commercial properties, my Real Estate Services have you covered.
Contact me today for all your real estate needs in Lucas, Texas! Call/text 214-940-8149
A Comprehensive Analysis of Single-Family Residential Housing Market in Lucas, TX: 2003 to Present
2003-2010
Lucas, TX Real Estate Market Report 2003: Analysis and Trends
Lucas, TX Real Estate Market Report 2004: Analysis and Trends
Lucas, TX Real Estate Market Report 2005: Analysis and Trends
Lucas, TX Real Estate Market Report 2006: Analysis and Trends
Lucas, TX Real Estate Market Report 2007: Analysis and Trends
Lucas, TX Real Estate Market Report 2008: Analysis and Trends
Lucas, TX Real Estate Market Report 2009: Analysis and Trends
Lucas, TX Real Estate Market Report 2010: Analysis and Trends
2011-2020
Lucas, TX Real Estate Market Report 2011: Analysis and Trends
Lucas, TX Real Estate Market Report 2012: Analysis and Trends
Lucas, TX Real Estate Market Report 2013: Analysis and Trends
Lucas, TX Real Estate Market Report 2014: Analysis and Trends
Lucas, TX Real Estate Market Report 2015: Analysis and Trends
Lucas, TX Real Estate Market Report 2016: Analysis and Trends
Lucas, TX Real Estate Market Report 2017: Analysis and Trends
Lucas, TX Real Estate Market Report 2018: Analysis and Trends
Lucas, TX Real Estate Market Report 2019: Analysis and Trends
Lucas, TX Real Estate Market Report 2020: Analysis and Trends
This market analysis is intended solely for educational purposes. This market analysis is based on data sourced from NTREIS, Inc. This analysis is exclusively focused on single-family homes and does not account for other property types. The total number of real estate transactions within the specified period and location may vary. Data accuracy cannot be guaranteed due to potential input errors made by NTREIS users. This market analysis does not account for all new construction home sales. If you need detailed information about recorded property sales or other public records, please contact the appropriate city or county office.
Lucas, TX Real Estate: A Comprehensive Analysis of the 2020 Single-Family Residential Housing Market
The year 2020 brought unprecedented challenges due to the COVID-19 pandemic, yet real estate market in Lucas, Texas demonstrated remarkable resilience.
Shifts in buyer needs, such as prioritizing leisure spaces and spacious layouts, drove market activity. With 170 transactions closed, this represented a strong rebound and adaptability in meeting the lifestyle changes prompted by the pandemic.
Favorable economic conditions, including an average 30-year fixed mortgage rate of 3.38%, further boosted buyer confidence.
Key Takeaways and Trends from Lucas’s 2020 Real Estate Market
Pricing Range
- Properties were available from $210,000 to $1,749,000, offering diversity for buyers at different levels.
- A medium price point of $695,000 balanced affordability with quality—especially attractive to mid-tier buyers.
2. Market Efficiency
- Median DOM was just 36 days, significantly faster than in 2019, indicating strong demand and competitive offers.
- The average DOM also dropped to 76 days, reflecting fewer delays in closing deals across all market segments.
- Sellers achieved an average ClsPr/LstPr ratio of 97.66%, underscoring the efficiency of this seller-driven market.
3. Unique Outliers
- Elevated demand for lifestyle-driven properties evidenced by the sale of 69 pool homes—a jump from the previous year.
- The most expensive property’s large 9.952-acre lot highlighted the growing desire for private outdoor space.
4. Mortgage Rates Impact
A sharp decline in the average mortgage rate to 3.38%, compared to 4.13% in 2019, significantly boosted purchasing power and fueled market participation, even amid economic uncertainties.
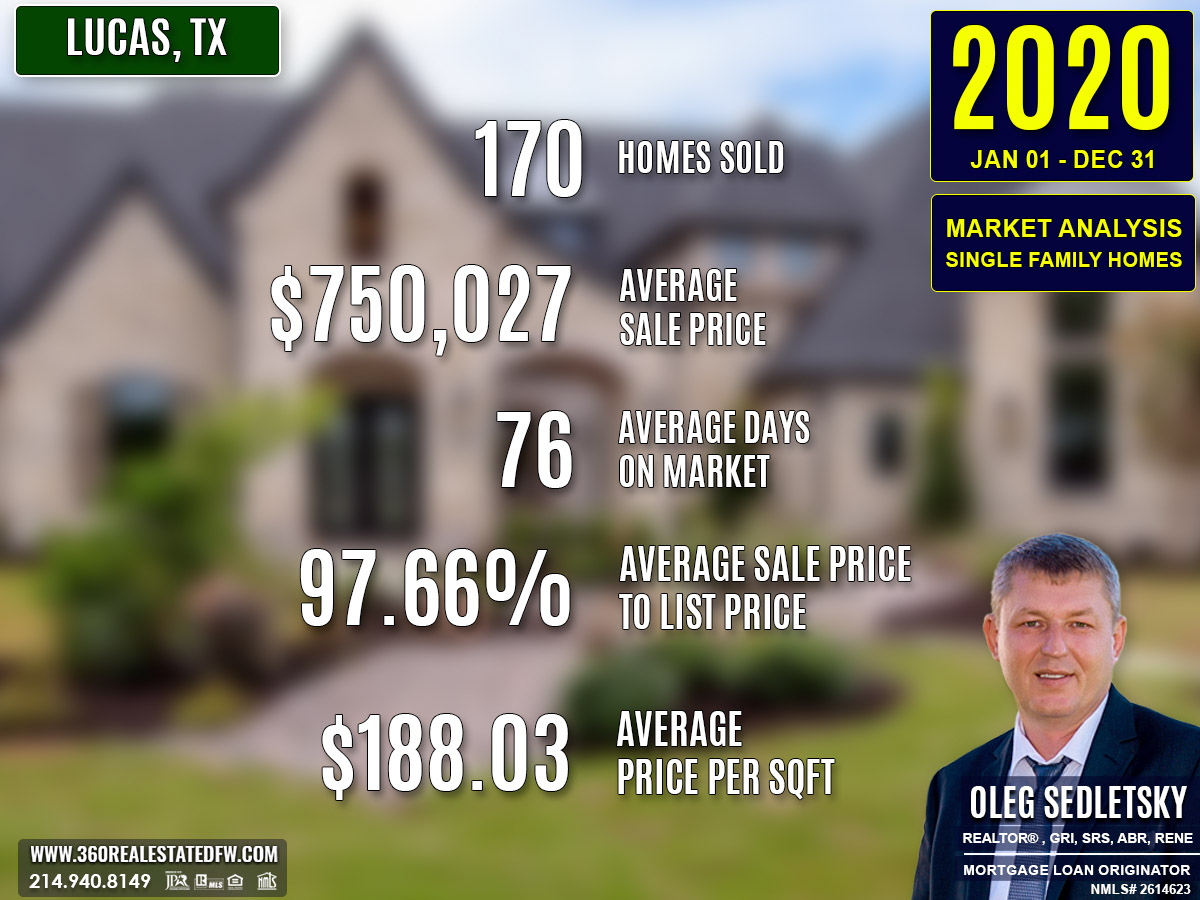
Total Homes Closed
The city of Lucas, TX saw 170 homes sold, marking a significant increase from the previous year.
- An impressive 69 homes featured pools, highlighting the demand for homes equipped with leisure-focused outdoor amenities.
- 31 new construction homes provided buyers with modern designs and energy-efficient construction options, proving popular in a year when home updates and functionality took center stage.
Property Pricing Insights
The 2020 market displayed diverse property values with active participation in both the affordable and luxury sectors:
- Minimum Price: $210,000, offering accessible entry-level options.
- Maximum Price: $1,749,000, showcasing robust interest in high-end estates.
- Average Price: $750,027, reflecting continued property appreciation.
- Median Price: $695,000, indicating consistent activity in mid-market transactions.
- Average Price per Square Foot: $188.03, higher than in previous years, reflecting an increase in property values and demand.
Property Size and Features
Buyers in 2020 sought premium features and spacious properties with the following characteristics:
- Bedrooms: Ranged from 2 to 10, with an average of 4 bedrooms, suitable for families.
- Bathrooms: Varied between 2 to 9 bathrooms, with an average of 4 baths, supporting flexible living needs.
- Square Footage: Homes ranged from 876 sq. ft. to 8,260 sq. ft., with an average of 4,020 sq. ft., meeting the demand for bigger homes.
- Lot Sizes: Spanned 0.230 acres to 18.463 acres, with an average of 1.852 acres, catering to buyers seeking outdoor space.
Market Dynamics
Adaptability and changing trends showed in Lucas’s market dynamics:
- Days on Market (DOM): Homes averaged 76 days, with a median DOM of 36 days, reflecting quicker turnover compared to previous years.
- ClsPr/LstPr Ratio: Sellers achieved 97.66% of listing prices, indicating a competitive market.
- ClsPr/OLP Ratio: Stood at 95.52%, showing slight price adjustments but strong buyer commitment.
Insights into the Most Expensive Lucas, TX Property Sold in 2020
A standout transaction in 2020 was a luxurious $1,749,000 estate, spotlighting the market strength at the top tier. Boasting high-quality features and acreage, the property drew significant attention.
Key highlights include:
- Price: $1,749,000
- Beds/Baths: 6 bedrooms, 6 bathrooms (5 full, 1 half)
- Square Footage: 6,196 sq. ft.
- Price per Square Foot: $282.28
- Lot Size: 9.952 acres
- Days on Market (DOM): 59 days
- ClsPr/LstPr Ratio: 94.59%
- ClsPr/OLP Ratio: 94.59%
- Year Built: 1993
Features such as a saltwater pool and an expansive almost 10-acre lot demonstrated the appeal of properties that merged luxury with outdoor privacy, a growing trend in the pandemic era.
Economic context
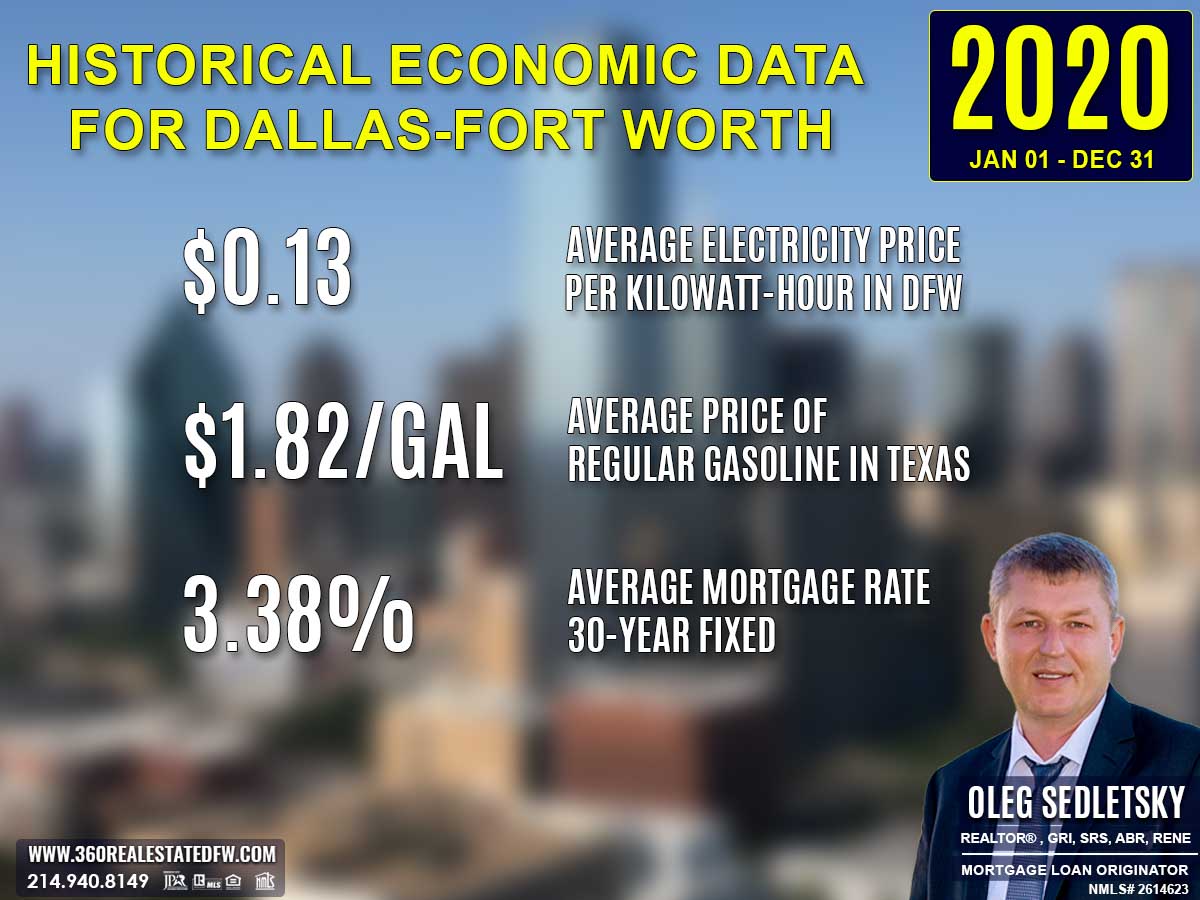
Average Electricity Costs in Dallas-Fort Worth in 2020
Electricity prices returned to $0.13 per kilowatt-hour in 2020, slightly lower than 2019’s $0.14. This small decrease might have supported household budgets as the economy faced numerous uncertainties. Energy savings further highlighted the appeal of efficient homes, adding value to sustainable designs and energy-conscious upgrades.
Average Price for Regular Gasoline in Texas in 2020
Gas prices dipped to $1.82 per gallon in 2020, down significantly from $2.29 in 2019. Lower transportation costs provided financial relief to homebuyers, potentially boosting interest in suburban and rural areas where homes were larger and more affordable. The drop in gas prices gave buyers more flexibility in location choices.
Average 30-Year Fixed Mortgage Rate in 2020
Mortgage rates averaged just 3.38% in 2020, a steep drop from 4.13% the previous year. This marked an historic low, attracting a surge of homebuyers eager to lock in affordable financing. Pre-approval with local mortgage loan originators became an essential first step as buyers navigated increased competition in a hot market.
Curious about today’s mortgage rates and the home you can comfortably afford?
Submit a no-obligation mortgage application today and get pre-approved to determine your budget and take the first step toward homeownership with confidence.
Overview of Differences Between the 2019 and 2020 Real Estate Markets in Lucas, Texas
Total Homes Sold
A substantial increase was observed in homes sold, with 170 transactions in 2020 compared to 143 in 2019, signaling heightened activity despite the pandemic.
Pricing Insights
- The minimum price dropped to $210,000 in 2020 from $302,000 in 2019, offering more affordable entry points.
- The maximum price fell slightly to $1,749,000 in 2020 versus $1,858,752 the prior year, though robust luxury sales persisted.
- The average price climbed to $750,027, up from $736,869 in 2019, demonstrating continued property appreciation.
- Similarly, the median price dropped to $695,000 from $714,000, reflecting a slight shift in mid-market dynamics.
- The average price per square foot rose to $188.03, up from $175.23 in 2019, suggesting growth in overall property values.
Property Features
- Bedroom and bathroom configurations expanded, with up to 10 bedrooms and 9 bathrooms in 2020, compared to 7 bedrooms and 7 bathrooms in 2019, showcasing larger family-oriented homes.
- Square footage peaked at 8,260 sq. ft. in 2020, exceeding the 7,660 sq. ft. max in 2019, offering larger living spaces.
- Larger lot sizes reached 18.463 acres in 2020, up from 17.000 acres the previous year, reflecting preferences for spacious outdoor areas.
Market Dynamics
- Median Days on Market (DOM) fell significantly to 36 days in 2020 from 69 days in 2019, indicating faster turnover.
- The average DOM dropped notably to 76 days in 2020, from 107 days in 2019, showcasing enhanced transaction momentum.
- The ClsPr/LstPr ratio improved to 97.66% in 2020, compared to 97.43% in 2019, reflecting competitive offers.
- ClsPr/OLP ratio also rose to 95.52% in 2020, up from 93.00% the previous year, highlighting stronger pricing strategies.
Trends and Outliers
- There was an increase in homes with pools, rising to 69 pool homes in 2020, compared to 59 in 2019, reflecting lifestyle changes driven by the pandemic.
- Fewer new construction homes were sold in 2020 (31) compared to 33 in 2019, though they remained popular due to modern features.
- The most expensive property in 2020 emphasized privacy and outdoor living with nearly 10 acres and a saltwater pool.
- Mortgage rates dropped sharply to an average of 3.38% in 2020, compared to 4.13% in 2019, greatly enhancing affordability and stimulating increased market activity.
Key Takeaway
The year 2020 marked a dynamic shift in buyer preferences, spurred by pandemic-driven lifestyle changes. The drop in mortgage rates amplified affordability, leading to more transactions, faster sales, and a focus on properties with lifestyle amenities like pools and outdoor spaces.
Summary of Real Estate Market Analysis for Lucas, TX in 2020
Lucas’s real estate market in 2020 stood as a testament to its resilience and adaptability, navigating the challenges of the first year of the COVID-19 pandemic. The market demonstrated a clear ability to balance affordability, luxury, and shifting buyer priorities, with a significant rise in demand for leisure-focused amenities and outdoor living spaces.
Faster sales and a broadened pricing range highlighted the diversity of options, ensuring the market catered to varied buyer demographics. Lower mortgage rates played a pivotal role in driving affordability, opening avenues for heightened activity across all segments. Overall, Lucas’s real estate sector not only weathered the uncertainties brought by the pandemic but emerged stronger and more dynamic, setting a remarkable foundation for continued growth and innovation.
The Importance of Statistical Data in Lucas, Texas Real Estate Market
Did you know that appraisers and Realtors rely on historical statistical data to determine a property’s current value?
Analyzing historical market data is essential for making informed decisions in today’s real estate market. Examining past trends provides valuable insights that facilitate accurate pricing, more strategic negotiations, and a comprehensive understanding of market dynamics.
Unlock Exceptional Service!
Assistance with all your real estate needs in the Dallas-Fort Worth area is just a click or call away. Reach out at 214-940-8149 or connect through the links below.
Greetings! I’m Oleg Sedletsky, and I’m excited to introduce myself as your go-to full-time licensed Texas REALTOR® and Mortgage Loan Originator.
I proudly represent JPAR® – Real Estate Brokerage as a REALTOR® and Utopia Mortgage LLC as a Mortgage Loan Originator! My designations and certifications reflect my dedication to helping you achieve your real estate goals in Lucas, TX and other locations in the vibrant Dallas-Fort Worth area!
My commitment to ongoing professional development means I’m always enhancing my skills to serve you better. You can count on me as your trusted expert throughout your real estate journey. Plus, I’m fluent in English, Ukrainian, and Russian and ready to assist you every step of the way!
It’s All About You and Your Real Estate Goals!
My mission is to serve you! With my knowledge and expertise, I’m here to help you achieve all your real estate goals!
I’m passionate about helping buyers and sellers navigate the exciting real estate landscape in Lucas, Texas! Whether you’re searching for your dream home, exploring land options, or looking for commercial properties, my Real Estate Services have you covered.
Contact me today for all your real estate needs in Lucas, Texas! Call/text 214-940-8149
A Comprehensive Analysis of Single-Family Residential Housing Market in Lucas, TX: 2003 to Present
2003-2010
Lucas, TX Real Estate Market Report 2003: Analysis and Trends
Lucas, TX Real Estate Market Report 2004: Analysis and Trends
Lucas, TX Real Estate Market Report 2005: Analysis and Trends
Lucas, TX Real Estate Market Report 2006: Analysis and Trends
Lucas, TX Real Estate Market Report 2007: Analysis and Trends
Lucas, TX Real Estate Market Report 2008: Analysis and Trends
Lucas, TX Real Estate Market Report 2009: Analysis and Trends
Lucas, TX Real Estate Market Report 2010: Analysis and Trends
2011-2020
Lucas, TX Real Estate Market Report 2011: Analysis and Trends
Lucas, TX Real Estate Market Report 2012: Analysis and Trends
Lucas, TX Real Estate Market Report 2013: Analysis and Trends
Lucas, TX Real Estate Market Report 2014: Analysis and Trends
Lucas, TX Real Estate Market Report 2015: Analysis and Trends
Lucas, TX Real Estate Market Report 2016: Analysis and Trends
Lucas, TX Real Estate Market Report 2017: Analysis and Trends
Lucas, TX Real Estate Market Report 2018: Analysis and Trends
Lucas, TX Real Estate Market Report 2019: Analysis and Trends
Lucas, TX Real Estate Market Report 2020: Analysis and Trends
This market analysis is intended solely for educational purposes. This market analysis is based on data sourced from NTREIS, Inc. This analysis is exclusively focused on single-family homes and does not account for other property types. The total number of real estate transactions within the specified period and location may vary. Data accuracy cannot be guaranteed due to potential input errors made by NTREIS users. This market analysis does not account for all new construction home sales. If you need detailed information about recorded property sales or other public records, please contact the appropriate city or county office.

Lucas, TX Real Estate: A Comprehensive Analysis of the 2019 Single-Family Residential Housing Market
Lucas’s real estate market in 2019 saw a resurgence in activity, recording 143 homes sold, a notable recovery from the previous year. With an emphasis on modern features, leisure-focused amenities, and a steady interest in luxury housing, the market continued to attract diverse buyer groups. Economic factors like a relatively low average 30-year mortgage rate of 4.13% supported buyer confidence, ensuring balance between affordability and demand for upscale properties.
Key Takeaways and Trends from Lucas’s 2019 Real Estate Market
Pricing Range
- Properties ranged from $302,000 to $1,858,752, ensuring accessibility for first-time buyers and indulgence for luxury seekers.
- A steady average price of $736,869, coupled with a median of $714,000, reinforced pricing strength across the market.
2. Market Efficiency
- While median DOM stood at 69 days, supporting faster turnover in high-demand segments, luxury properties averaged longer timeframes, pushing the average DOM to 107 days.
- Seller alignment with buyer expectations was evident with 97.43% of listing prices achieved.
3. Unique Outliers
- 59 pool homes and a notable increase to 33 new construction homes captured heightened demand for lifestyle-specific preferences.
- The most expensive property achieved 132.78% of its original listing price, indicative of market enthusiasm for high-end builds.
4. Mortgage Rates Impact
The decrease in the average 30-year mortgage rate to 4.13% supported buyer purchasing power. This helped offset rising property values, enabling stable market engagement across diverse price brackets.
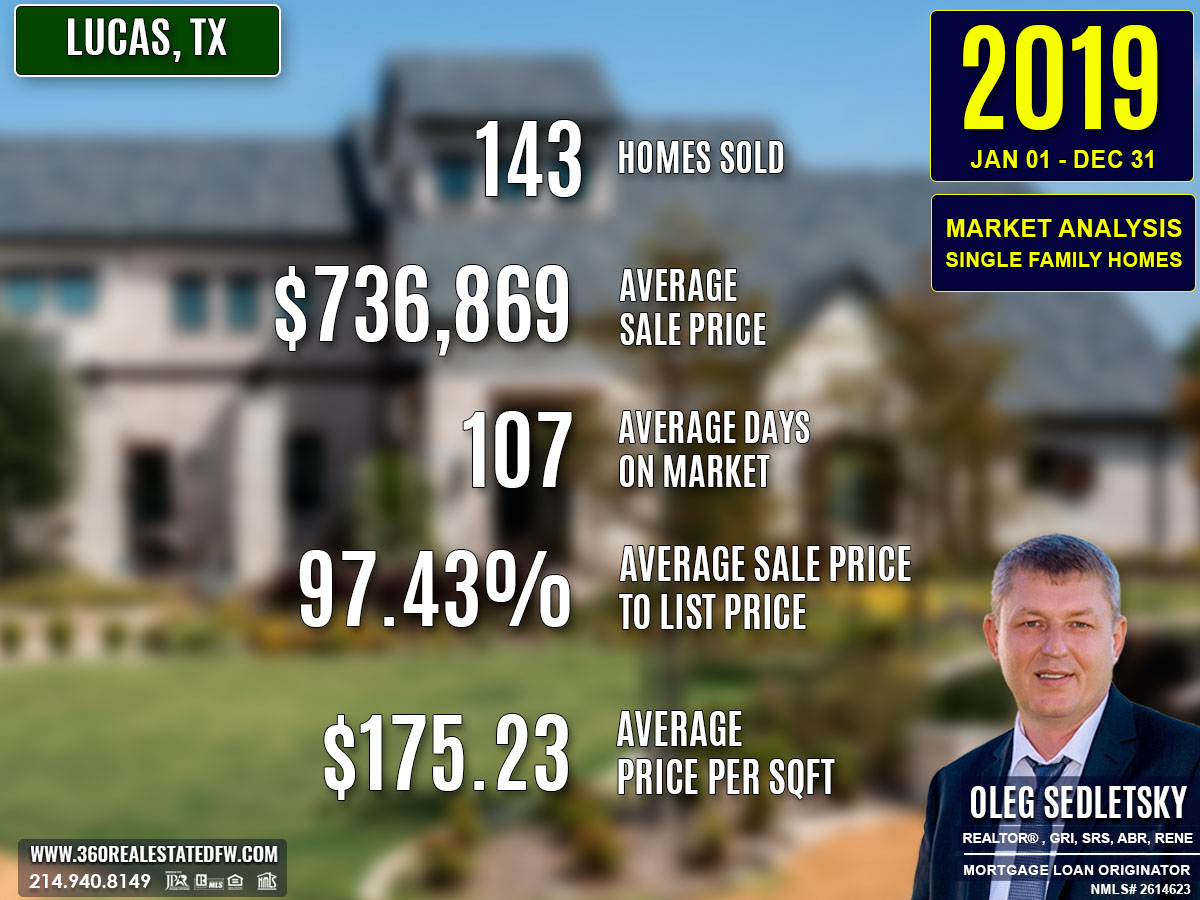
Total Homes Closed
The market closed 143 transactions, a significant increase from 2018’s total of 102.
- 59 homes featured pools, reflecting a sustained preference for outdoor living.
- 33 new construction homes catered specifically to buyers aiming for modern, energy-efficient properties.
Property Pricing Insights
The 2019 market displayed strong appreciation trends across various pricing categories:
- Minimum Price: $302,000, offering entry-level access to homeownership.
- Maximum Price: $1,858,752, showcasing the strength of the luxury segment.
- Average Price: $736,869, reflecting healthy valuation trends.
- Median Price: $714,000, indicating strong activity in the mid-to-upper price range.
- Average Price per Square Foot: $175.23, marking stability in property value per square foot.
Property Size and Features
A variety of homes appealed to different buyer needs with these statistics:
- Bedrooms: Ranged from 3 to 7, with an average of 4 bedrooms, ideal for families or larger households.
- Bathrooms: Configurations ranged from 2 to 7, averaging 4 bathrooms, meeting the demand for extra space and luxury.
- Square Footage: Properties spanned from 1,698 sq. ft. to 7,660 sq. ft., with an average of 4,211 sq. ft., offering ample space for buyers at different price points.
- Lot Sizes: Ranged from 0.330 acres to 17.000 acres, with an average of 1.827 acres, broadening the appeal for buyers seeking outdoor space.
Market Dynamics
Efficiency in the market reflected steady buyer activity and occasional adjustments:
- Avg. Days on Market (DOM): 107 days, showing slightly protracted luxury and niche segments.
- Median DOM: 69 days, indicating quicker sales in the high-demand mid-tier segment.
- ClsPr/LstPr Ratio: 97.43%, demonstrating alignment in buyer-seller expectations.
- ClsPr/OLP Ratio: 93.00%, indicating frequent strategic price adjustments during listings.
Insights into the Most Expensive Lucas, TX Property Sold in 2019
The most expensive property sold in Lucas, Texas, during 2019 was a luxurious custom-built home crafted by Homes by J Anthony in the prestigious Barry Farms neighborhood. This marked the third consecutive year that the Homes by J Anthony custom home builder claimed the top sale, solidifying their dominance in the luxury market. This stunning estate, priced at $1,858,752, dazzled with its modern design and high-end features, showcasing why it was a standout transaction in the market. Below are the key metrics of this exceptional property:
- Price: $1,858,752
- Beds/Baths: 5 bedrooms, 6 bathrooms (5 full, 1 half)
- Square Footage: 5,278 sq. ft.
- Price per Square Foot: $352.17
- Lot Size: 2.000 acres
- Days on Market (DOM): 256 days
- ClsPr/LstPr Ratio: 121.89%
- ClsPr/OLP Ratio: 132.78%
- Year Built: 2018
This opulent property underscored the city’s robust appetite for premium homes and demonstrated the enduring appeal of custom, new-construction residences on 1-acre or larger lots in Lucas, TX, designed to cater to discerning, luxury-focused buyers.
Economic context

Average Electricity Costs in Dallas-Fort Worth in 2019
The average electricity price in 2019 climbed to $0.14 per kilowatt-hour, up from $0.13 in 2018. This uptick added some pressure on household budgets, further solidifying the need for energy-efficient homes. Properties featuring solar panels or smart home technologies likely gained value as homebuyers sought ways to mitigate rising energy expenses.
Average Price for Regular Gasoline in Texas in 2019
Gas prices fell slightly to $2.29 per gallon in 2019, down from $2.44 in 2018. This small decline brought modest relief to transportation costs and may have encouraged suburban home purchases, where commuting distances tend to be longer. Homebuyers likely balanced fuel costs with home prices when making location decisions.
Average 30-Year Fixed Mortgage Rate in 2019
Mortgage rates averaged 4.13% in 2019, down from 4.70% the year before. This noticeable decline made homeownership more attainable for many homebuyers and likely spurred activity in the housing market. Pre-approvals through local mortgage loan originators remained key for buyers wanting to confidently pursue homes amid favorable rate conditions.
Curious about today’s mortgage rates and the home you can comfortably afford?
Submit a no-obligation mortgage application today and get pre-approved to determine your budget and take the first step toward homeownership with confidence.
Overview of Differences Between the 2018 and 2019 Real Estate Markets in Lucas, Texas
Total Homes Sold
Lucas, Texas saw 143 homes closed in 2019, a substantial increase from 102 in 2018, reflecting recovering market activity.
Pricing Insights
- Minimum price climbed to $302,000 in 2019, up from $165,000 in 2018, indicating higher entry-level property values.
- The maximum price surged to $1,858,752, compared to $1,569,213 in 2018, showcasing expanded demand in the luxury segment.
- The average price reached $736,869, up from $667,747 in 2018, marking notable appreciation.
- The median price rose slightly to $714,000, compared to $647,500 in 2018, reflecting strengthened mid-market transactions.
- The average price per square foot remained stable at $175.23 in 2019, compared to $175.49 in the prior year, suggesting steady valuation.
Property Features
- Bedroom counts were 3 to 7 in 2019, compared to 2 to 6 in 2018, indicating broader offerings in larger homes.
- Bathrooms ranged from 2 to 7 in 2019, consistent with 2018 figures but maintaining luxury configurations.
- Square footage peaked at 7,660 sq. ft. in 2019, up from 6,693 sq. ft. in 2018, accommodating consumer interest in spacious properties.
- Lot sizes expanded to 17.000 acres at the high end in 2019, compared to 7.034 acres in 2018, showcasing more estate-style properties.
Market Dynamics
- The average Days on Market (DOM) rose to 107 days in 2019, up from 91 in 2018, reflecting prolonged sales times in luxury segments.
- The median DOM climbed to 69 days, from 55 days in 2018, indicating some slowing in mid-tier turnover.
- ClsPr/LstPr Ratio remained strong at 97.43% in 2019, slightly higher than 96.67% in 2018, revealing better seller-buyer alignment.
- The ClsPr/OLP ratio improved to 93.00%, up from 92.71% in 2018, highlighting better pricing strategies.
Trends and Outliers
- Significant growth in new construction homes from 27 in 2018 to 33 in 2019, reflecting consistent demand for modern features.
- 59 homes with pools were sold in 2019, a jump from 37 in 2018, underlining increased interest in leisure-oriented amenities.
- The most expensive property, a $1,858,752 luxury home built by Homes by J Anthony, significantly exceeded the top sale of 2018 at $1,569,213. It also had a remarkable 132.78% ClsPr/OLP ratio, demonstrating a robust market for premium custom builds.
Economic Influences
The average 30-year mortgage rate decreased to 4.13% in 2019, down from 4.70% in 2018, positively impacting buyer affordability and supporting the rise in transaction volume.
Key Takeaway
Lucas’s market rebound in 2019 showcased stronger transaction activity and higher valuations. The luxury segment saw significant growth, and lifestyle-focused features such as pools and spacious lots gained popularity, highlighting the evolving preferences of homebuyers. Lower mortgage rates further enhanced accessibility, ensuring a balanced and vibrant market.
Summary of Real Estate Market Analysis for Lucas, TX in 2019
Lucas’s 2019 real estate market demonstrated a robust comeback, combining diversity, balance, and opportunity to cater to a wide range of buyers. With an increase in transactions, rising median prices, and growing interest in leisure amenities like pool homes and spacious lots, the market reflected vibrant activity and adaptability. The luxury segment flourished, highlighted by record-breaking sales that underscored the city’s appeal to high-end buyers.
At the same time, affordable entry points and modern new construction homes satisfied first-time homebuyers and families alike. Favorable economic conditions, including lower mortgage rates, further supported buyer engagement. Overall, Lucas’s real estate sector proved resilient and forward-thinking, setting the stage for even greater achievements in the years ahead.
The Importance of Statistical Data in Lucas, Texas Real Estate Market
Did you know that appraisers and Realtors rely on historical statistical data to determine a property’s current value?
Analyzing historical market data is essential for making informed decisions in today’s real estate market. Examining past trends provides valuable insights that facilitate accurate pricing, more strategic negotiations, and a comprehensive understanding of market dynamics.
Unlock Exceptional Service!
Assistance with all your real estate needs in the Dallas-Fort Worth area is just a click or call away. Reach out at 214-940-8149 or connect through the links below.
Greetings! I’m Oleg Sedletsky, and I’m excited to introduce myself as your go-to full-time licensed Texas REALTOR® and Mortgage Loan Originator.
I proudly represent JPAR® – Real Estate Brokerage as a REALTOR® and Utopia Mortgage LLC as a Mortgage Loan Originator! My designations and certifications reflect my dedication to helping you achieve your real estate goals in Lucas, TX and other locations in the vibrant Dallas-Fort Worth area!
My commitment to ongoing professional development means I’m always enhancing my skills to serve you better. You can count on me as your trusted expert throughout your real estate journey. Plus, I’m fluent in English, Ukrainian, and Russian and ready to assist you every step of the way!
It’s All About You and Your Real Estate Goals!
My mission is to serve you! With my knowledge and expertise, I’m here to help you achieve all your real estate goals!
I’m passionate about helping buyers and sellers navigate the exciting real estate landscape in Lucas, Texas! Whether you’re searching for your dream home, exploring land options, or looking for commercial properties, my Real Estate Services have you covered.
Contact me today for all your real estate needs in Lucas, Texas! Call/text 214-940-8149
A Comprehensive Analysis of Single-Family Residential Housing Market in Lucas, TX: 2003 to Present
2003-2010
Lucas, TX Real Estate Market Report 2003: Analysis and Trends
Lucas, TX Real Estate Market Report 2004: Analysis and Trends
Lucas, TX Real Estate Market Report 2005: Analysis and Trends
Lucas, TX Real Estate Market Report 2006: Analysis and Trends
Lucas, TX Real Estate Market Report 2007: Analysis and Trends
Lucas, TX Real Estate Market Report 2008: Analysis and Trends
Lucas, TX Real Estate Market Report 2009: Analysis and Trends
Lucas, TX Real Estate Market Report 2010: Analysis and Trends
2011-2020
Lucas, TX Real Estate Market Report 2011: Analysis and Trends
Lucas, TX Real Estate Market Report 2012: Analysis and Trends
Lucas, TX Real Estate Market Report 2013: Analysis and Trends
Lucas, TX Real Estate Market Report 2014: Analysis and Trends
Lucas, TX Real Estate Market Report 2015: Analysis and Trends
Lucas, TX Real Estate Market Report 2016: Analysis and Trends
Lucas, TX Real Estate Market Report 2017: Analysis and Trends
Lucas, TX Real Estate Market Report 2018: Analysis and Trends
Lucas, TX Real Estate Market Report 2019: Analysis and Trends
Lucas, TX Real Estate Market Report 2020: Analysis and Trends
This market analysis is intended solely for educational purposes. This market analysis is based on data sourced from NTREIS, Inc. This analysis is exclusively focused on single-family homes and does not account for other property types. The total number of real estate transactions within the specified period and location may vary. Data accuracy cannot be guaranteed due to potential input errors made by NTREIS users. This market analysis does not account for all new construction home sales. If you need detailed information about recorded property sales or other public records, please contact the appropriate city or county office.

Lucas, TX Real Estate: A Comprehensive Analysis of the 2018 Single-Family Residential Housing Market
The 2018 real estate market in Lucas, Texas exhibited a slight decline in activity compared to prior years, closing with fewer transactions. Despite this contraction, the market showed resilience and adaptability, emphasizing leisure-driven features, modern energy-efficient builds, and a balanced range of housing options. The notably higher average mortgage rate of 4.70% presented challenges, yet buyers continued to engage across various price points, underscoring Lucas’s enduring market appeal.
Key Takeaways and Trends from Lucas’s 2018 Real Estate Market
Pricing Range
- A minimum price of $165,000 and maximum of $1,569,213 demonstrated the market’s diversity, catering to first-time buyers and luxury seekers alike.
- The average price per square foot rose to $175.49, reflecting increasing home values and a competitive price point relative to size.
2. Market Efficiency
- Faster sales were observed in the mid-tier market, with median DOM at 55 days, while luxury and unique segments contributed to a higher average DOM of 91 days.
- Close price to listing price ratios showed consistent alignment, with 96.67% achieved overall.
3. Unique Outliers
- The luxury segment flourished, as reflected by quick, high-value sales like the custom Rockland Farms home.
- 37 pool homes and 27 new builds captured specific buyer interests in leisure and energy efficiency.
4. Mortgage Rates Impact
The rise in the average 30-year fixed mortgage rate, reaching 4.70%, placed pressure on affordability, particularly in the entry and mid-tier markets. However, buyers in higher price brackets remained active, showcasing resilience and adaptability.
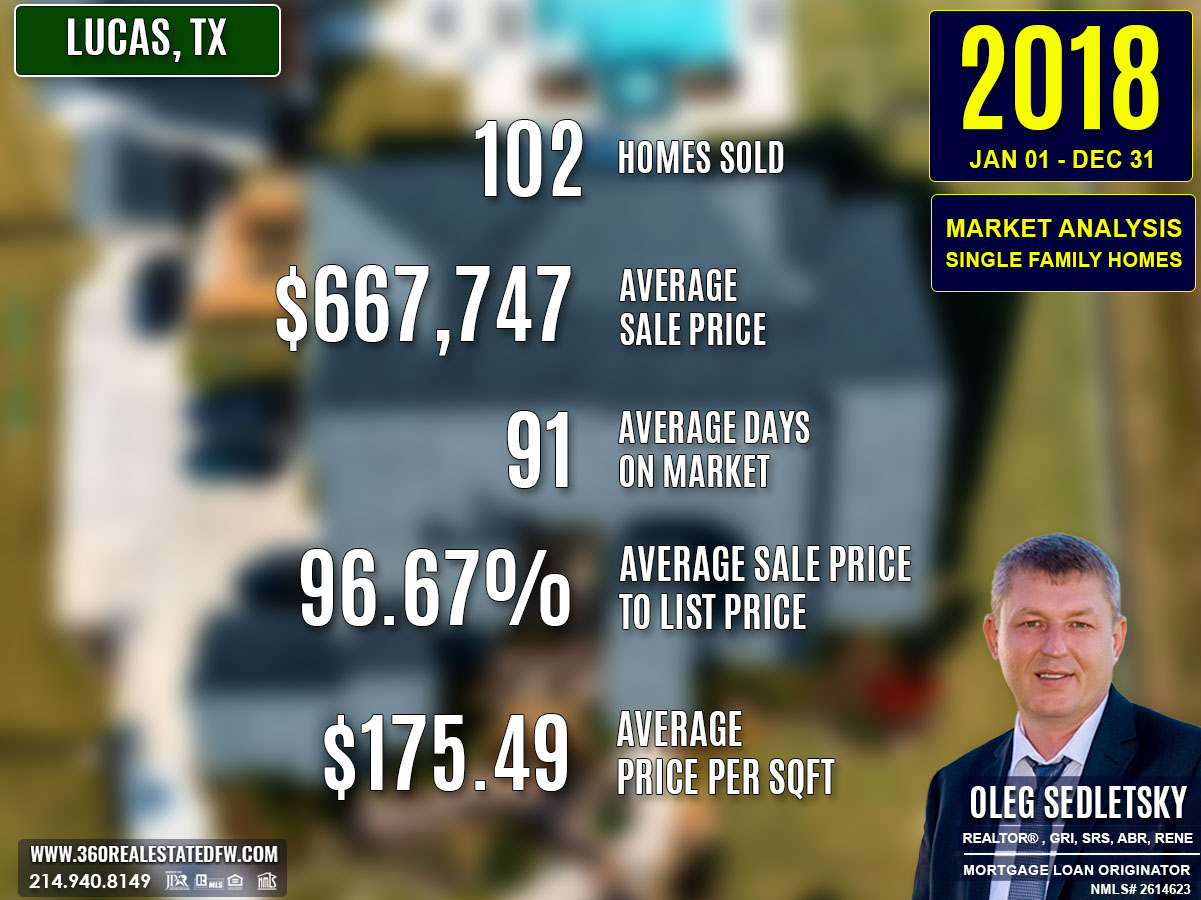
Total Homes Closed
Lucas, TX saw 102 homes closed during 2018, reflecting a slowdown in transaction volume. Among these, 27 were new construction homes, appealing to buyers seeking contemporary features and energy efficiency. Additionally, 37 properties with pools highlighted the continued demand for outdoor leisure amenities, catering to lifestyle-focused buyers.
Property Pricing Insights
The 2018 housing market displayed a diverse pricing spectrum:
- Minimum Price: $165,000—exhibiting accessibility at the entry level.
- Maximum Price: $1,569,213—featuring luxury estate offerings.
- Average Price: $667,747—slightly higher compared to prior years, maintaining steady appreciation trends.
- Median Price: $647,500—reinforcing Lucas’s mid-market strength for both buyers and sellers.
- Average Price per Sq. Ft.: $175.49—demonstrating rising property valuations.
Property Size and Features
A variety of property sizes and configurations catered to diverse buyer preferences:
- Bedrooms: Ranged from 2 to 6, with an average of 4 bedrooms, ideal for family buyers.
- Bathrooms: Offered 2 to 7 bathrooms, averaging 4, reflecting upscale living options.
- Square Footage: Homes ranged between 820 sq. ft. and 6,693 sq. ft., with an average size of 3,838 sq. ft., appealing to those seeking spacious interiors.
- Lot Sizes: Ranged from 0.413 to 7.034 acres, averaging 1.675 acres, balancing suburban needs with estate-style properties.
Market Dynamics
Efficiency showed mixed results, with certain metrics reflecting slower turnover rates:
- Average Days on Market (DOM): Properties took an average of 91 days, impacted by higher mortgage rates and luxury segments.
- Median DOM: Homes typically sold faster in 55 days, reflecting high demand in the mid-tier market.
- ClsPr/LstPr Ratio: Sellers achieved 96.67% of listing prices, showcasing buyer and seller alignment.
- ClsPr/OLP Ratio: At 92.71%, observed adjustments were common for initial pricing strategies.
- Average Price per Sq. Ft.: Increased to $175.49, reflecting a steady rise in housing valuations.
Insights into the Most Expensive Lucas, TX Property Sold in 2018
The most expensive property sold in Lucas, Texas during 2018 was an exceptional new construction luxury custom home, creating a statement in quality and modern living. Built by Homes by J Anthony custom home builder, this impressive property was located in the desirable Rockland Farms neighborhood. Selling for $1,569,213, it delivered contemporary elegance combined with functional space and premium features.
Here are the key metrics of this standout property:
- Price: $1,569,213
- Beds/Baths: 5 bedrooms, 7 bathrooms (5 full, 2 half)
- Square Footage: 6,270 sq. ft.
- Price per Square Foot: $250.27
- Lot Size: 2.000 acres
- Days on Market (DOM): 2 days – indicating strong buyer demand for high-end luxury homes.
- ClsPr/LstPr Ratio: 98.38%
- ClsPr/OLP Ratio: 98.38%
- Year Built: 2018
This sale highlighted the market’s ability to support premium real estate offerings, reinforcing Rockland Farms as a sought-after enclave for luxury buyers. With its quick sale timeline and impressive build quality, the property exemplifies the demand for custom new-construction homes on spacious 1-acre or larger lots in Lucas, TX.
Economic context
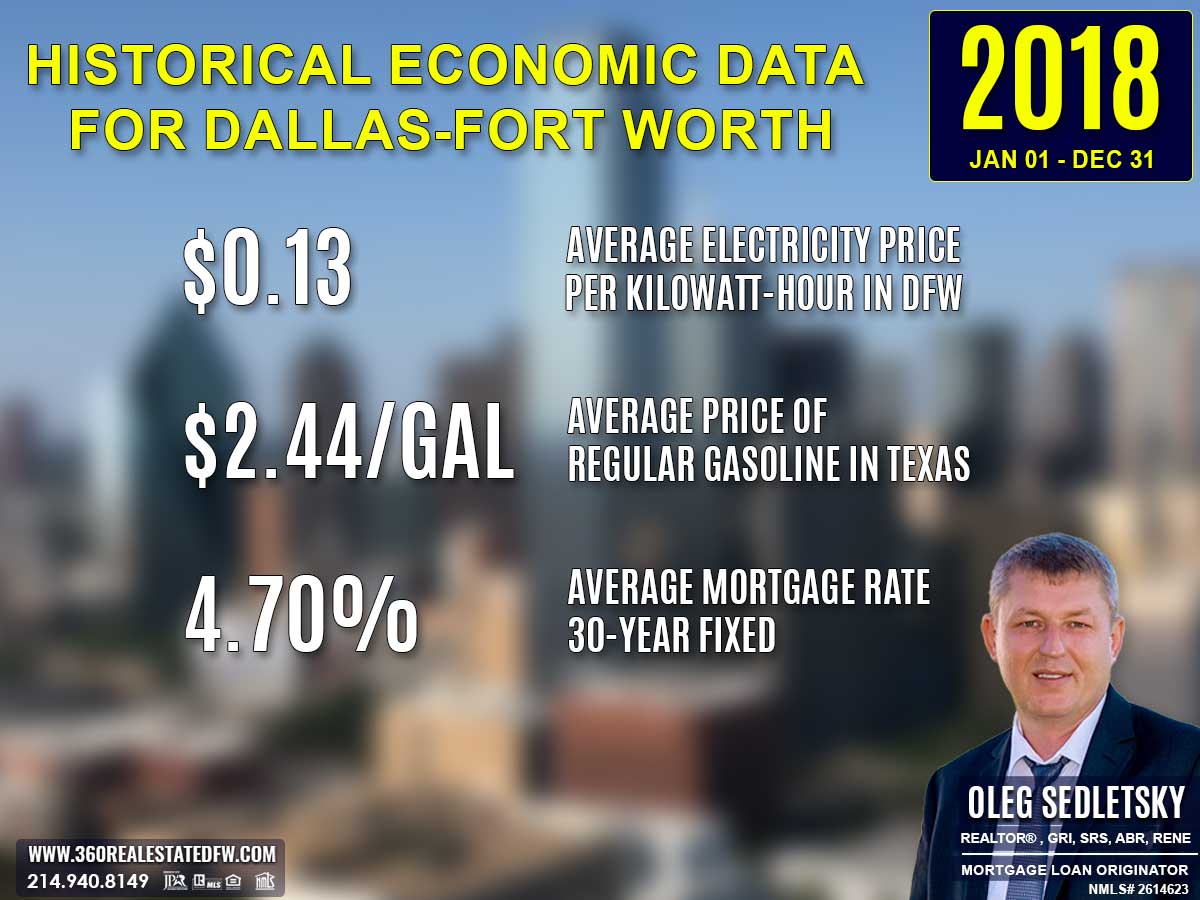
Average Electricity Costs in Dallas-Fort Worth in 2018
Electricity prices increased to $0.13 per kilowatt-hour in 2018, compared to $0.12 in 2017. This climb likely drove demand for energy-efficient housing and renovations, placing greater emphasis on properties with modern upgrades that helped households manage increasing utility costs.
Average Price for Regular Gasoline in Texas in 2018
Gas prices also rose, reaching $2.44 per gallon in 2018, up from $2.19 in 2017. With transportation becoming more expensive, proximity to workplaces and public transportation remained important for homebuyers. Walkable neighborhoods and mixed-use developments gained traction during this period.
Average 30-Year Fixed Mortgage Rate in 2018
Mortgage rates climbed to 4.70% in 2018, from 4.14% in the previous year. For many homebuyers, this level of interest rate signaled urgency to act before rates increased further. Getting pre-approved by a local mortgage loan originator was pivotal for navigating the pressures of a market increasingly shaped by rising rates.
Curious about today’s mortgage rates and the home you can comfortably afford?
Submit a no-obligation mortgage application today and get pre-approved to determine your budget and take the first step toward homeownership with confidence.
Overview of Differences Between the 2017 and 2018 Real Estate Markets in Lucas, Texas
Total Homes Sold
102 homes closed in 2018, down from 148 in 2017, reflecting a clear decline in transaction activity.
Pricing Insights
- The minimum price dropped to $165,000 in 2018 from $195,000 in 2017, expanding affordability slightly on the lower end.
- The maximum price increased significantly to $1,569,213, up from $1,361,472 in 2017, highlighting growth in the luxury market.
- The average price rose slightly to $667,747, compared to $660,429 in 2017, indicating a steady rate of appreciation.
- The median price remained stable at $647,500 in 2018 compared to $649,450 in 2017.
- The average price per square foot climbed to $175.49, up from $167.08 in the previous year, showcasing rising property values.
Property Features
- Bedroom counts ranged from 2 to 6 in 2018, a reduction from the broader range of 2 to 8 in 2017.
- The upper range for bathrooms grew with a maximum of 7 in 2018, up from 10 in 2017, while still offering generous configurations.
- Square footage peaked at 6,693 sq. ft. in 2018, down from 7,286 sq. ft. in 2017, though average sizes remained aligned at 3,838 sq. ft.
- Lot sizes saw a reduction, with a maximum acreage of 7.034 in 2018, compared to 8.189 in 2017, reflecting a focus on moderately sized estates.
Market Dynamics
- The median Days on Market (DOM) increased slightly to 55 days in 2018, compared to 44 in 2017, but the average DOM jumped to 91 days, up from 75 in the prior year, hinting at slower turnover in specific segments.
- ClsPr/LstPr Ratio decreased slightly to 96.67%, compared to 97.81% in 2017, reflecting minor pricing pressure.
- ClsPr/OLP Ratio also dipped to 92.71%, down from 95.52% in 2017, signaling more instances of pricing adjustments.
Notable Trends and Outliers
The most expensive property in 2018, priced at $1,569,213, was significantly higher than the $1,361,472 luxury benchmark in 2017, and sold within just 2 days, underscoring rapid demand in the luxury segment.
New construction numbers dropped slightly to 27 in 2018, down from 34 in 2017, while pool homes dipped to 37, from 61 in 2017, driven by shifts in buyer preferences.
Economic Influences
The average 30-year fixed mortgage rate rose to 4.70% in 2018, up from 4.14% in 2017, potentially contributing to a reduced pace of transactions and extended DOM figures.
Key Takeaway
Lucas’s real estate market in 2018 scaled back in transaction volume but retained robust price appreciation and strong activity within the luxury sector. The higher mortgage rates and slight reductions in pool and new construction homes tempered overall sales, but the market’s ability to sustain high-value transactions showed its enduring appeal.
Summary of Real Estate Market Analysis for Lucas, TX in 2018
Lucas’s 2018 real estate market highlighted its ability to cater to diverse buyer preferences, showcasing a balance between affordability and opulent luxury. While the overall transaction volume declined, the market demonstrated resilience through price appreciation, modern features, and standout events such as the rapid sale of premium luxury properties. With new construction homes and pool properties maintaining significant demand, the market’s diversity proved crucial in appealing to a broad spectrum of buyers.
Despite the challenges posed by rising mortgage rates, Lucas’s real estate sector thrived by offering a dynamic mix of opportunities, affirming its place as a vibrant and adaptive housing market. Looking ahead, this foundation sets the stage for continued innovation and growth in the years to come.
The Importance of Statistical Data in Lucas, Texas Real Estate Market
Did you know that appraisers and Realtors rely on historical statistical data to determine a property’s current value?
Analyzing historical market data is essential for making informed decisions in today’s real estate market. Examining past trends provides valuable insights that facilitate accurate pricing, more strategic negotiations, and a comprehensive understanding of market dynamics.
Unlock Exceptional Service!
Assistance with all your real estate needs in the Dallas-Fort Worth area is just a click or call away. Reach out at 214-940-8149 or connect through the links below.
Greetings! I’m Oleg Sedletsky, and I’m excited to introduce myself as your go-to full-time licensed Texas REALTOR® and Mortgage Loan Originator.
I proudly represent JPAR® – Real Estate Brokerage as a REALTOR® and Utopia Mortgage LLC as a Mortgage Loan Originator! My designations and certifications reflect my dedication to helping you achieve your real estate goals in Lucas, TX and other locations in the vibrant Dallas-Fort Worth area!
My commitment to ongoing professional development means I’m always enhancing my skills to serve you better. You can count on me as your trusted expert throughout your real estate journey. Plus, I’m fluent in English, Ukrainian, and Russian and ready to assist you every step of the way!
It’s All About You and Your Real Estate Goals!
My mission is to serve you! With my knowledge and expertise, I’m here to help you achieve all your real estate goals!
I’m passionate about helping buyers and sellers navigate the exciting real estate landscape in Lucas, Texas! Whether you’re searching for your dream home, exploring land options, or looking for commercial properties, my Real Estate Services have you covered.
Contact me today for all your real estate needs in Lucas, Texas! Call/text 214-940-8149
A Comprehensive Analysis of Single-Family Residential Housing Market in Lucas, TX: 2003 to Present
2003-2010
Lucas, TX Real Estate Market Report 2003: Analysis and Trends
Lucas, TX Real Estate Market Report 2004: Analysis and Trends
Lucas, TX Real Estate Market Report 2005: Analysis and Trends
Lucas, TX Real Estate Market Report 2006: Analysis and Trends
Lucas, TX Real Estate Market Report 2007: Analysis and Trends
Lucas, TX Real Estate Market Report 2008: Analysis and Trends
Lucas, TX Real Estate Market Report 2009: Analysis and Trends
Lucas, TX Real Estate Market Report 2010: Analysis and Trends
2011-2020
Lucas, TX Real Estate Market Report 2011: Analysis and Trends
Lucas, TX Real Estate Market Report 2012: Analysis and Trends
Lucas, TX Real Estate Market Report 2013: Analysis and Trends
Lucas, TX Real Estate Market Report 2014: Analysis and Trends
Lucas, TX Real Estate Market Report 2015: Analysis and Trends
Lucas, TX Real Estate Market Report 2016: Analysis and Trends
Lucas, TX Real Estate Market Report 2017: Analysis and Trends
Lucas, TX Real Estate Market Report 2018: Analysis and Trends
Lucas, TX Real Estate Market Report 2019: Analysis and Trends
Lucas, TX Real Estate Market Report 2020: Analysis and Trends
This market analysis is intended solely for educational purposes. This market analysis is based on data sourced from NTREIS, Inc. This analysis is exclusively focused on single-family homes and does not account for other property types. The total number of real estate transactions within the specified period and location may vary. Data accuracy cannot be guaranteed due to potential input errors made by NTREIS users. This market analysis does not account for all new construction home sales. If you need detailed information about recorded property sales or other public records, please contact the appropriate city or county office.