

Things to do In Farmersville, TX: Make a Splash at the Incredible Robbin Lamkin Memorial Splash Pad (Over 30 Photos)
Farmersville Delights: Where Kids and Families Make Lasting Memories.
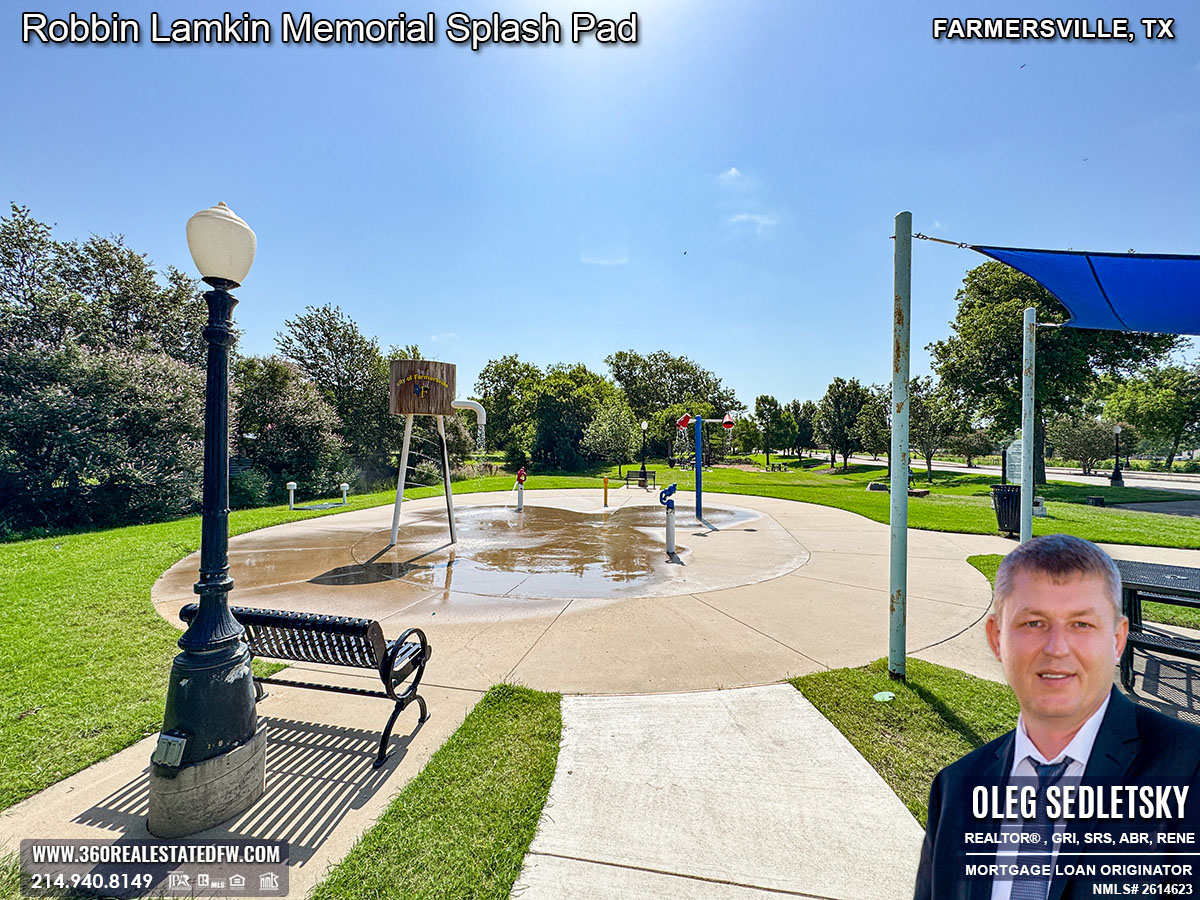
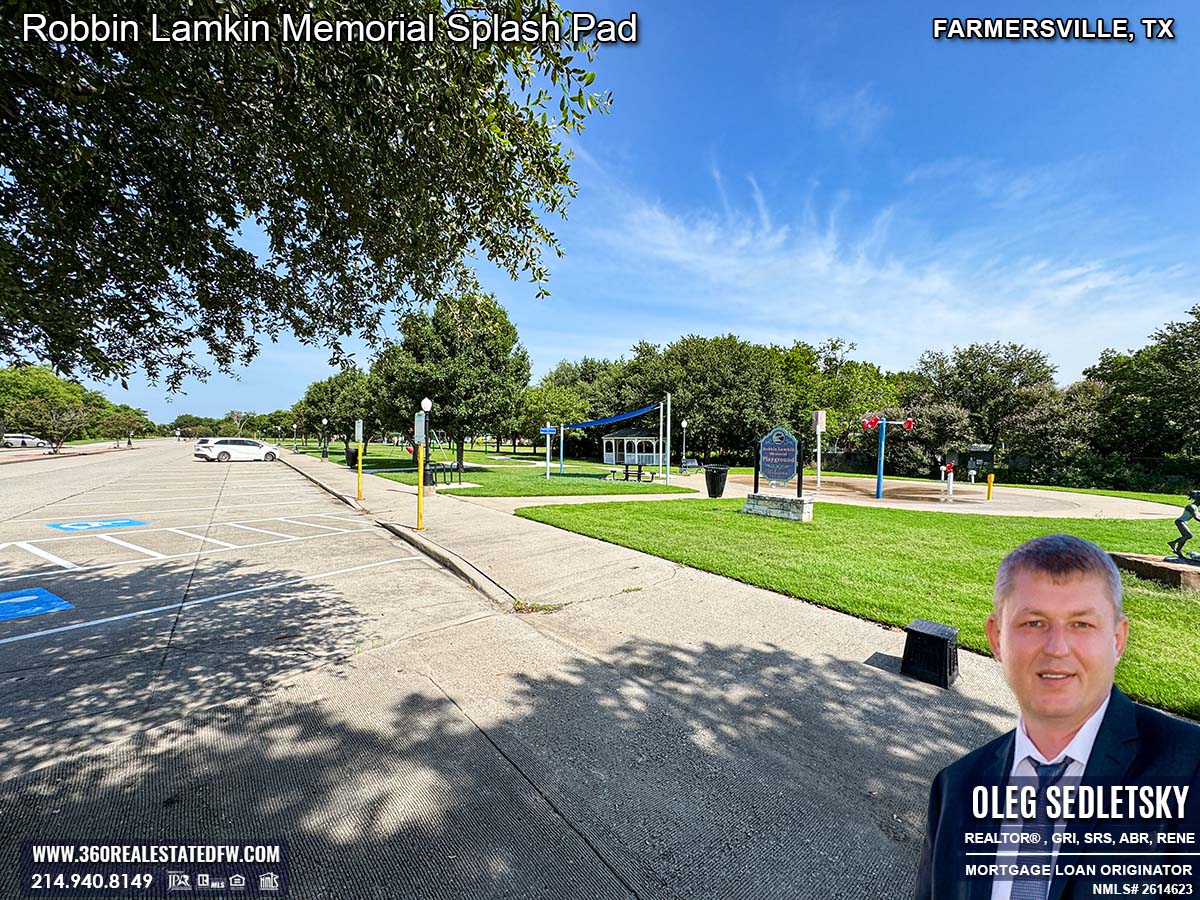
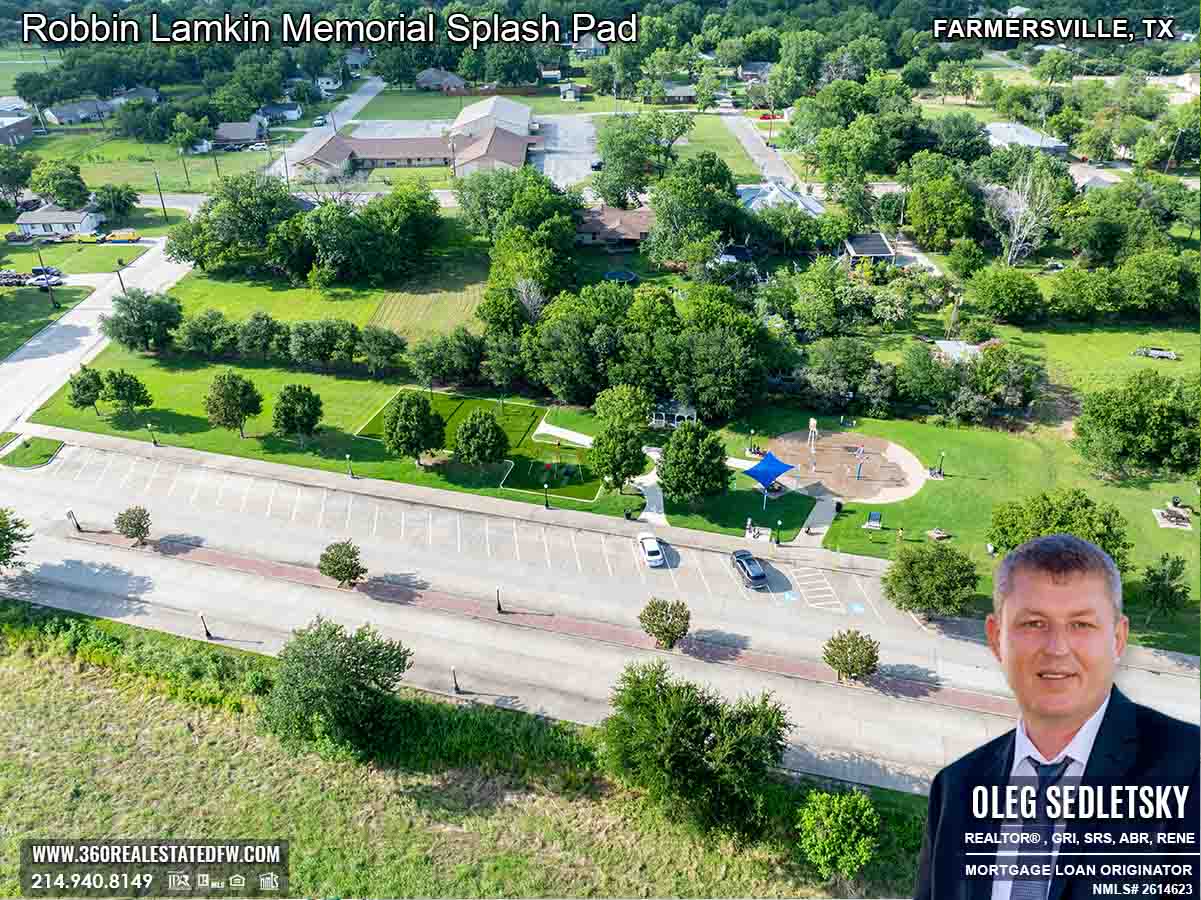
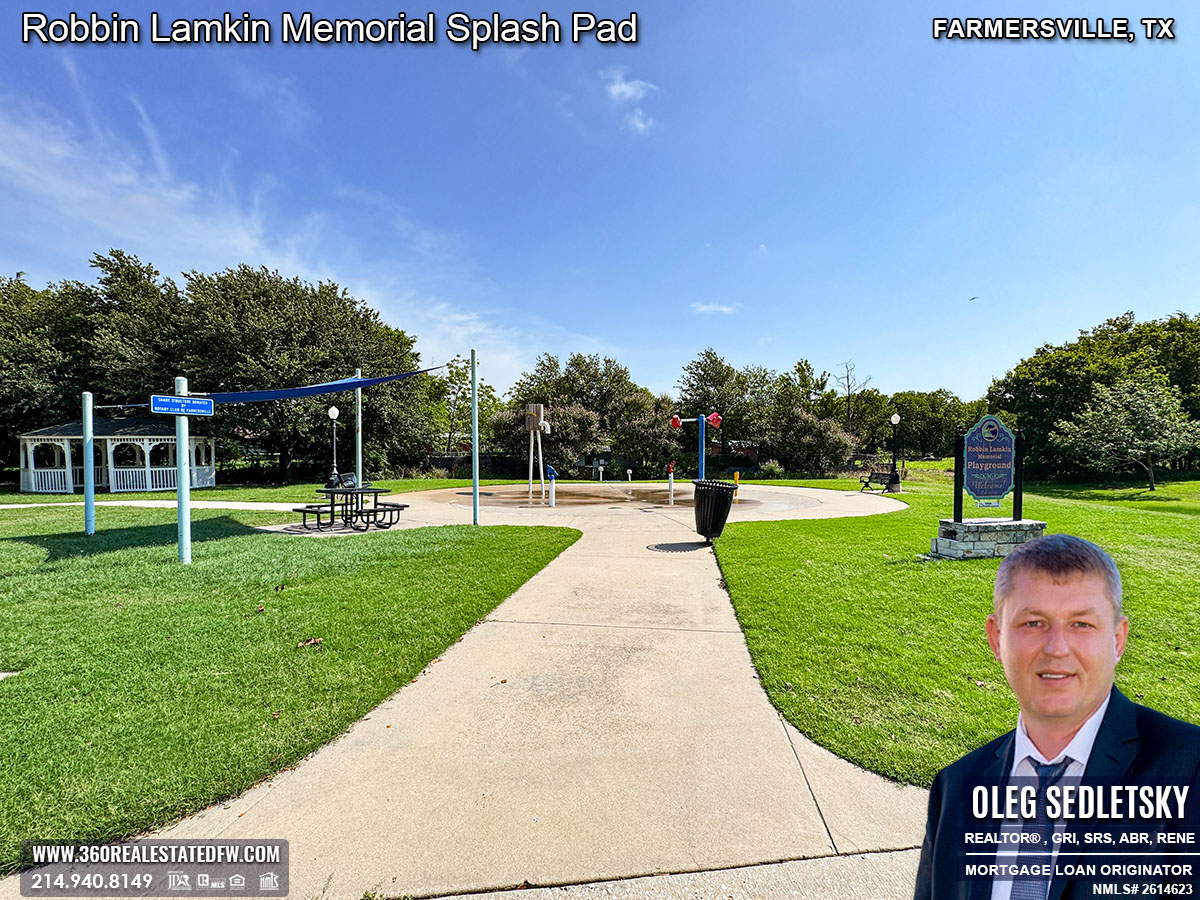
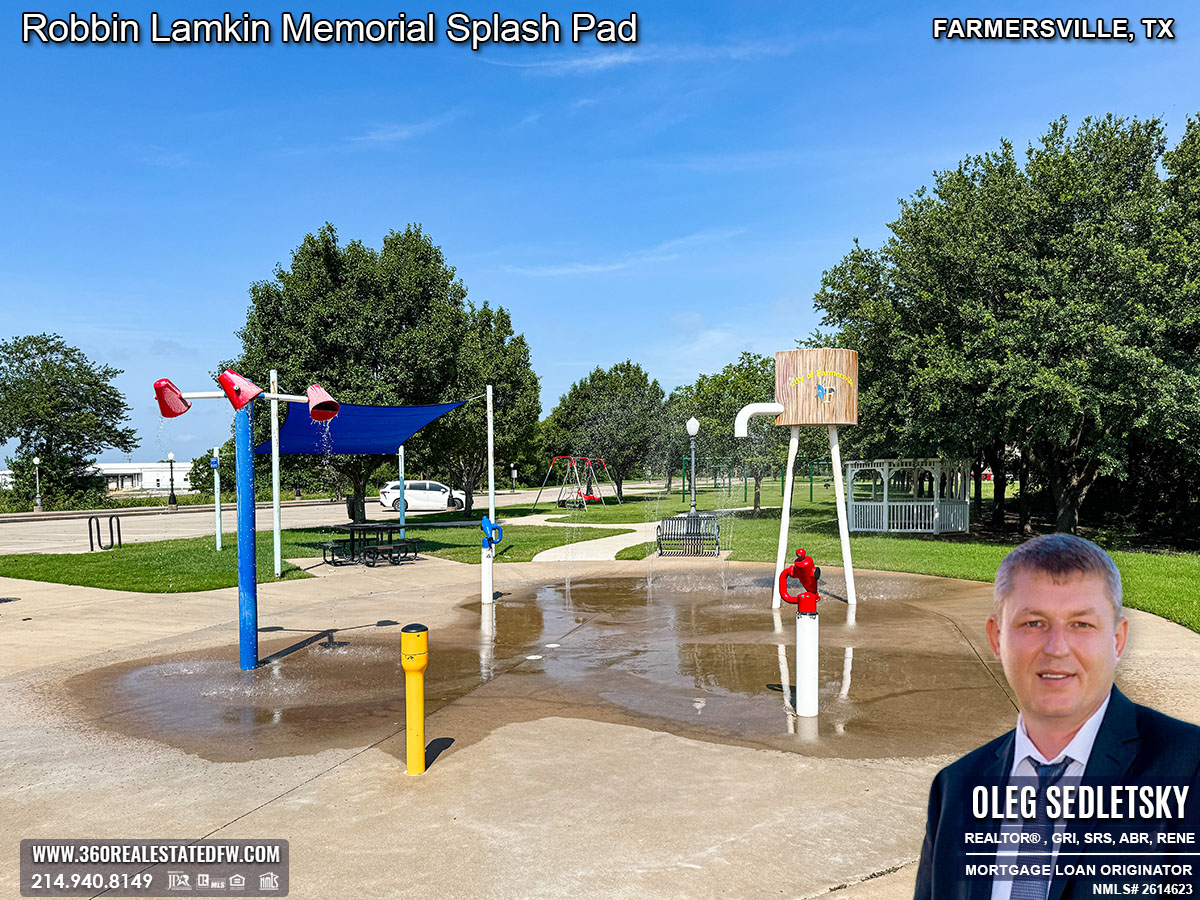
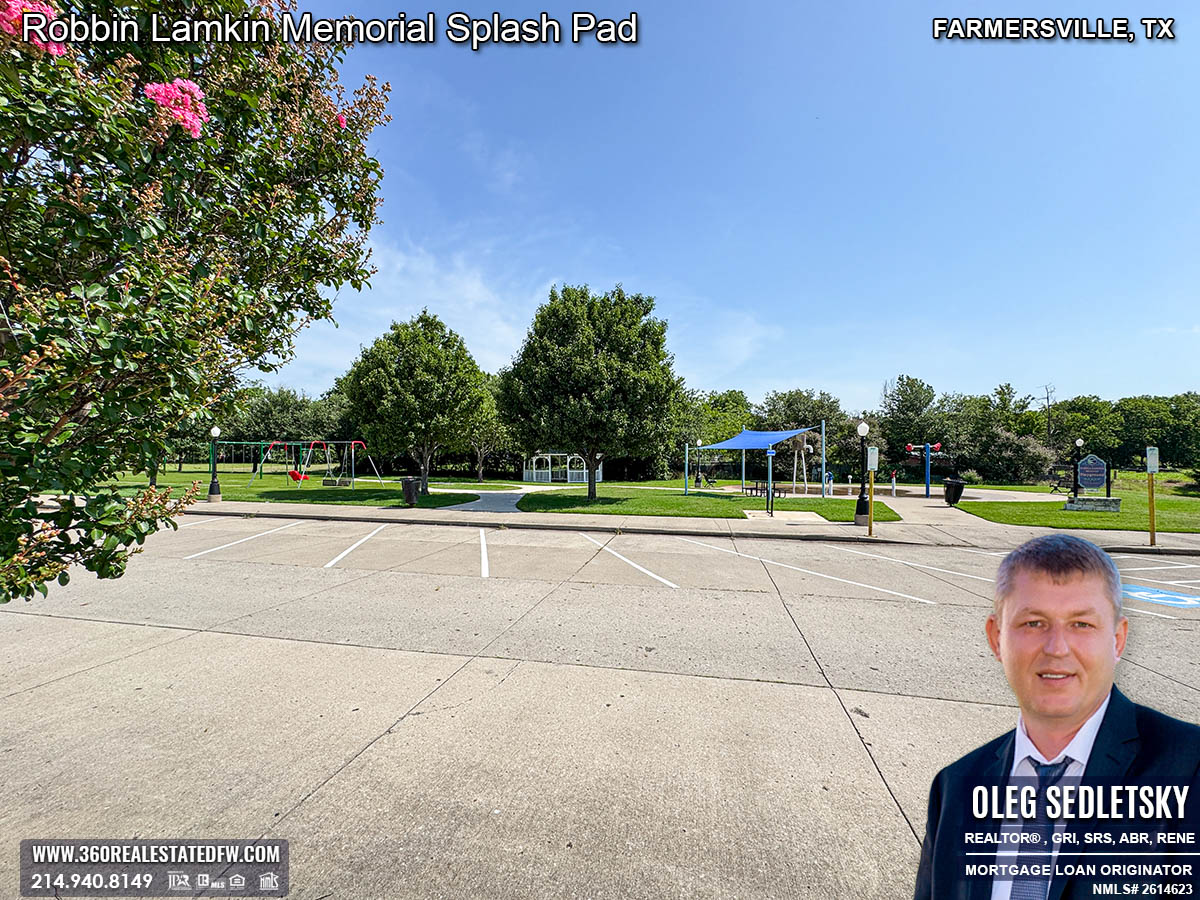
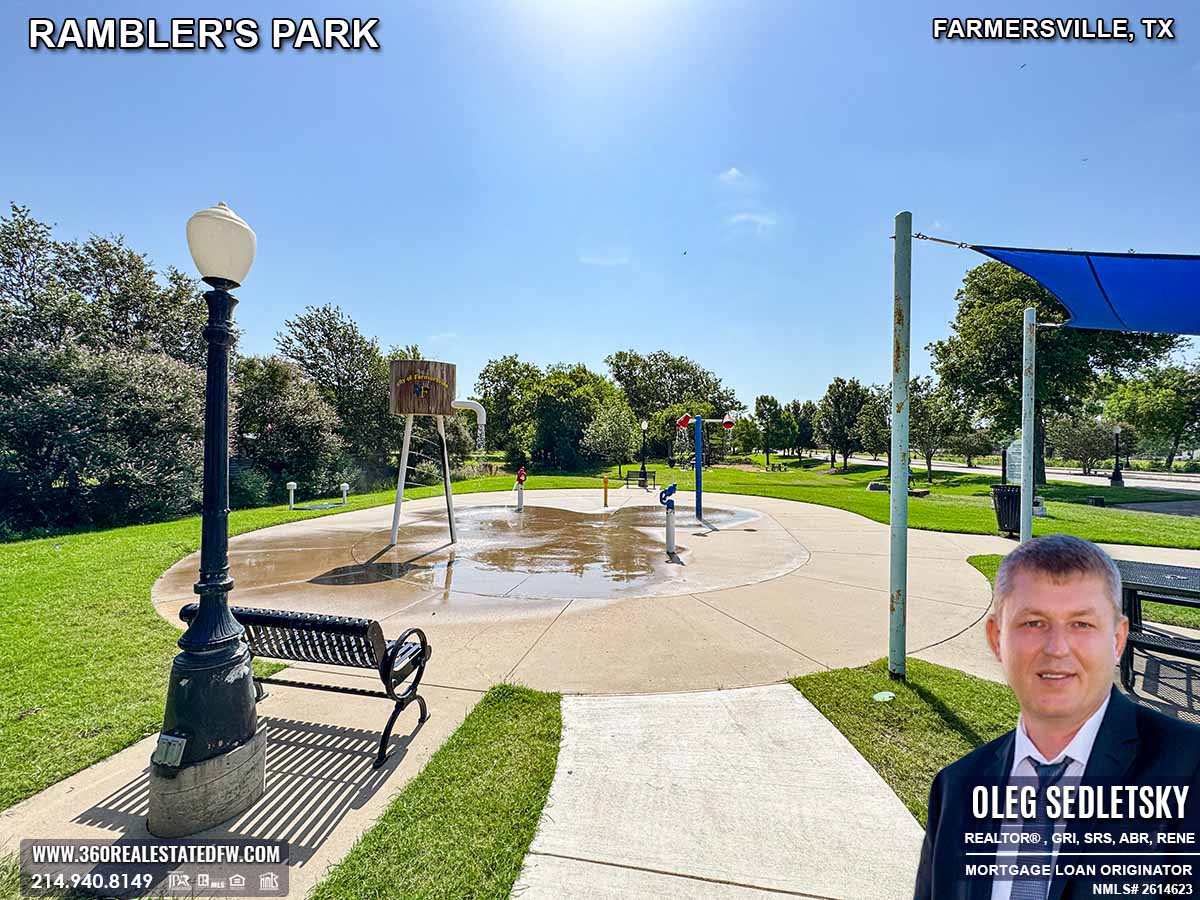
If you’re looking for a place to cool off, have some fun, and create unforgettable memories with your family in Farmersville, Texas, Robbin Lamkin Memorial Splash Pad is just the spot. This feature-packed water play area is perfect for families, offering not only hours of entertainment for the kids but also amenities that ensure parents can enjoy the day with ease. Nestled in Rambler’s Park, this splash pad is more than just a place to get wet—it’s an experience designed to bring joy and laughter to kids of all ages.
Below is everything you need to know about making the most of your visit to the splash pad.
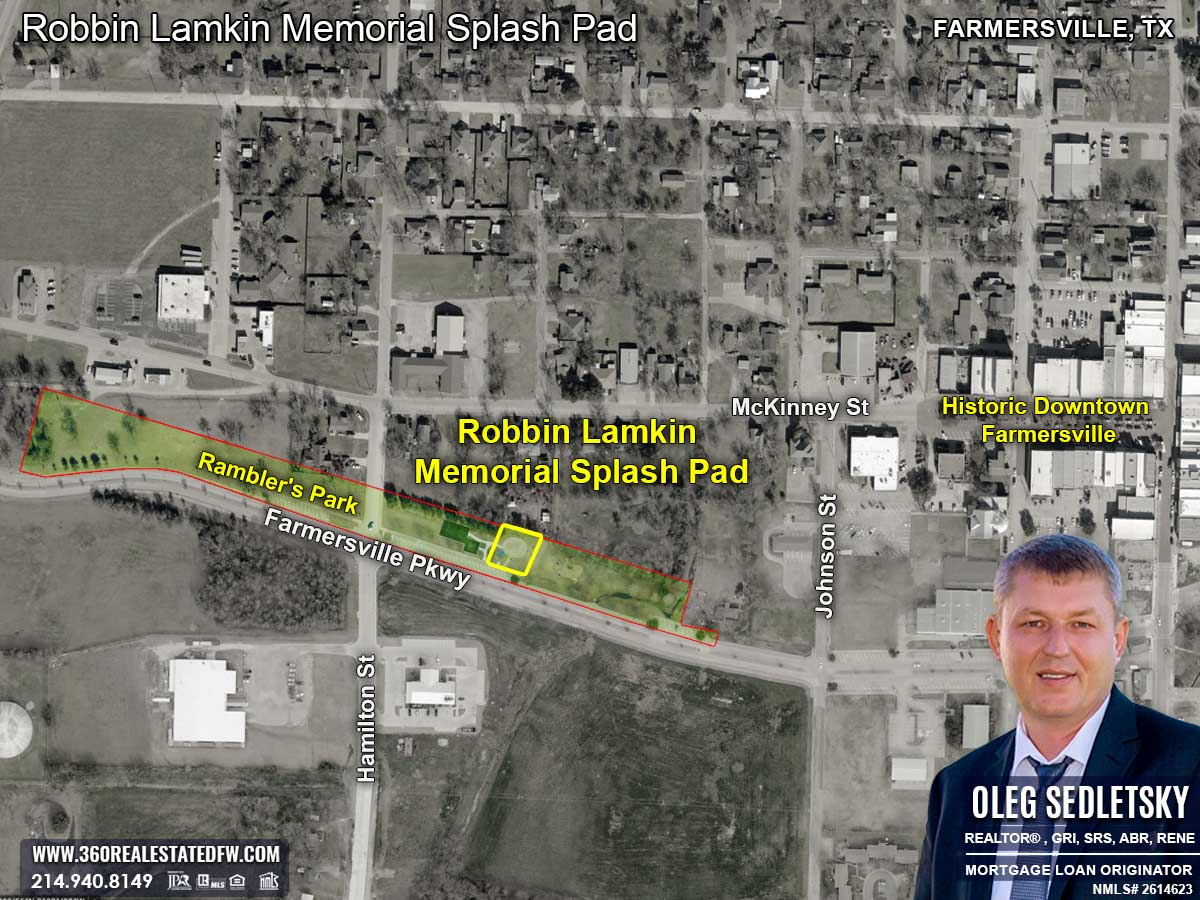
Where the Robbin Lamkin Memorial Splash Pad is located
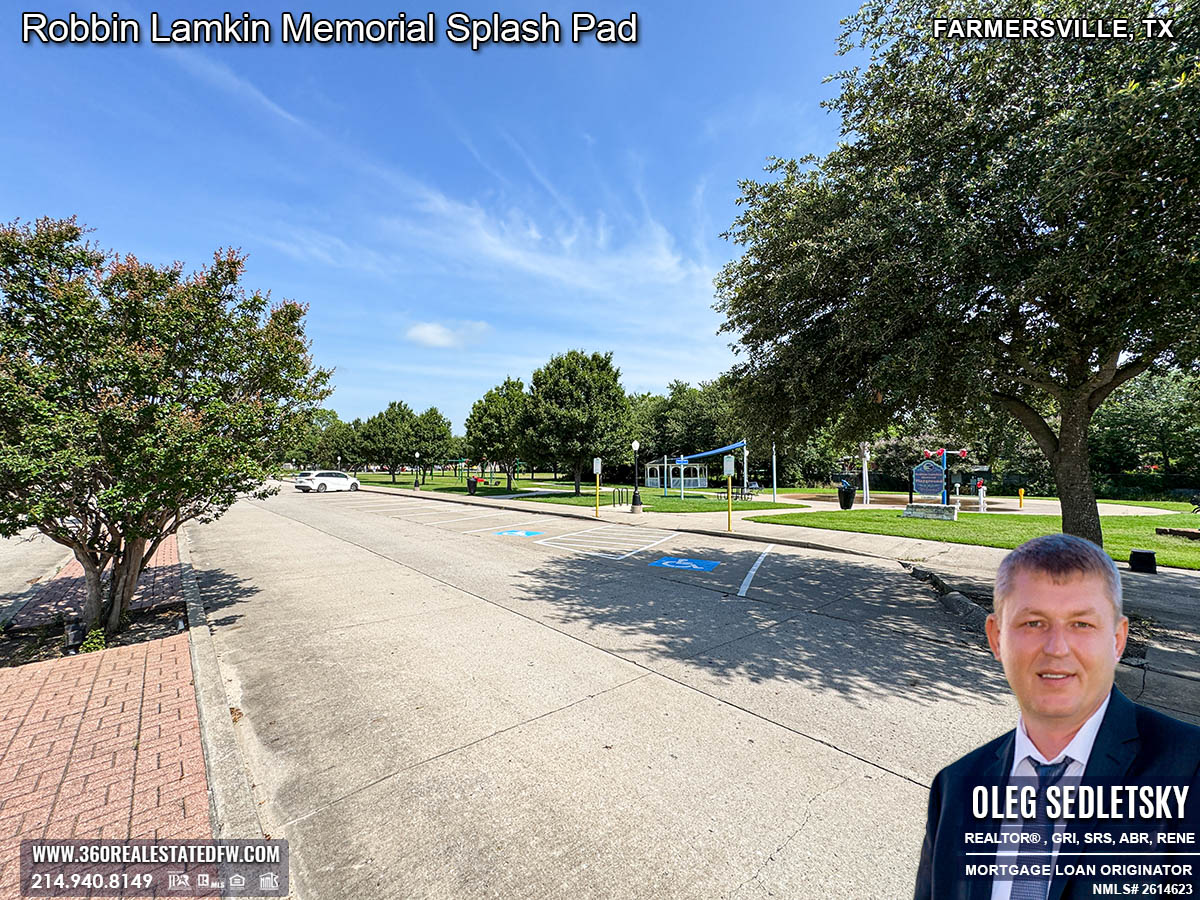
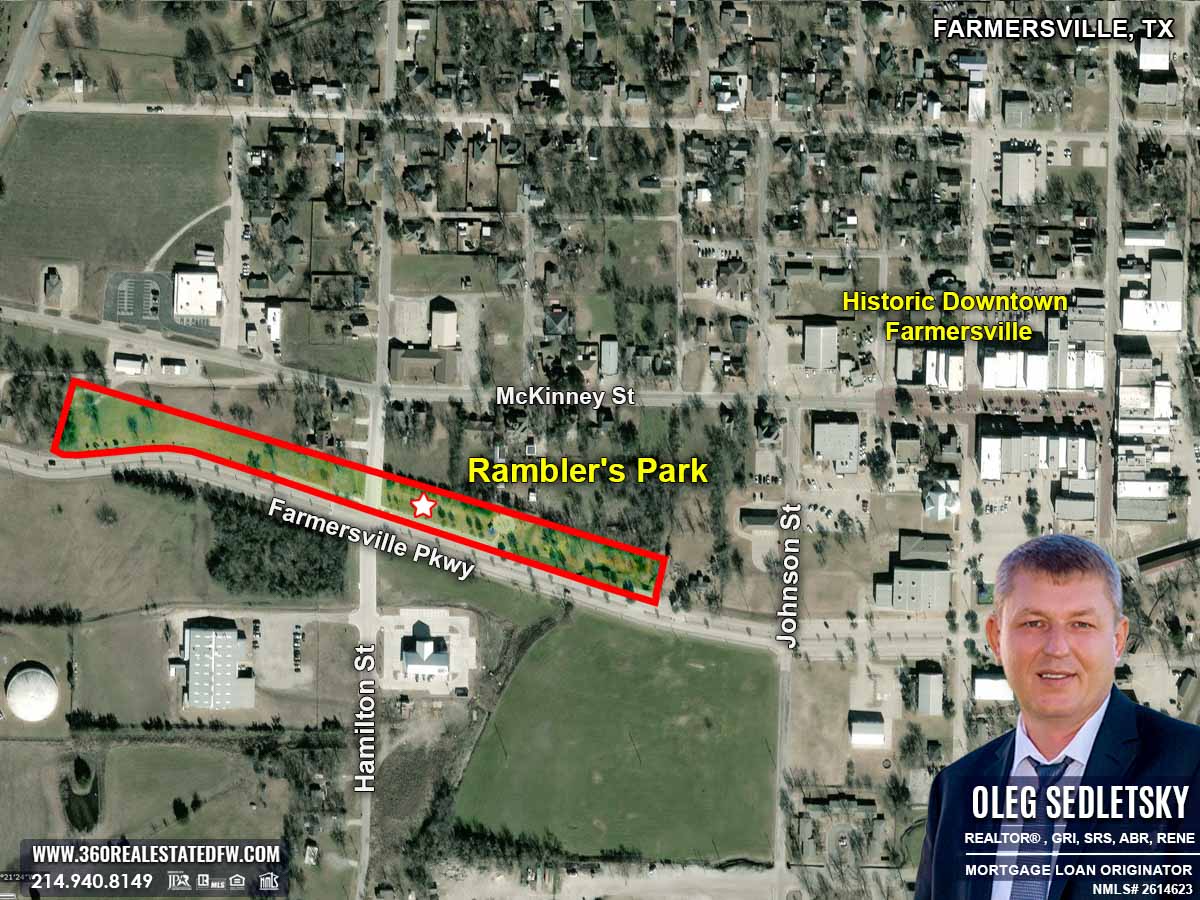
Looking for the Robbin Lamkin Memorial Splash Pad? It’s right in Rambler’s Park and super easy to find! Just type the address into your GPS, and you’ll be there in no time.
Address: 424-798 Farmersville Pkwy, Farmersville, TX 75442
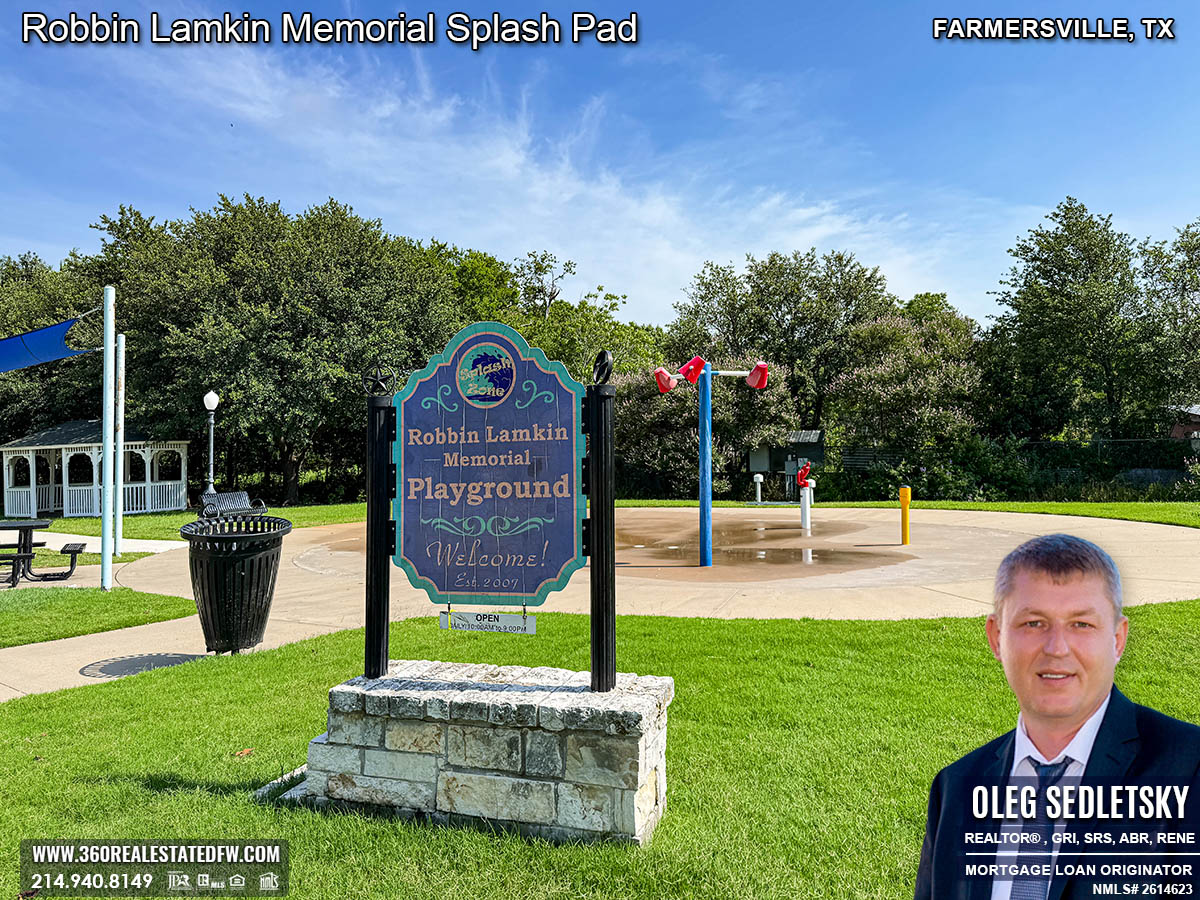
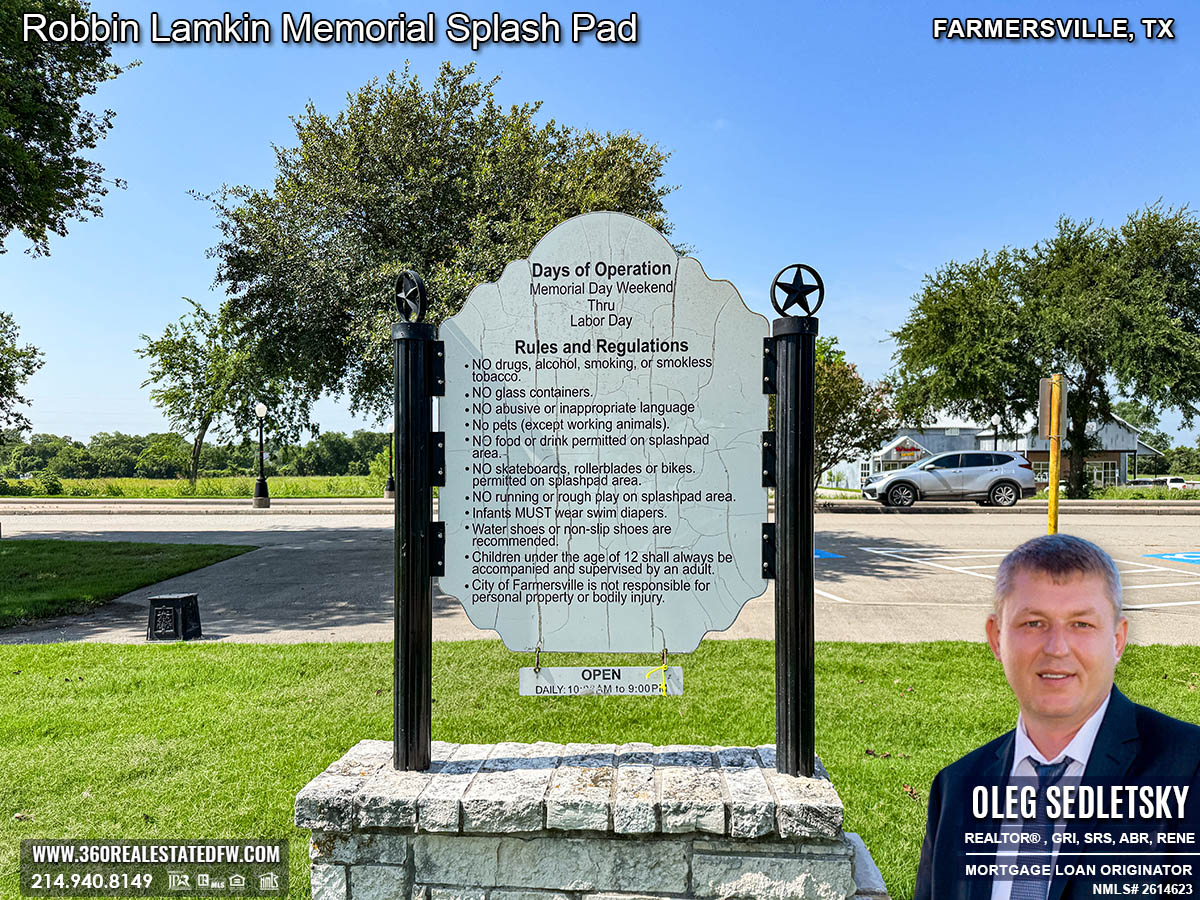
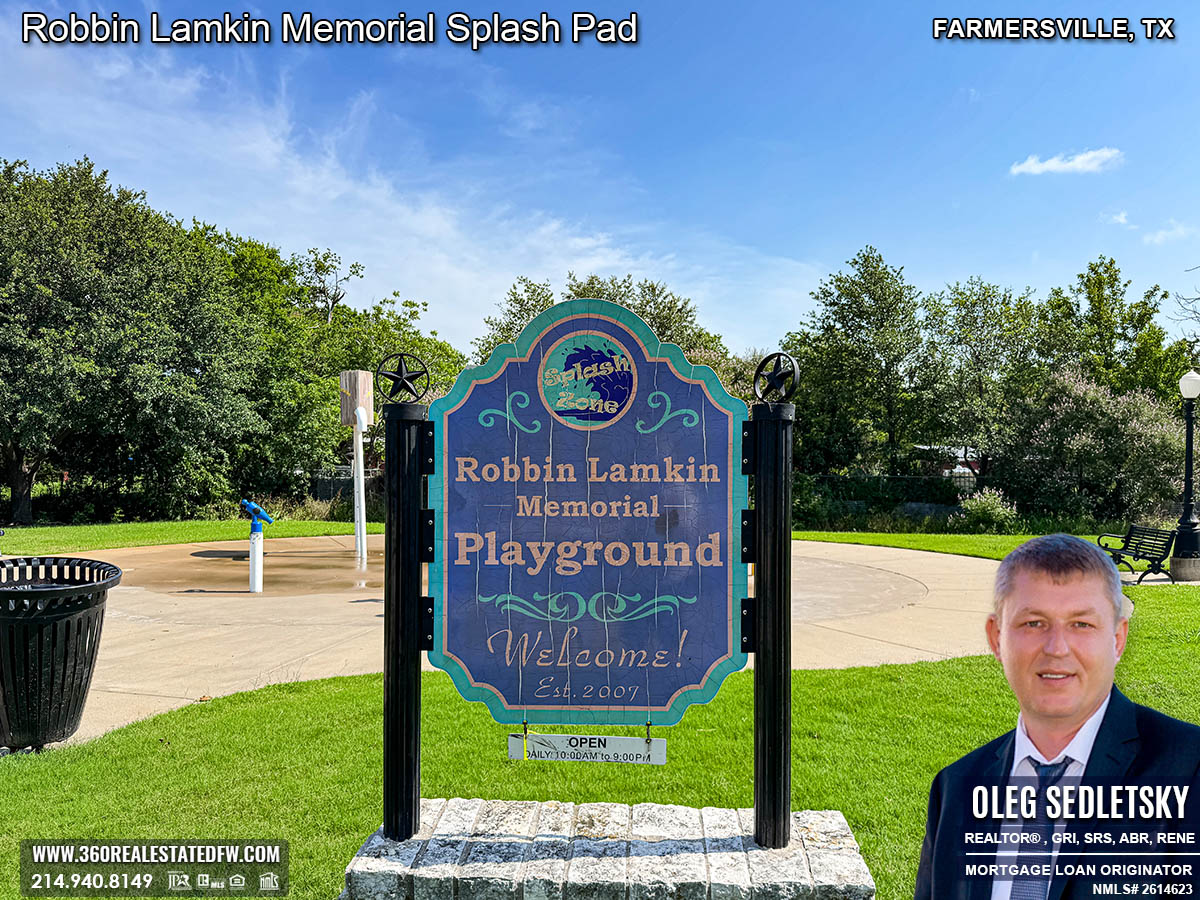
Robbin Lamkin Memorial Splash Pad Hours:
Open daily from 10:00 AM to 9:00 PM, starting Memorial Day Weekend through Labor Day.
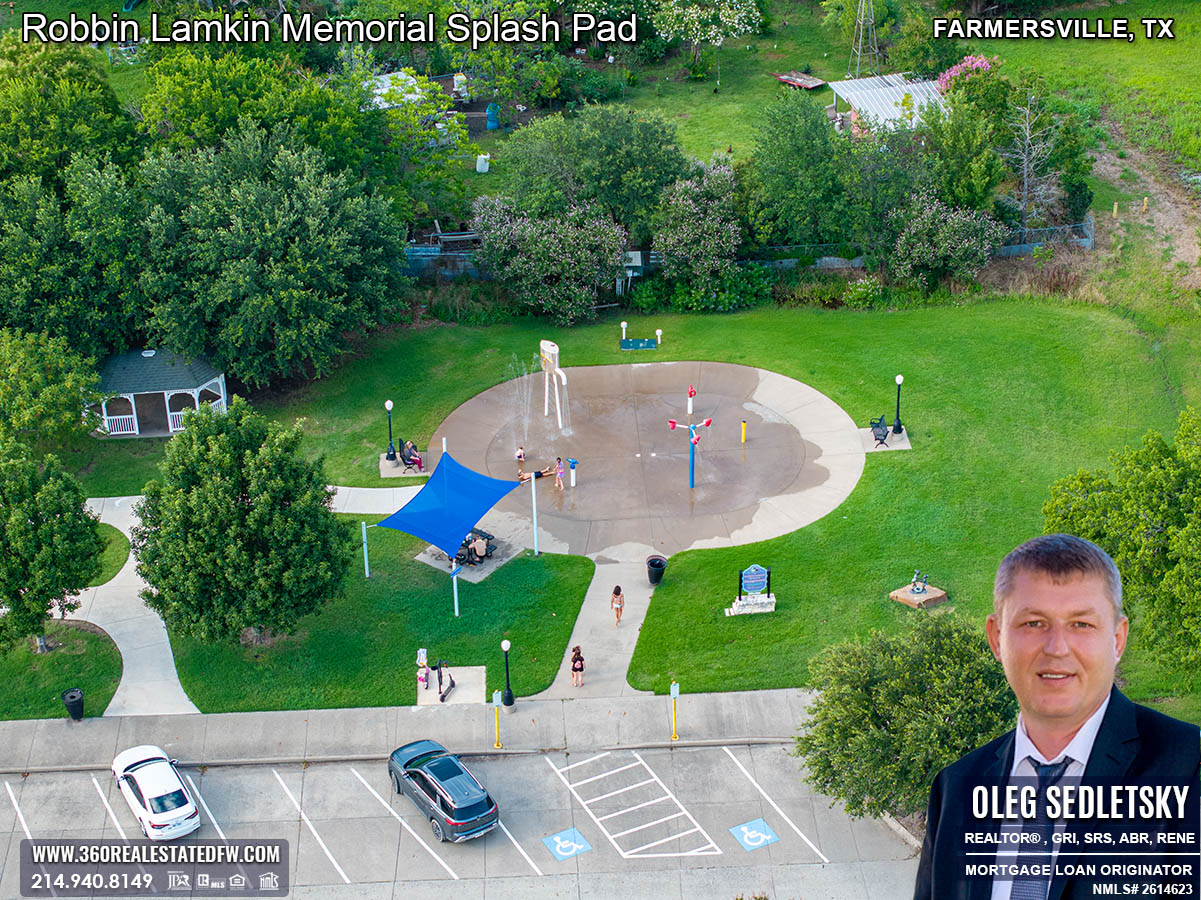
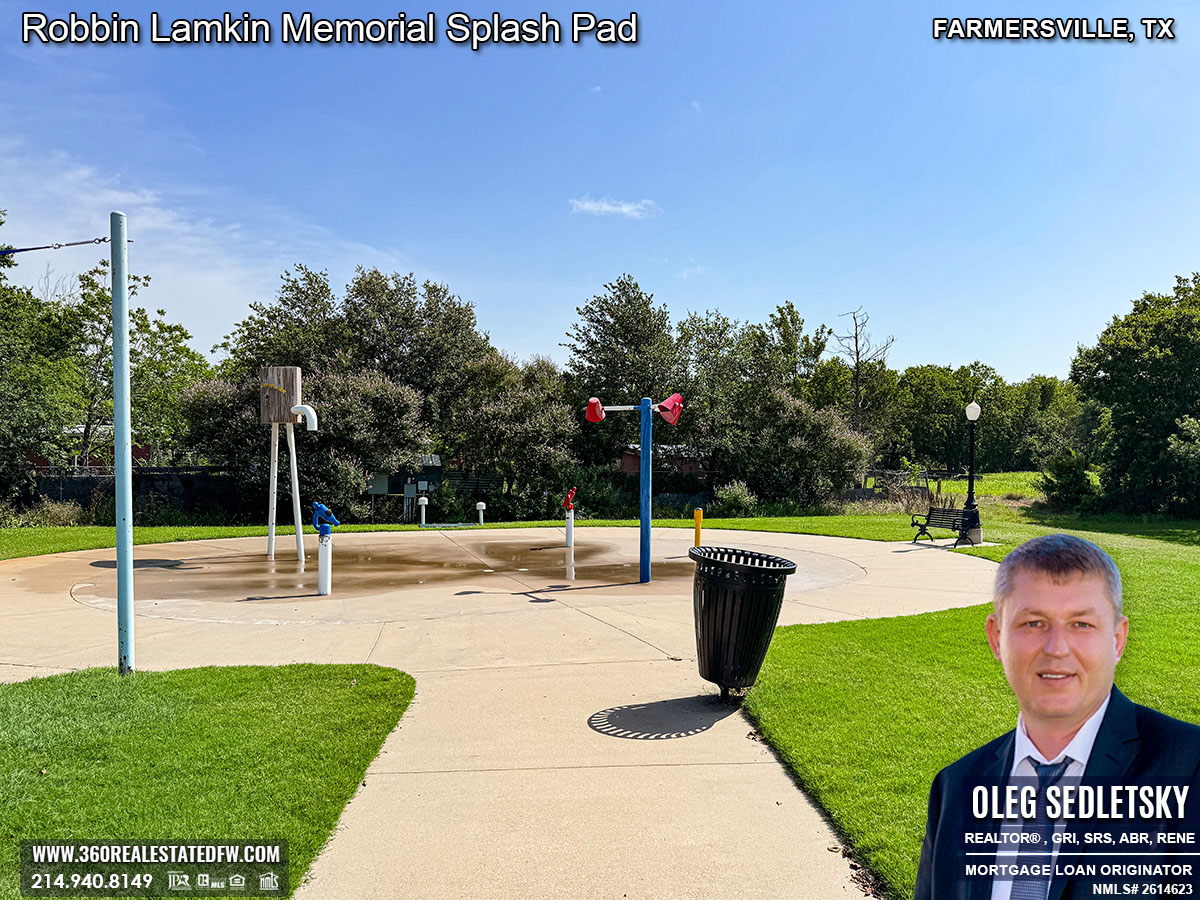
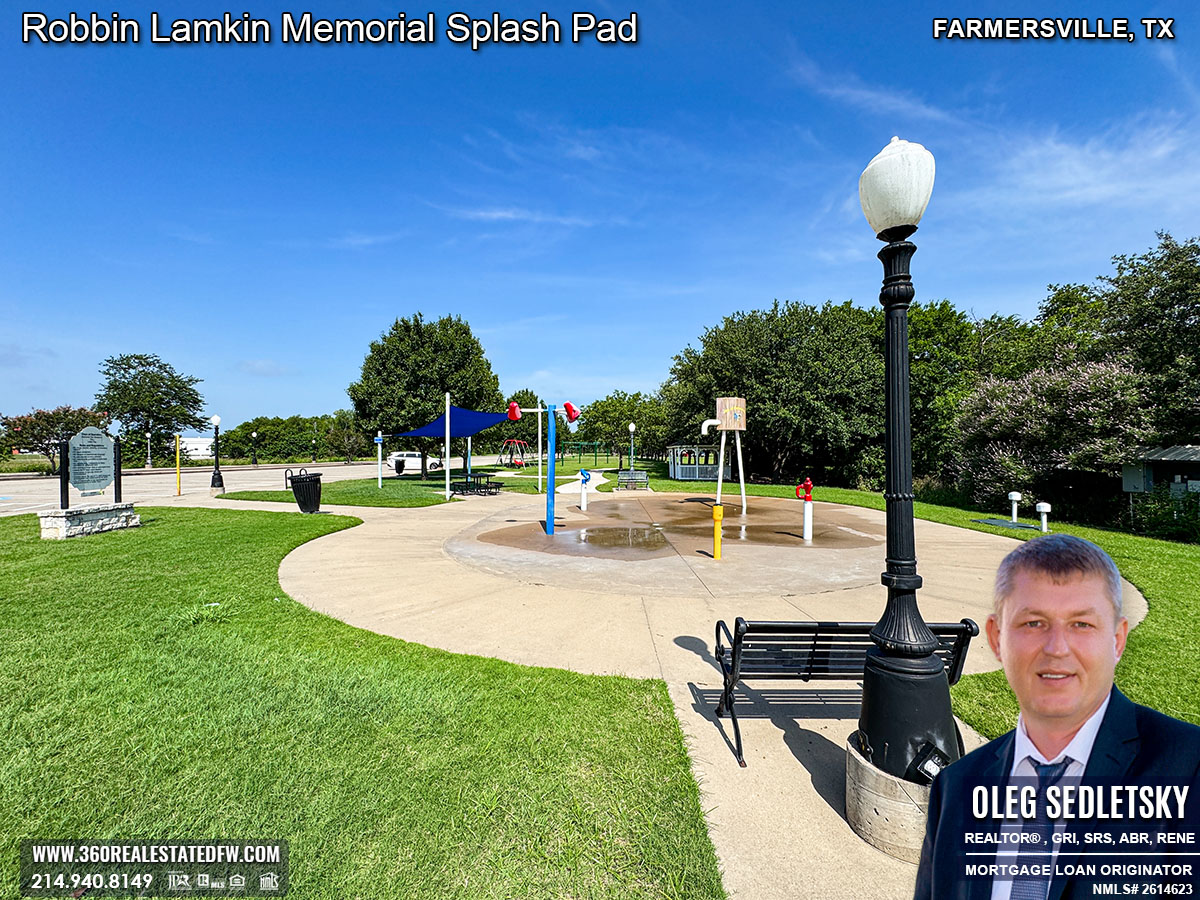
Robbin Lamkin Memorial Splash Pad: An Oasis of Water Fun
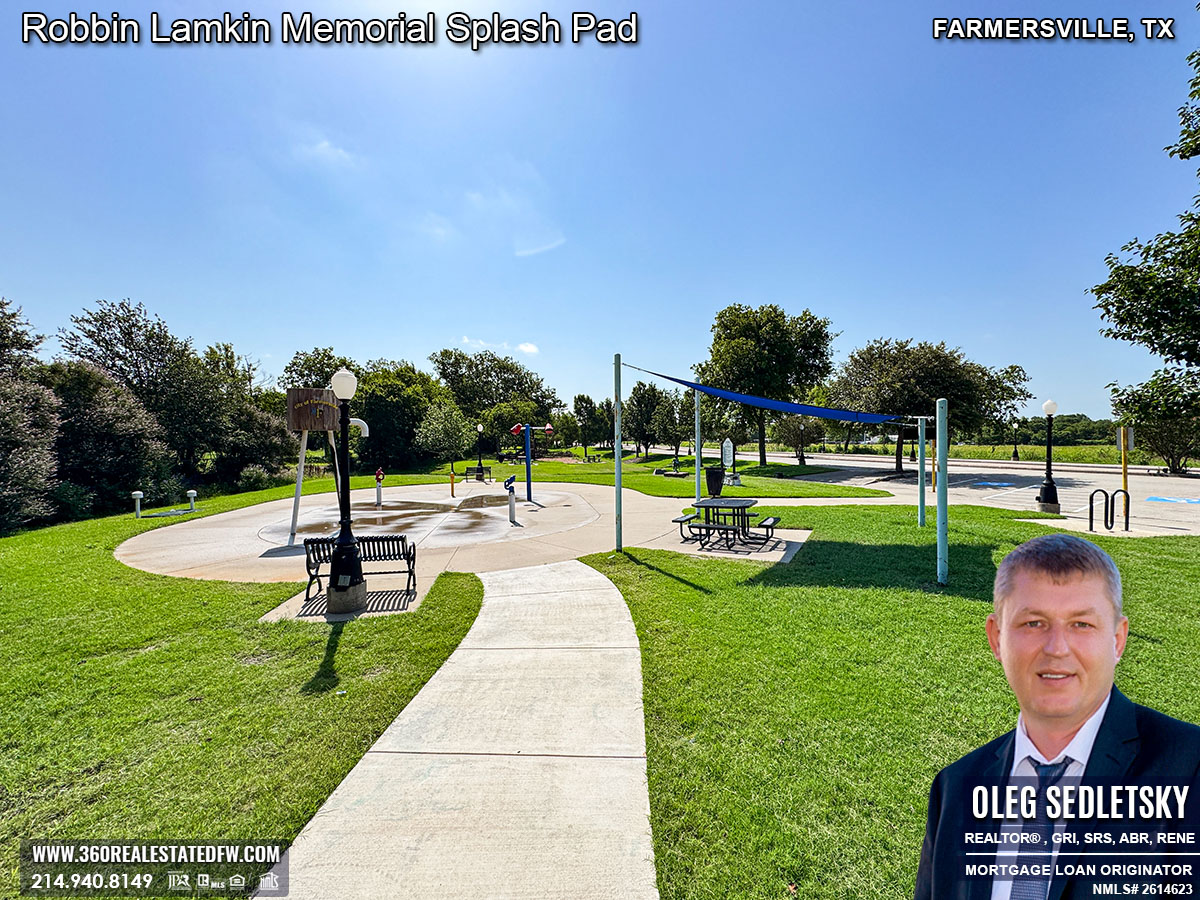
The splash pad is the shining star of the park, thoughtfully designed to keep kids entertained and engaged. Its interactive water features are what set it apart, turning a simple day outdoors into an adventure the little ones will absolutely love.
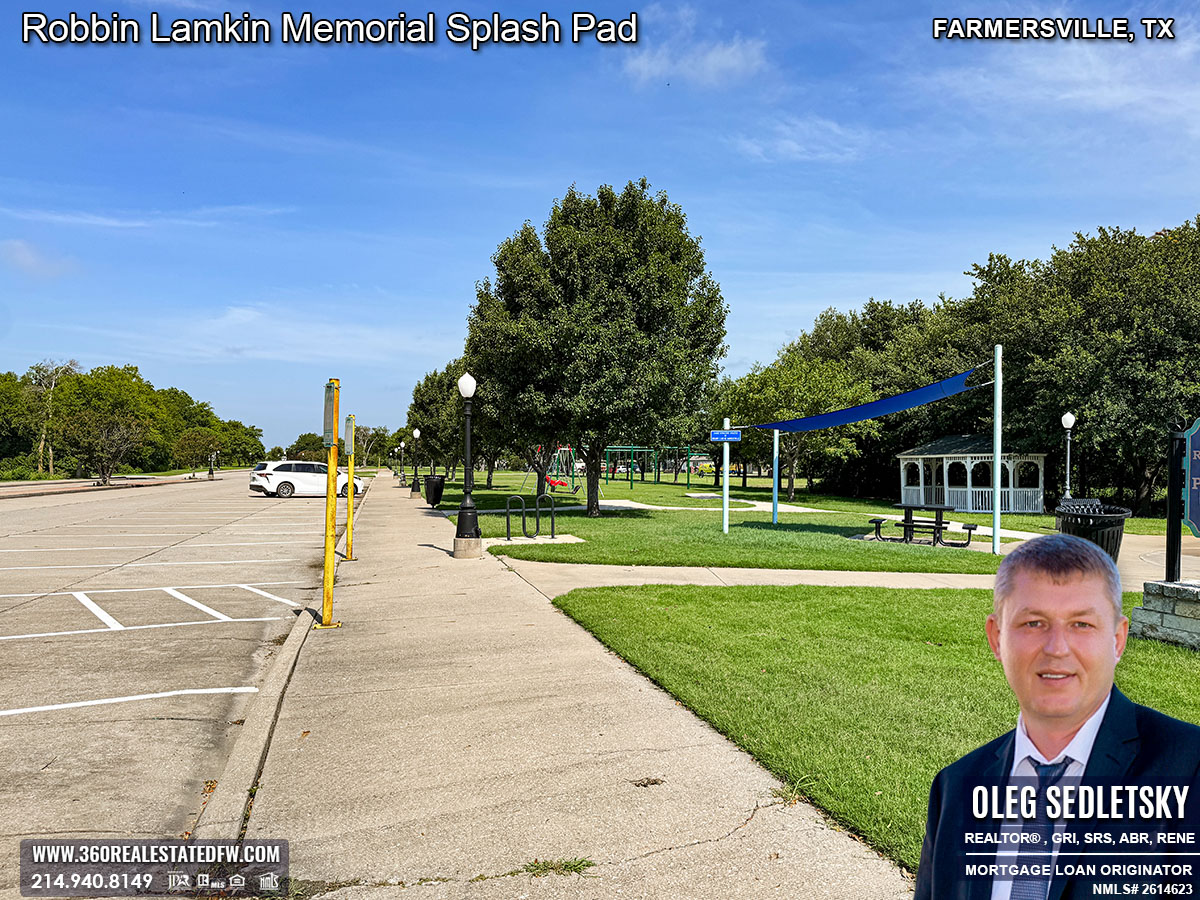
Robbin Lamkin Memorial Splash Pad Amenities: Seating Benches
Around the splash pad, you’ll find plenty of sitting benches. These spots are perfect for parents to relax, take in the sights, and keep a watchful eye on their little ones.
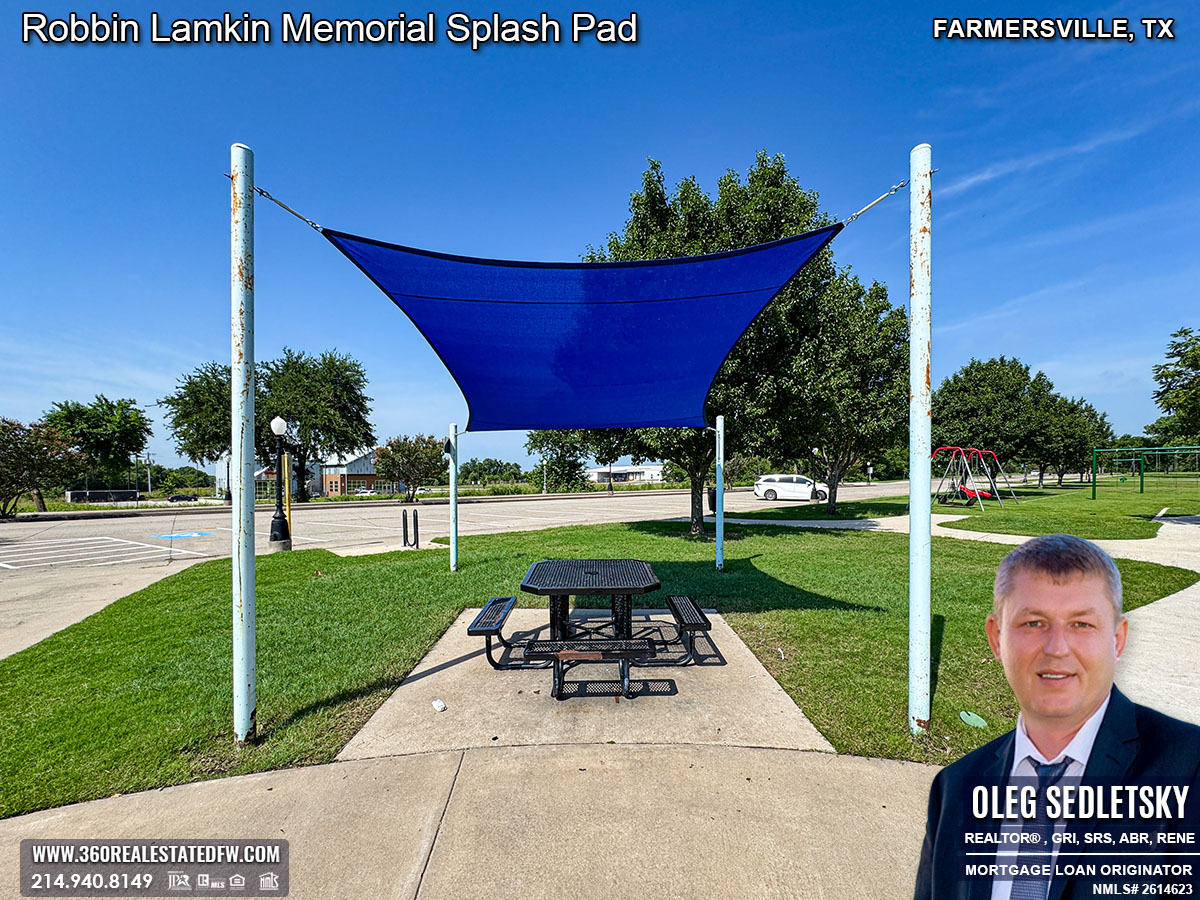
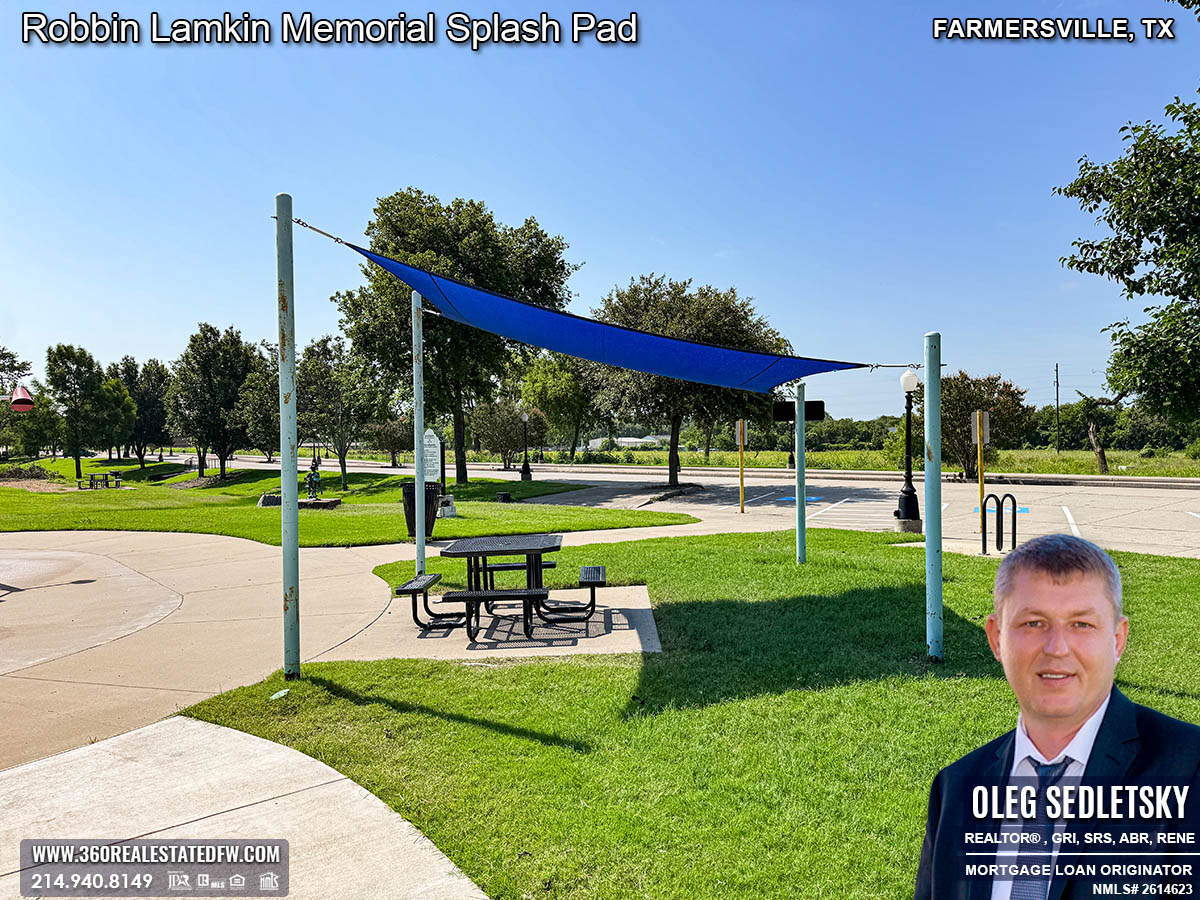
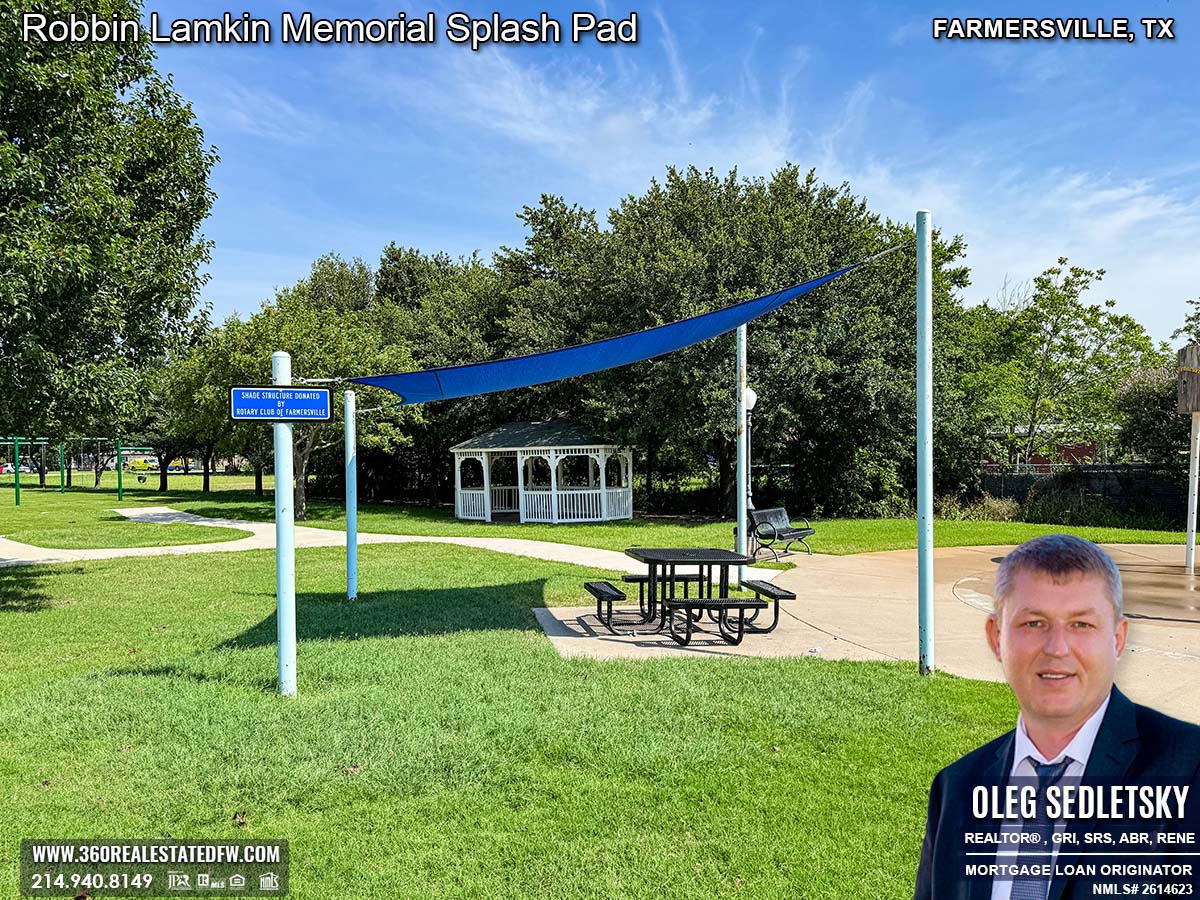
Robbin Lamkin Memorial Splash Pad Amenities: Shaded Picnic Table
Near the splash pad, there’s also a shaded picnic table. This makes it easy to take a break, enjoy a snack, or hydrate between rounds of splashing fun. You can stay cool in the shade while feeling reassured by the splash pad’s open layout, which allows for great visibility.
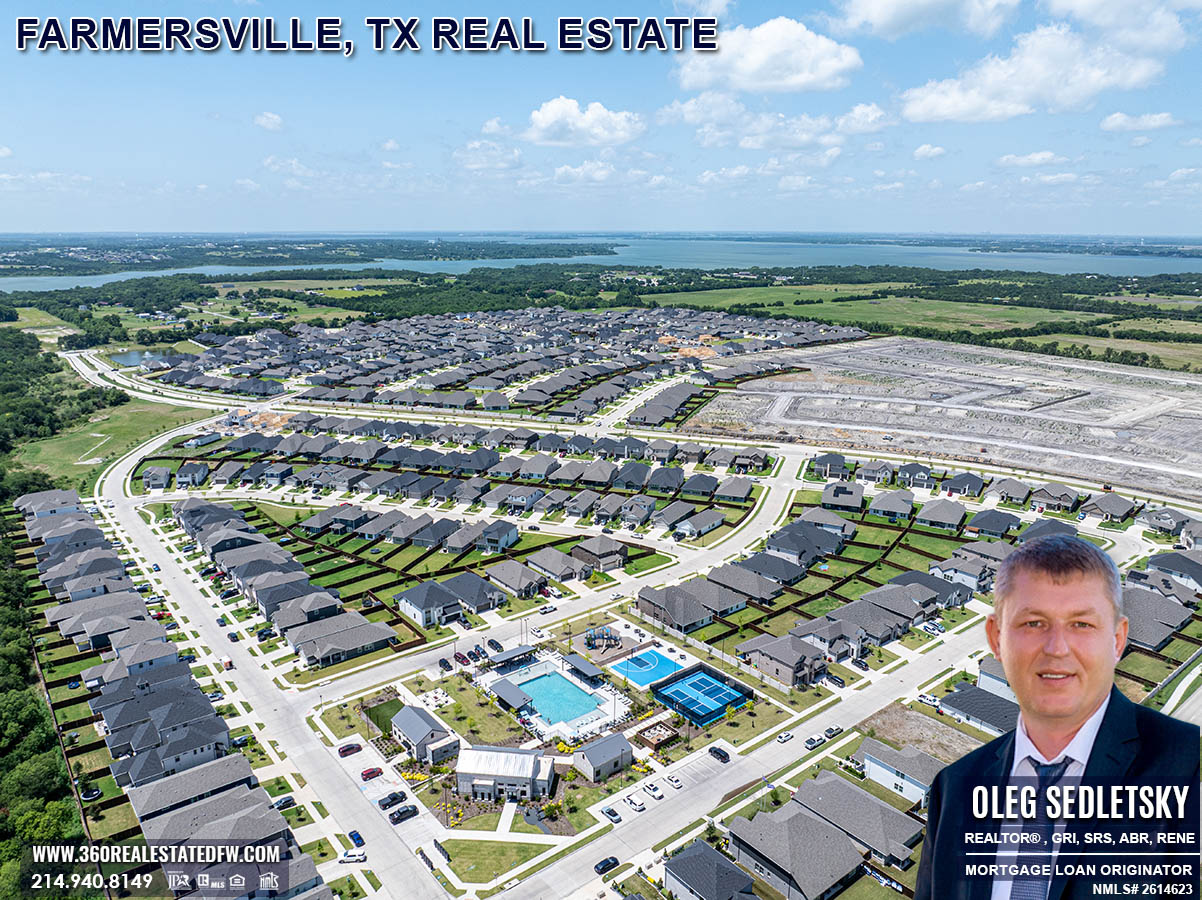
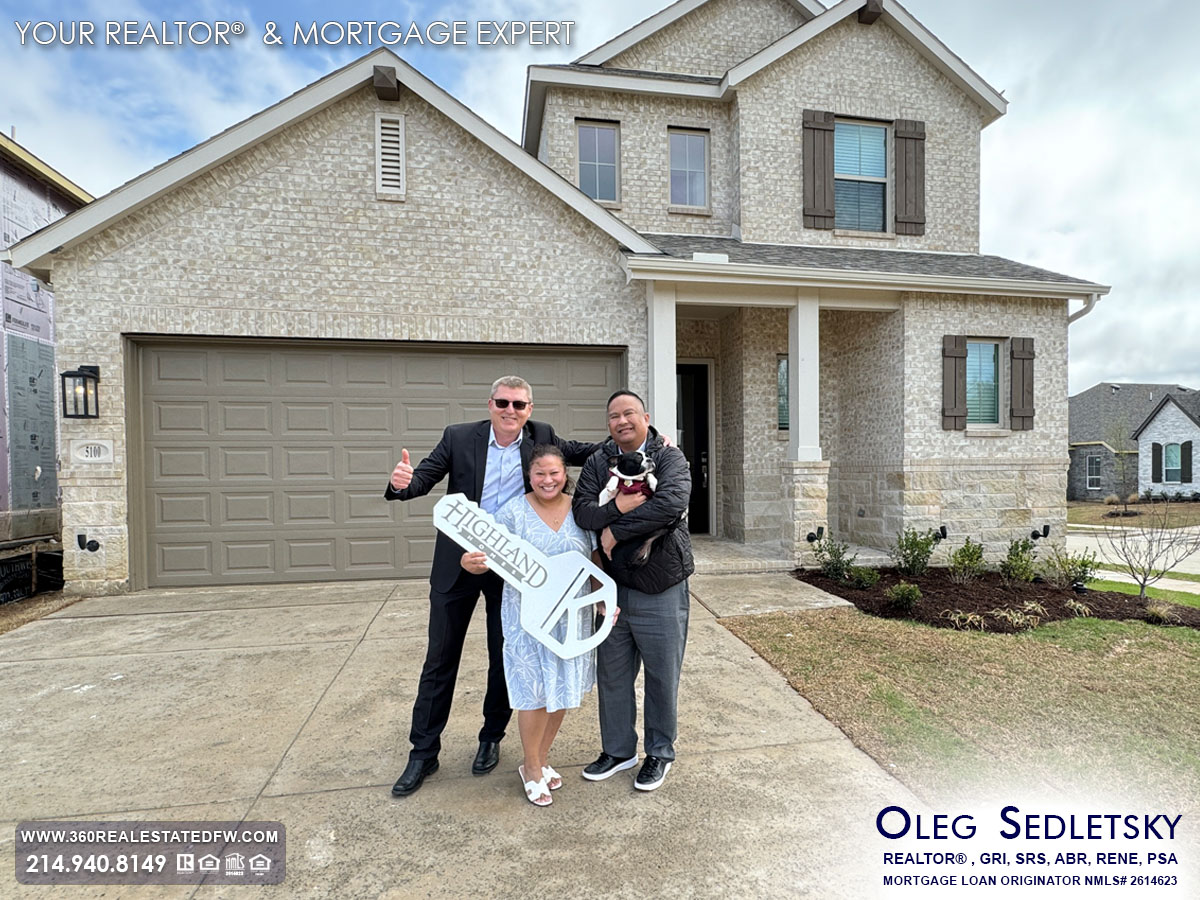
Move-In-Ready Homes and Great Living in Farmersville, TX!
Farmersville, TX is such a gem! You’ll find tons of move-in-ready homes here, whether you’re dreaming of a charming older house or a sparkling new build. Plus, the area is full of beautiful parks and fun places to explore, making it a fantastic spot to live and enjoy every moment.
I’m your local Realtor and Mortgage Expert, and I’m here to make your home-buying journey as smooth and stress-free as possible. I’m always happy to answer your questions, offer guidance, and help you find a home that feels just right for you.
Unlock Exceptional Service!
Assistance with all your real estate needs in the Dallas-Fort Worth area is just a click or call away. Reach out at 214-940-8149 or connect through the links below.
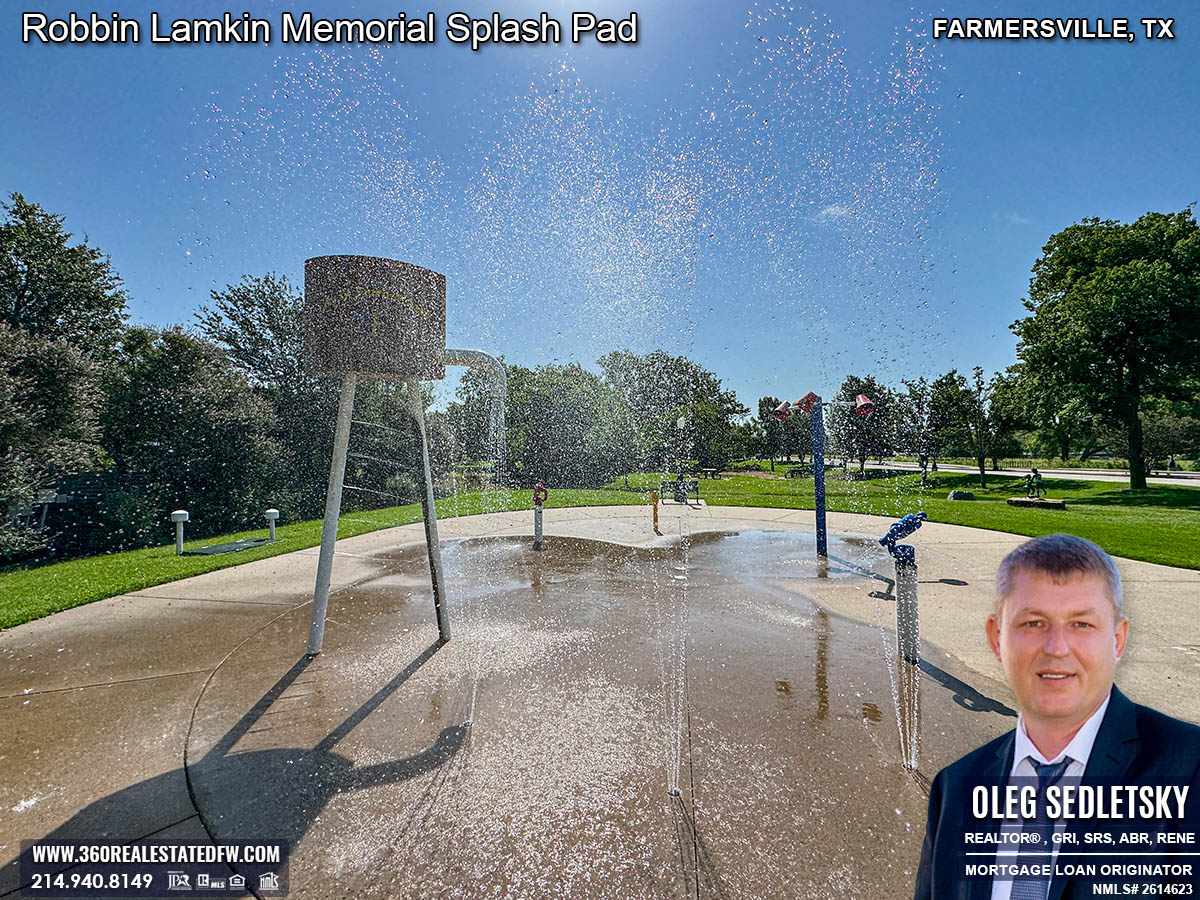
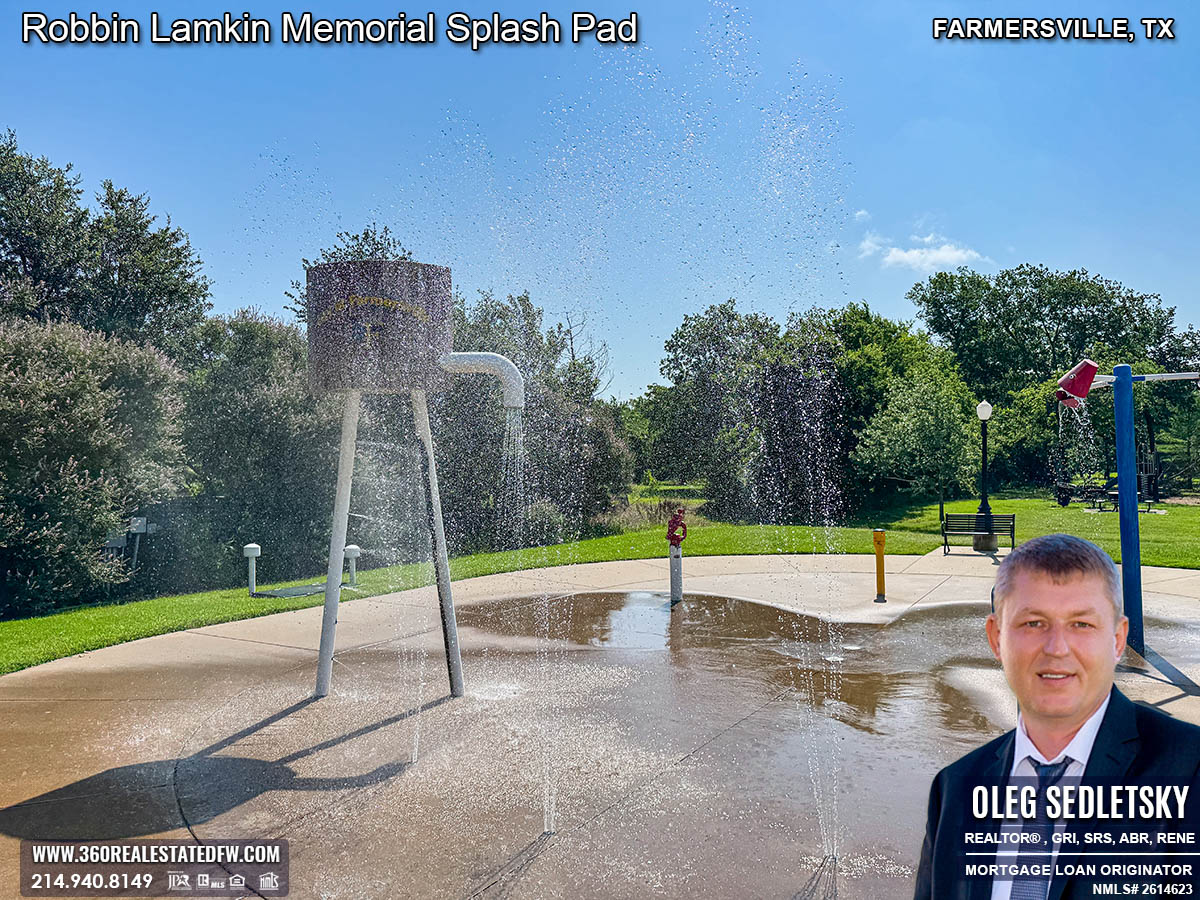
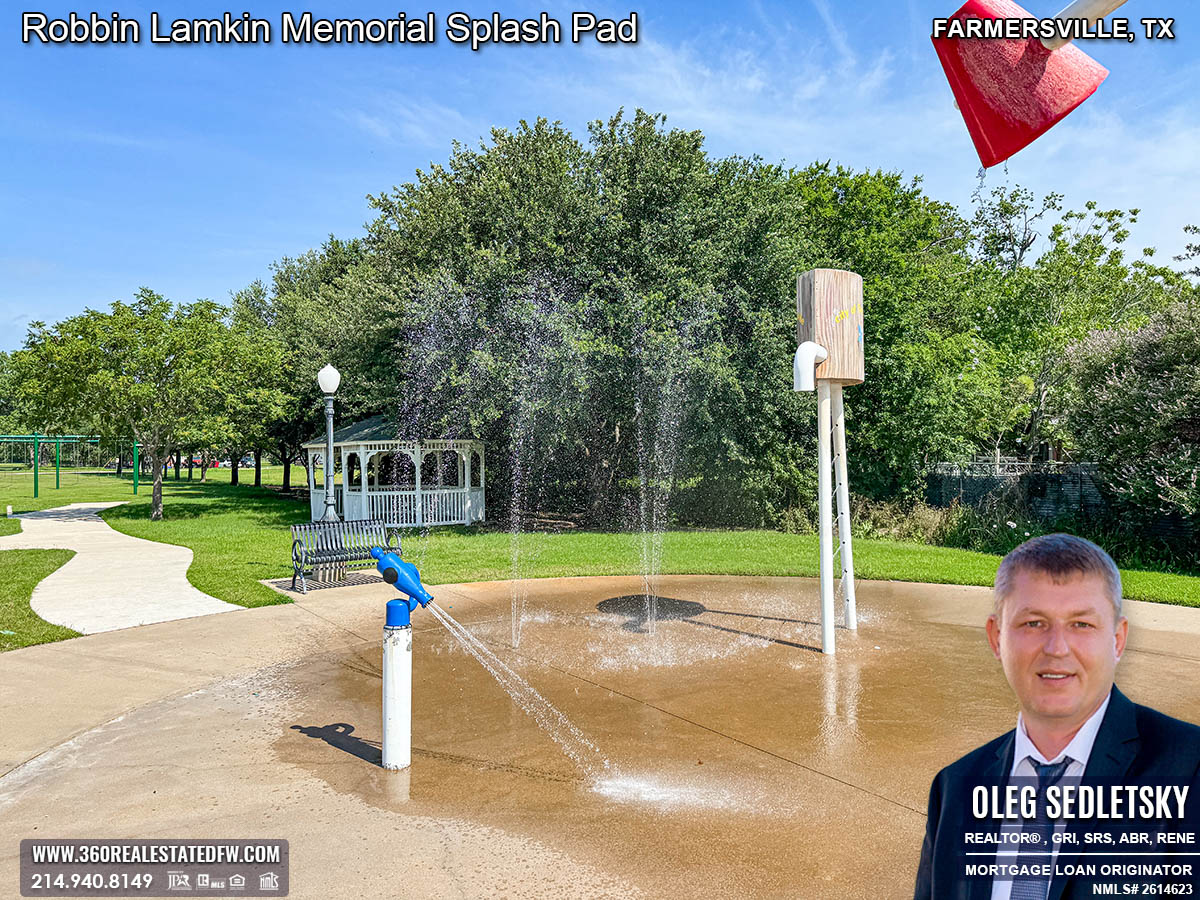
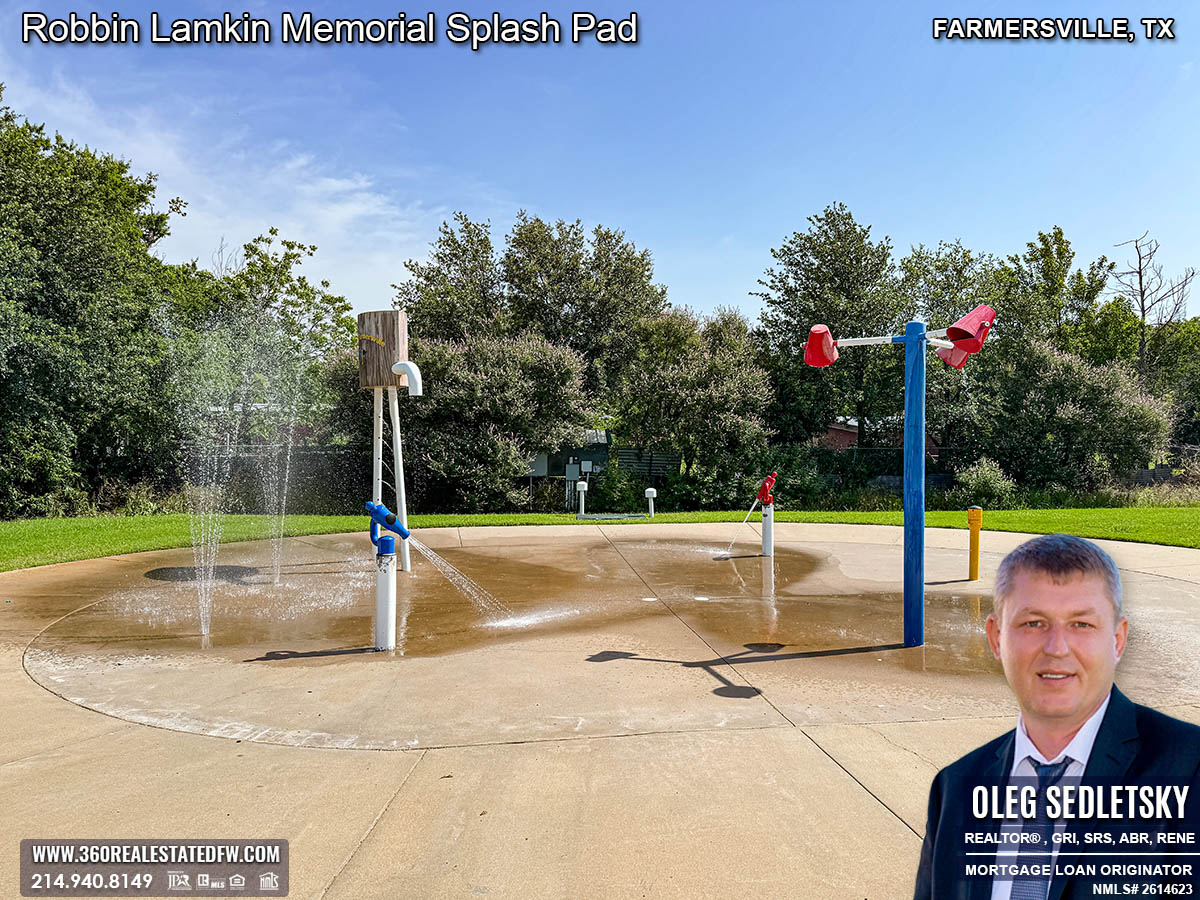
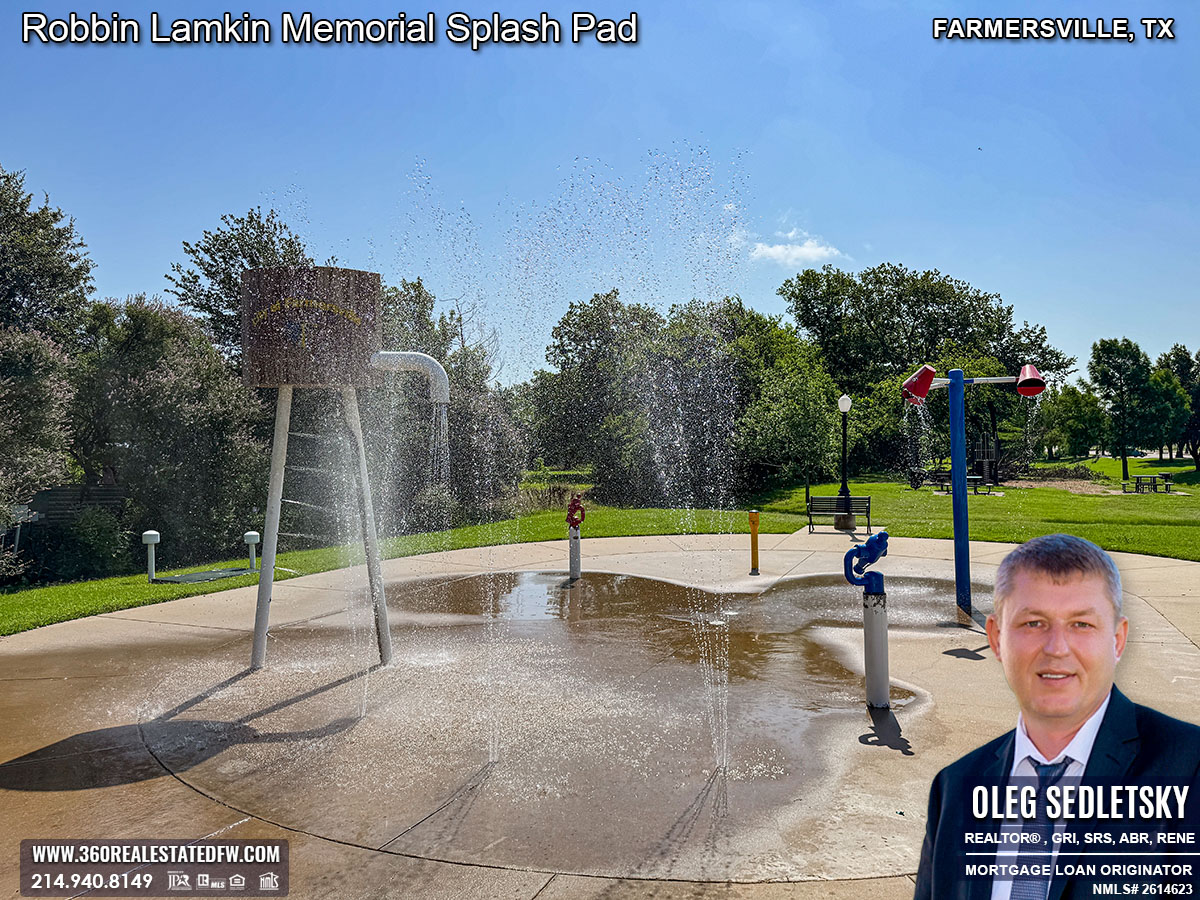
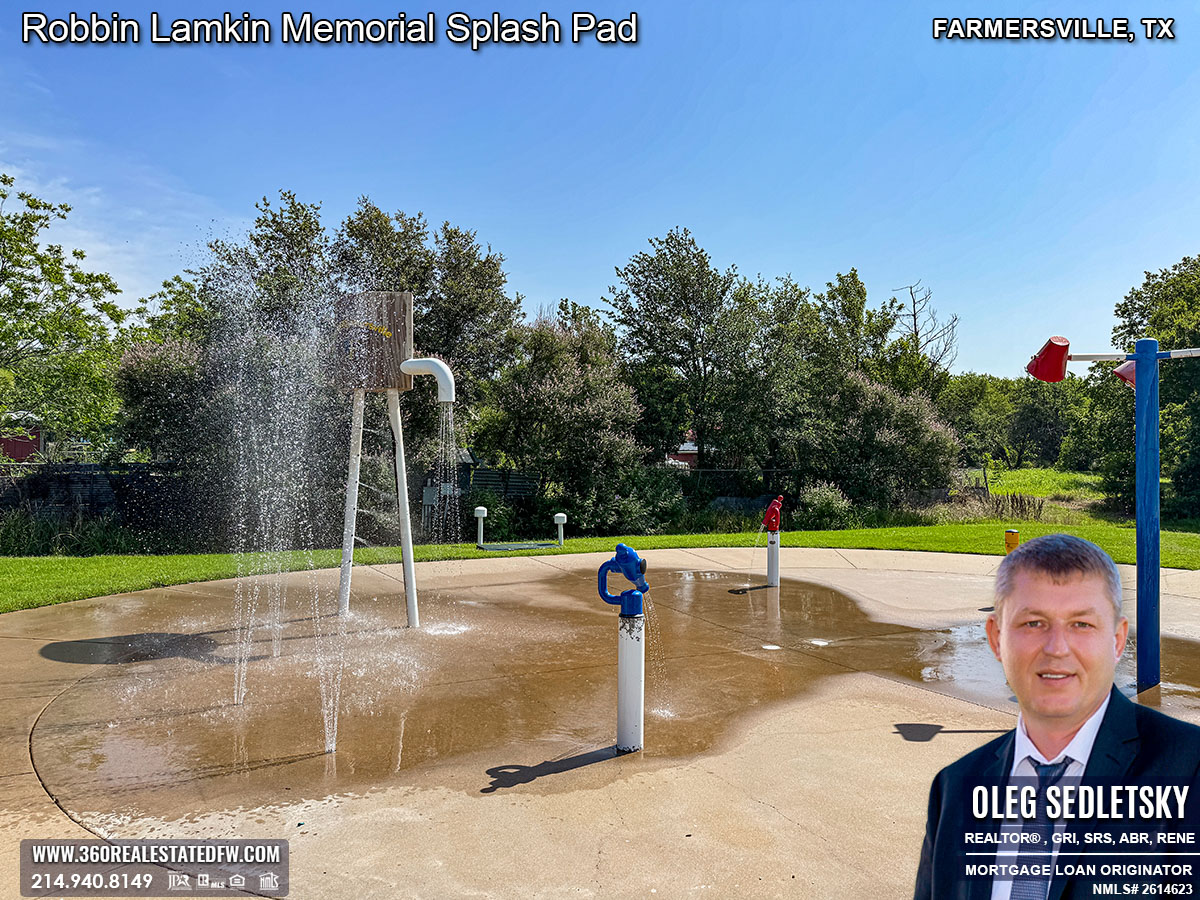
Robbin Lamkin Memorial Splash Pad Amenities: Exciting Water Features
With its dynamic water features, the splash pad becomes a thrilling, refreshing, and unforgettable adventure for kids.
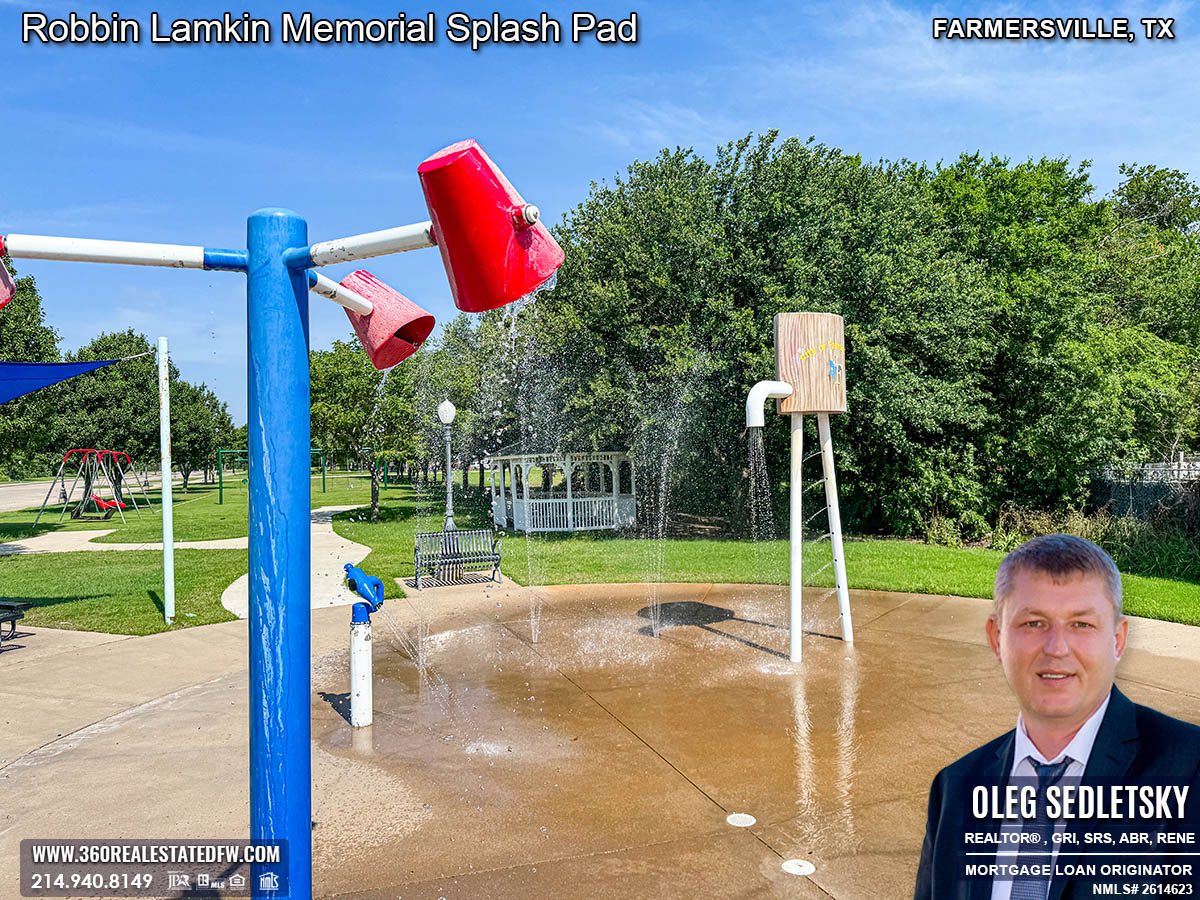
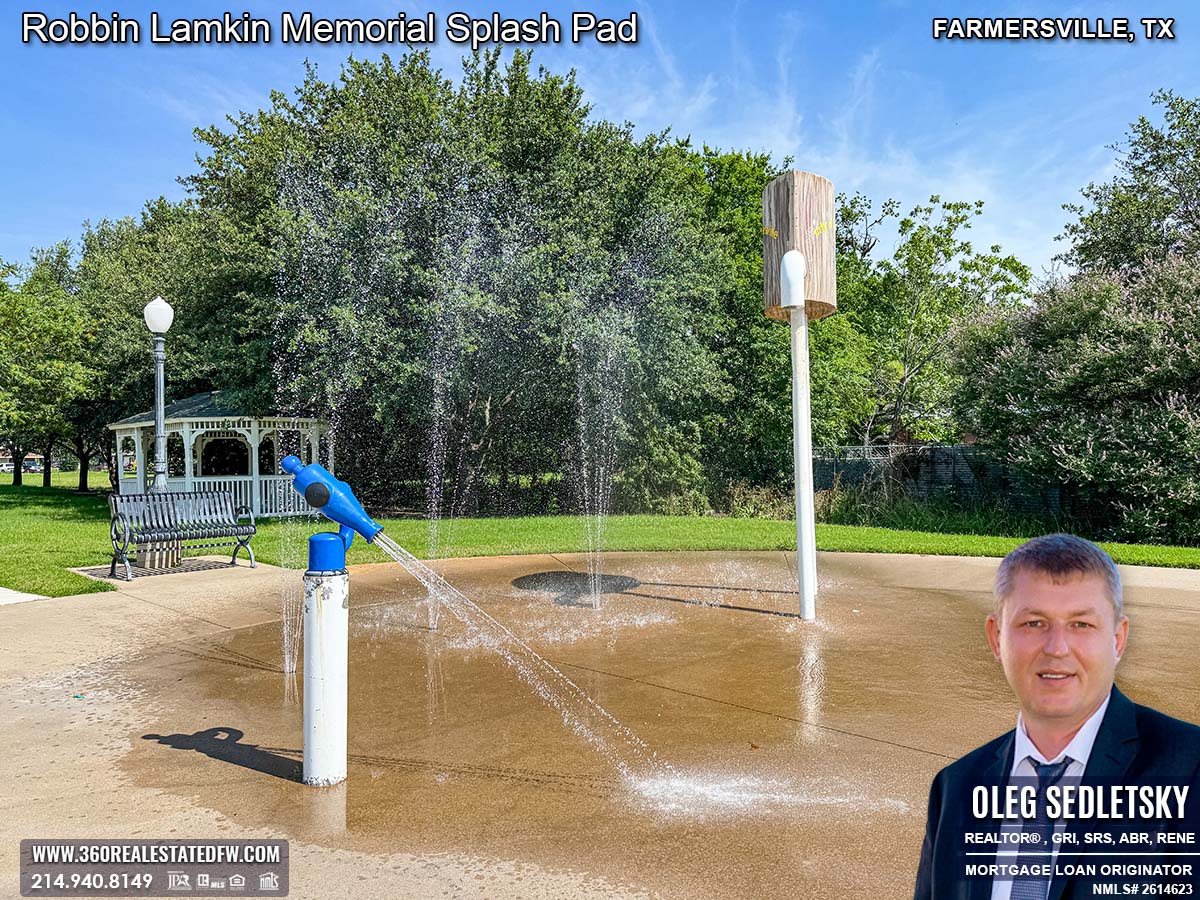
Fountains That Spark Joy
The splash pad is equipped with fountains that shoot water upwards, creating the ultimate splash effect. Whether toddlers are toddling through the gentle arch of water or older kids are running through the cool streams, laughter is guaranteed.
Exciting Dumping Buckets
Kids eagerly anticipate the big splash as they stand beneath the large dumping buckets. Every so often, these features release a refreshing cascade of water, bringing both surprise and excitement to all who dare to stand below.
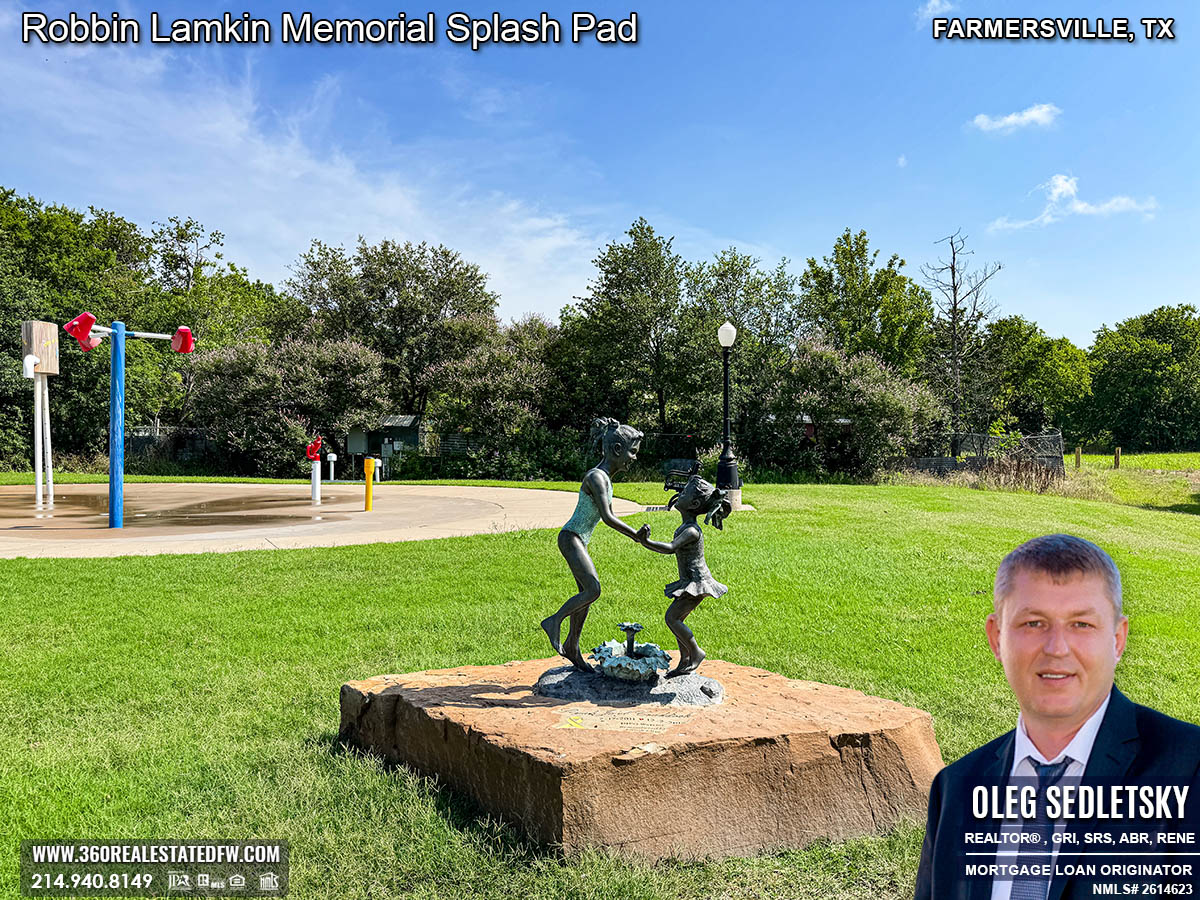
Water Cannons for Interactive Play
For the little ones who can’t sit still, the water cannons are a hit. They provide an interactive activity, letting kids aim and spray water at their friends or siblings for some good-natured fun. It’s a great way for kids to engage with each other while staying cool.
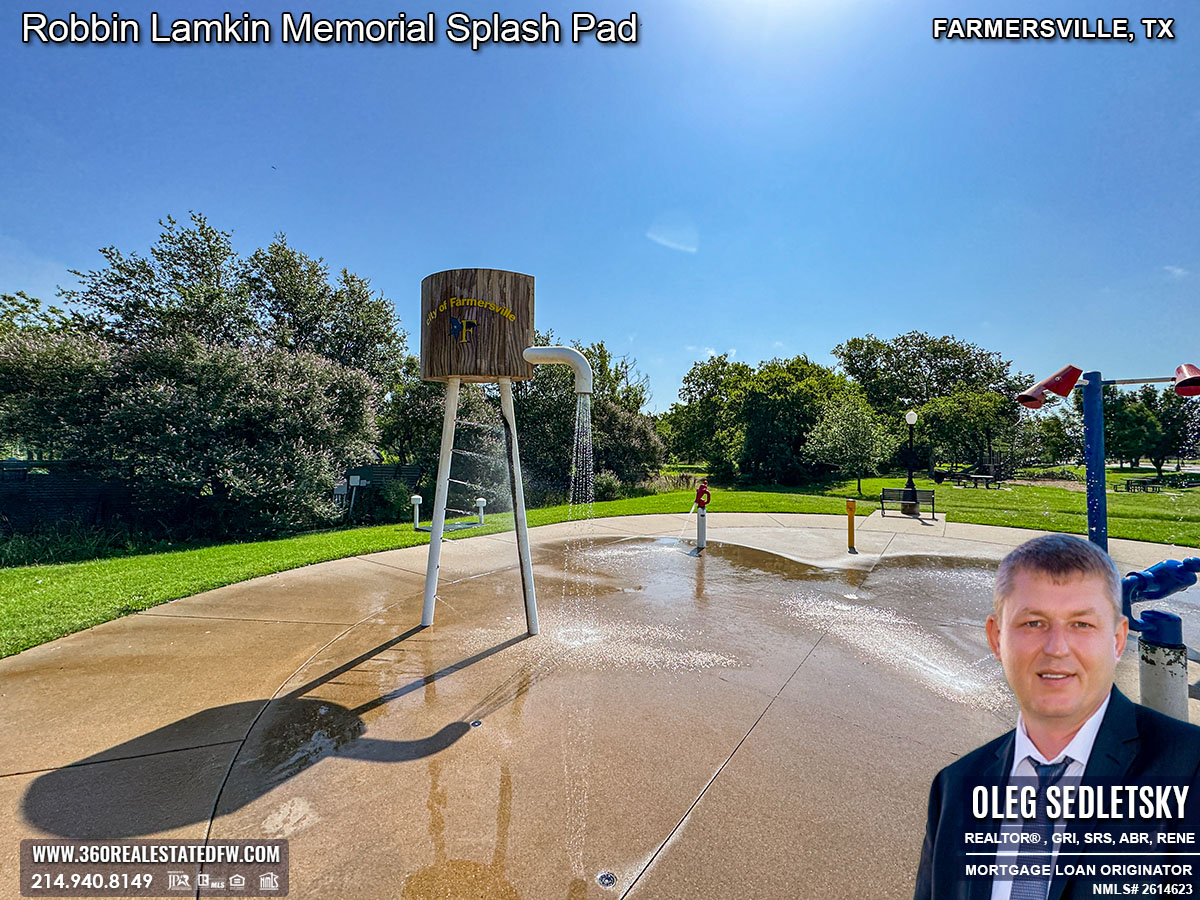
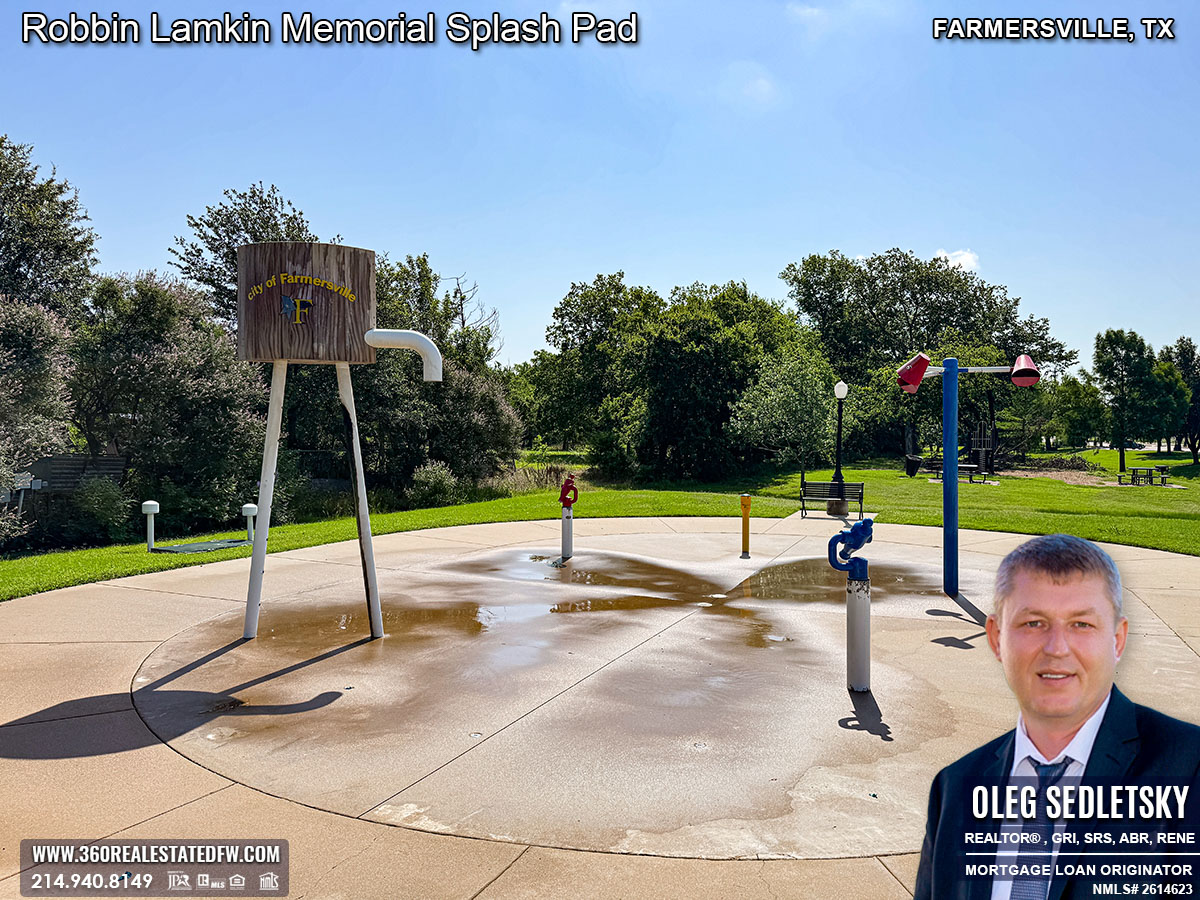
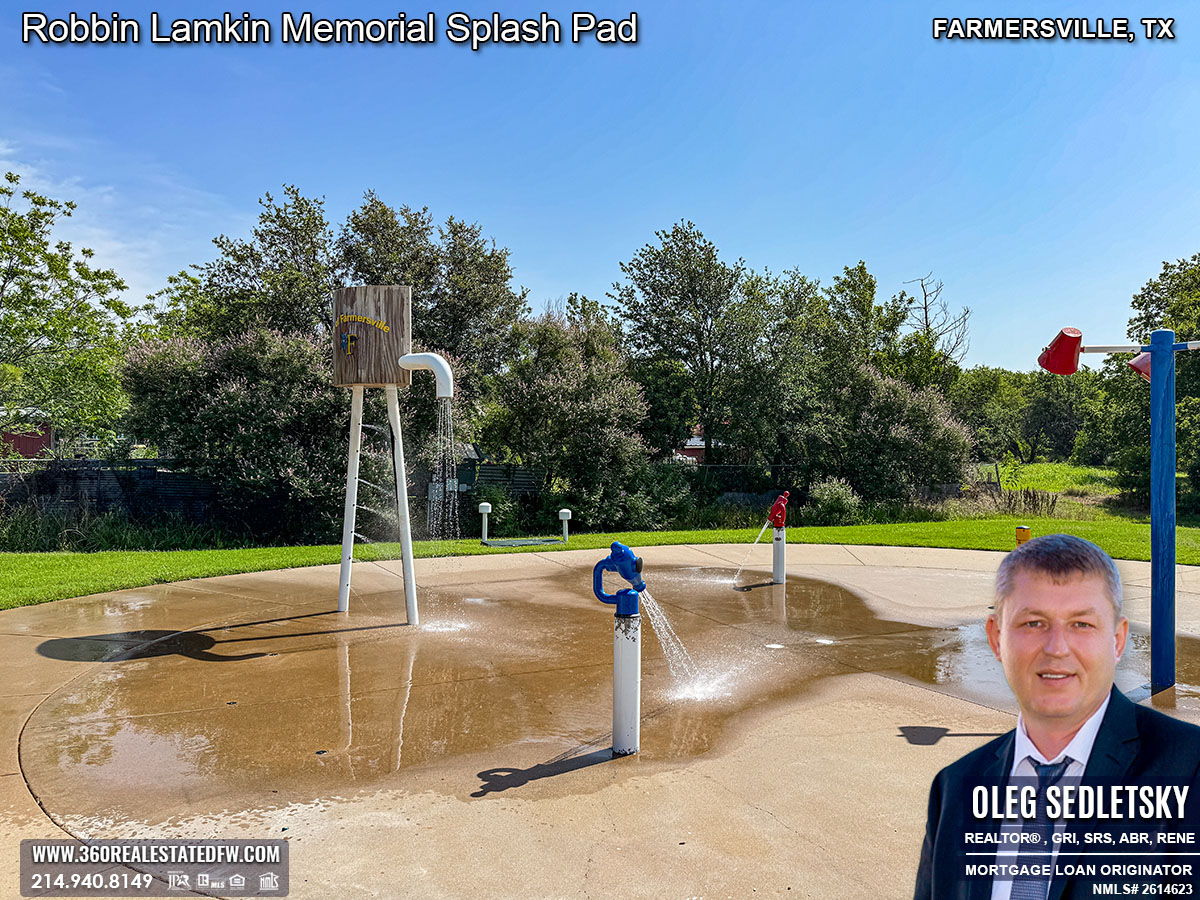
The Decorative Water Tower
One of the most eye-catching features of the splash pad is the decorative water tower. Designed to both impress and inspire, it sprays water in all directions, creating an impressive centerpiece that captivates kids and adults alike.
Robbin Lamkin Memorial Splash Pad Rules and Guidelines:
- NO drugs, alcohol, smoking, or smokless tobacco.
- NO glass containers.
- NO abusive or inappropriate language
- No pets (except working animals).
- NO food or drink permitted on splashpad area.
- NO skateboards, rollerblades, or bikes permitted on the splashpad area.
- NO running or rough play on the splashpad area.
- Infants MUST wear swim diapers.
- Water shoes or non-slip shoes are recommended.
- Children under the age of 12 shall always be accompanied and supervised by an adult.
- City of Farmersville is not responsible for personal property or bodily injury.
By adhering to these simple guidelines, families can ensure the splash pad remains a safe and welcoming space for all visitors.
Tips for Visitors
Want to make your visit as smooth and enjoyable as possible? Keep these tips in mind:
Arrive Early – The splash pad is a popular spot, especially on hot summer days. Arriving earlier in the day can help you secure a good spot for seating or play.
Stay Hydrated – Bring plenty of water to ensure you and your family stay cool and hydrated throughout the day.
Pack Essentials – Don’t forget sunscreen, towels, a change of clothes for your kids, and comfortable footwear.
Check the Weather – The splash pad operates best during clear, sunny weather. Keep an eye on forecasts to plan the perfect outing.
Bring Snacks – Stash some healthy, mess-free snacks for when little tummies get hungry after hours of play. Just remember to eat outside the splash pad area to keep things tidy.
Why the Robbin Lamkin Memorial Splash Pad is a Must-Visit
Robbin Lamkin Memorial Splash Pad doesn’t just provide a place to cool off—it offers an opportunity for families to bond, laugh, and enjoy quality time together. The combination of playful water features, convenient amenities, and clear guidelines for safety means that every visit is stress-free and full of fun.
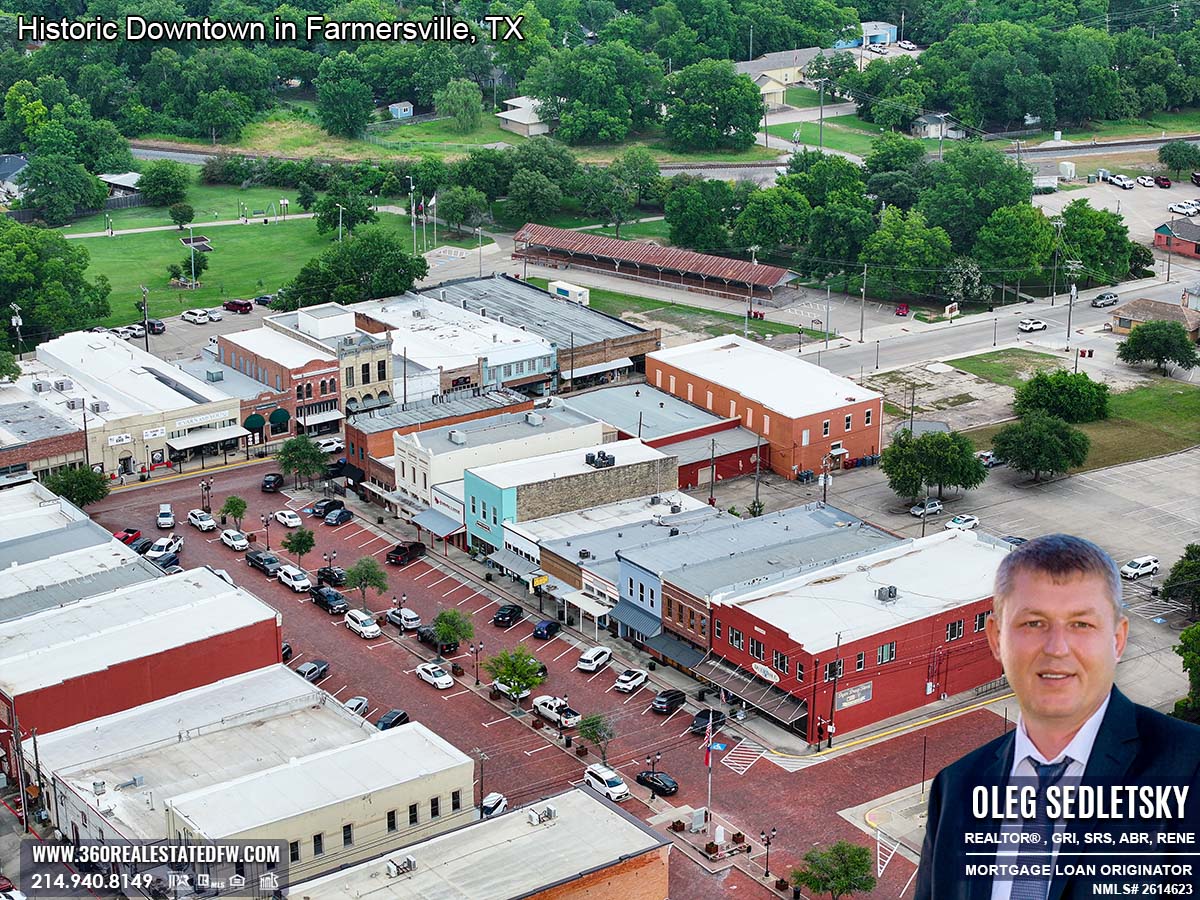
Its location within the Rambler’s Park, surrounded by other park features like playgrounds and picnic areas, enhances its charm. The proximity to Farmersville historic downtown is an added bonus, allowing for a seamless transition from outdoor fun to exploring the local culture.
With that, I’m Oleg Sedletsky, your Realtor and Mortgage Loan Originator, wishing you a fantastic day!
Be sure to visit my website often—I’ll be sharing even more exciting attractions in Farmersville, TX and the surrounding areas.
If you’re looking to buy or sell a home or need help with a mortgage, I’m here for you.
Take a look below for a photo gallery of the splash pad!
Photo Gallery of Robbin Lamkin Memorial Splash Pad in Farmersville, TX (over 30 photos)


Are you ready to experience the joy of homeownership in the vibrant Dallas-Fort Worth area?
Whether you’re in search of an existing home or a brand-new construction, rest assured that I’m here to assist you every step of the way.
With a dedicated Realtor by your side, the home-buying process becomes a breeze. Say goodbye to stress, and let me handle all the intricate details on your behalf.
Getting the guidance you need is as simple as filling out a brief questionnaire on my Homebuyers contact form. From there, I’ll take care of everything, ensuring a seamless and hassle-free journey towards finding your dream home.
Call/Text 214.940.8149


Things to do In Farmersville, TX: Discover the Charm of Rambler's Park (Over 40 Photos)
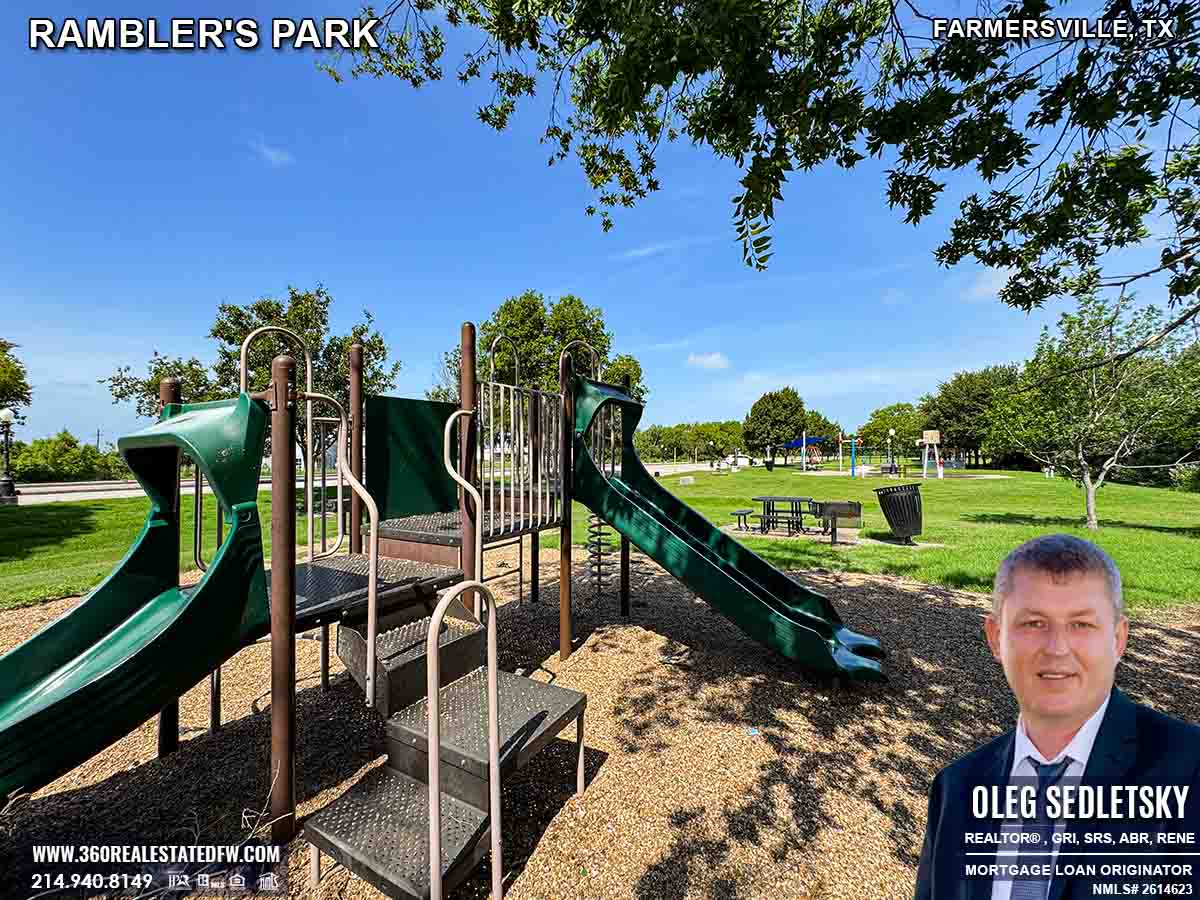
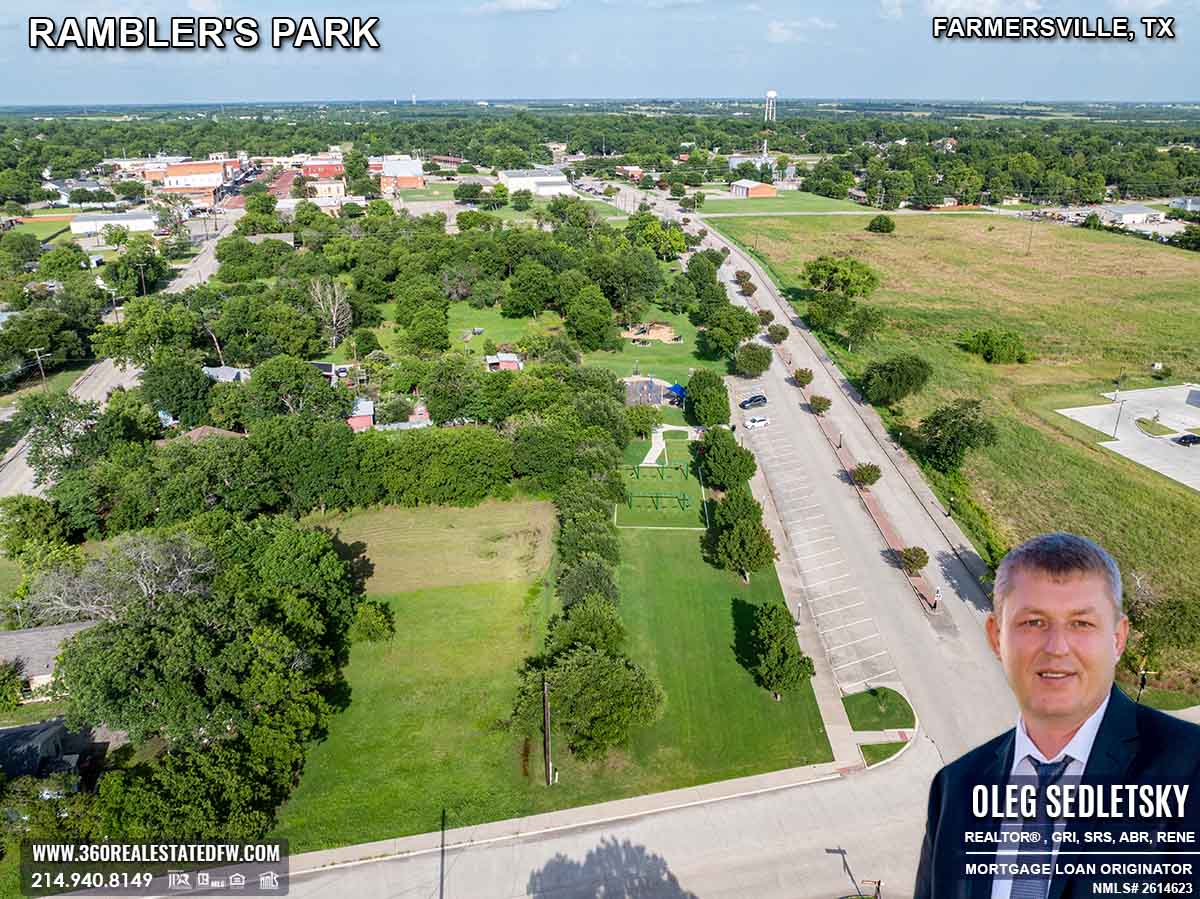
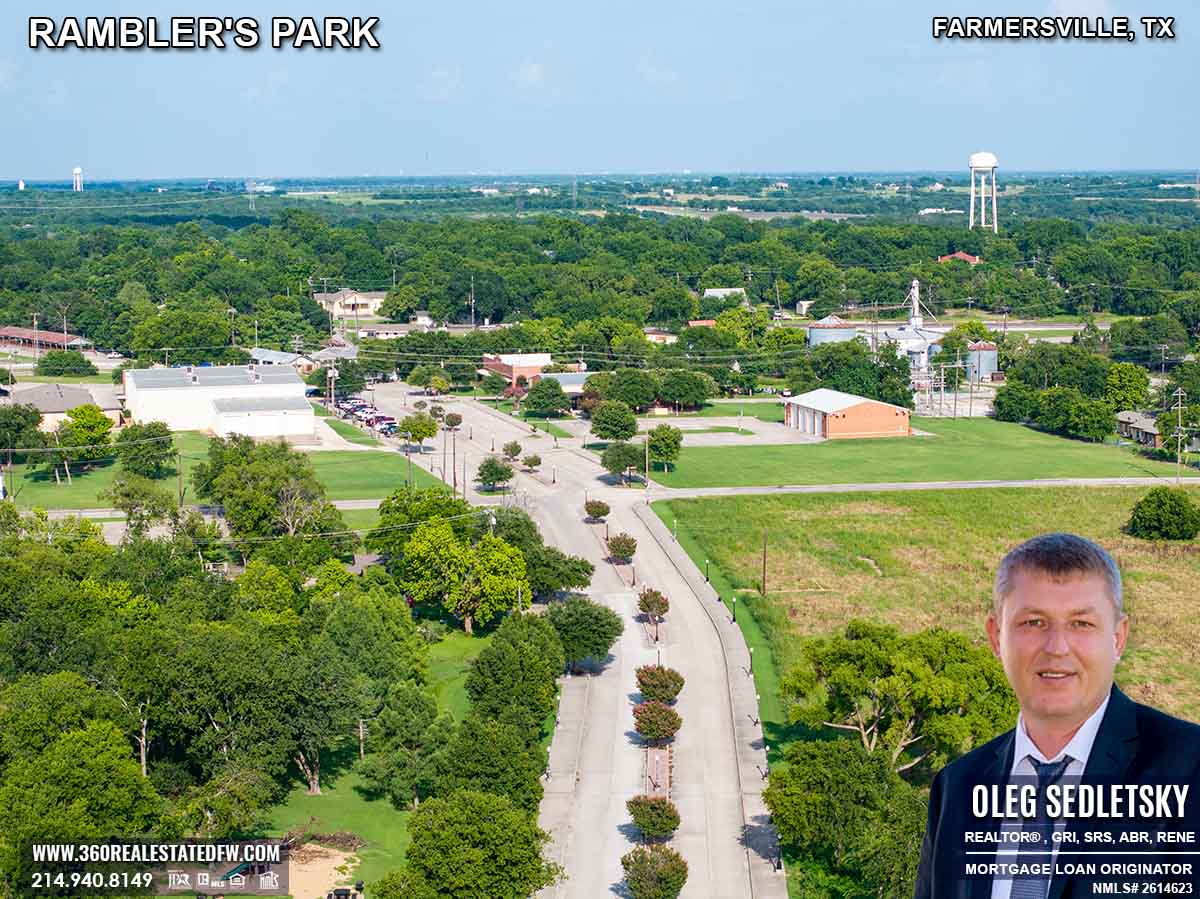
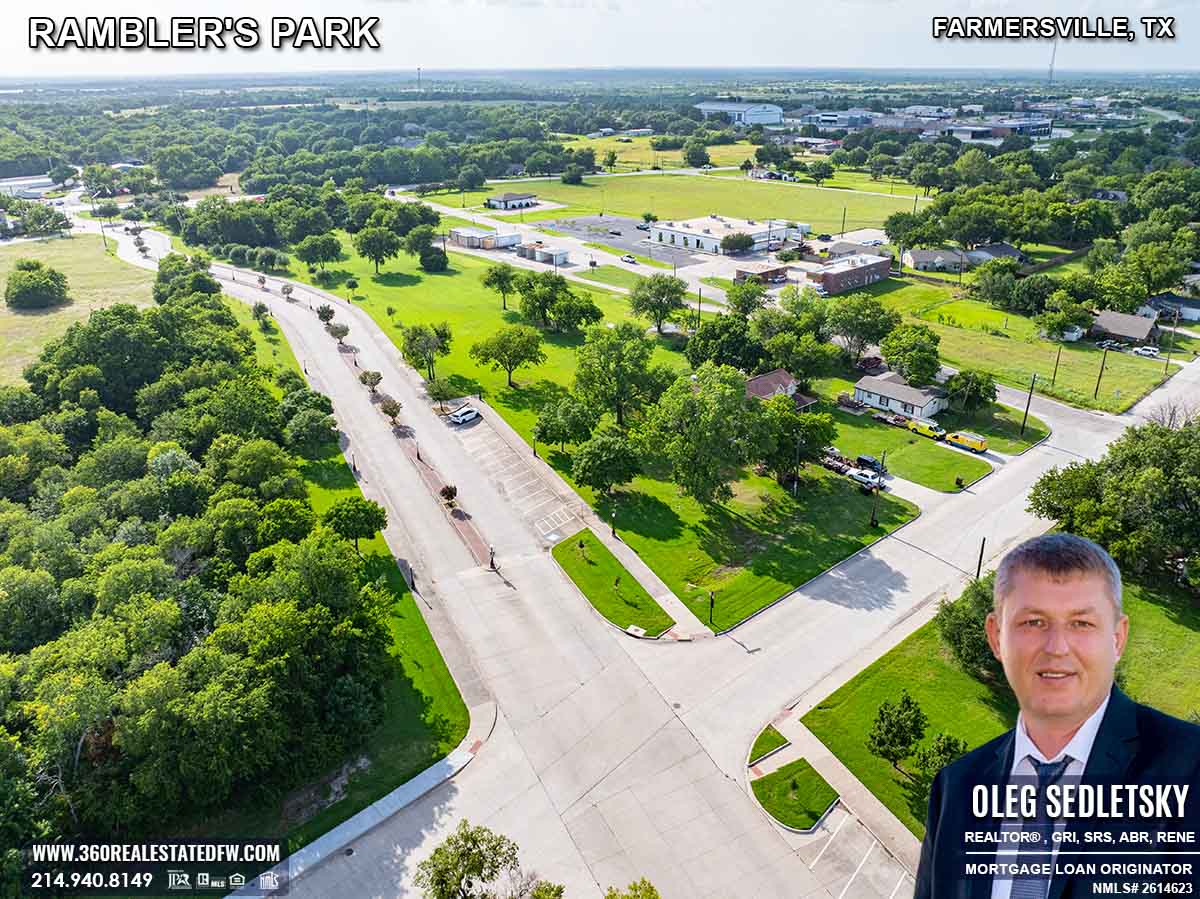
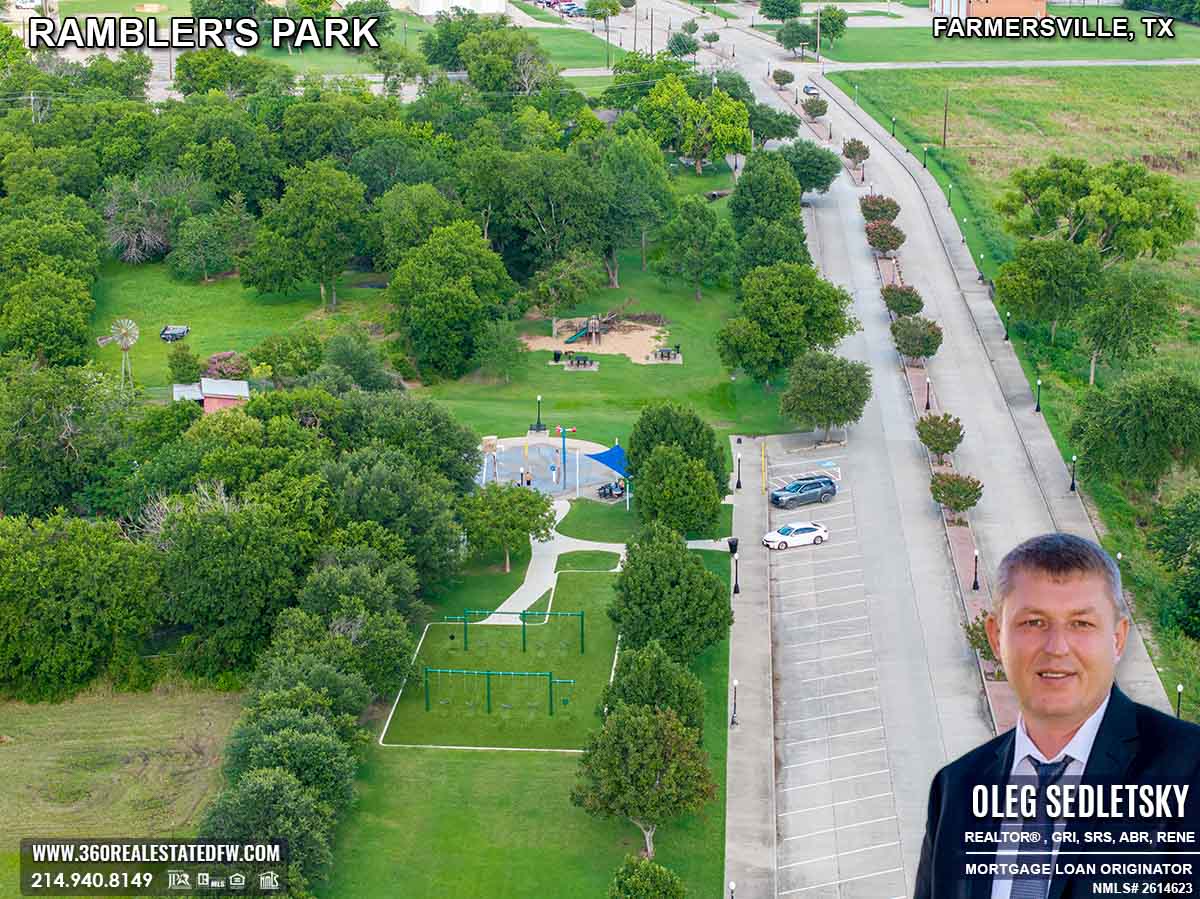
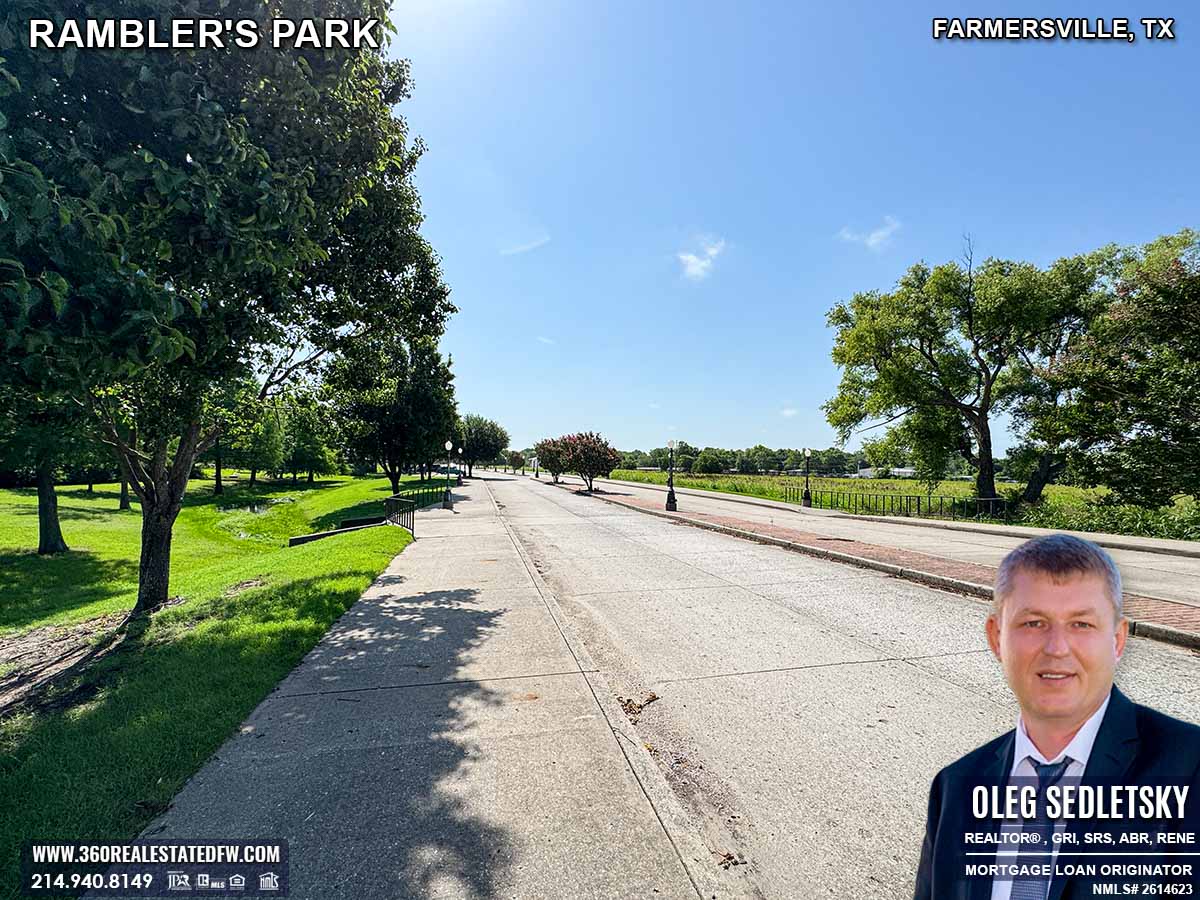
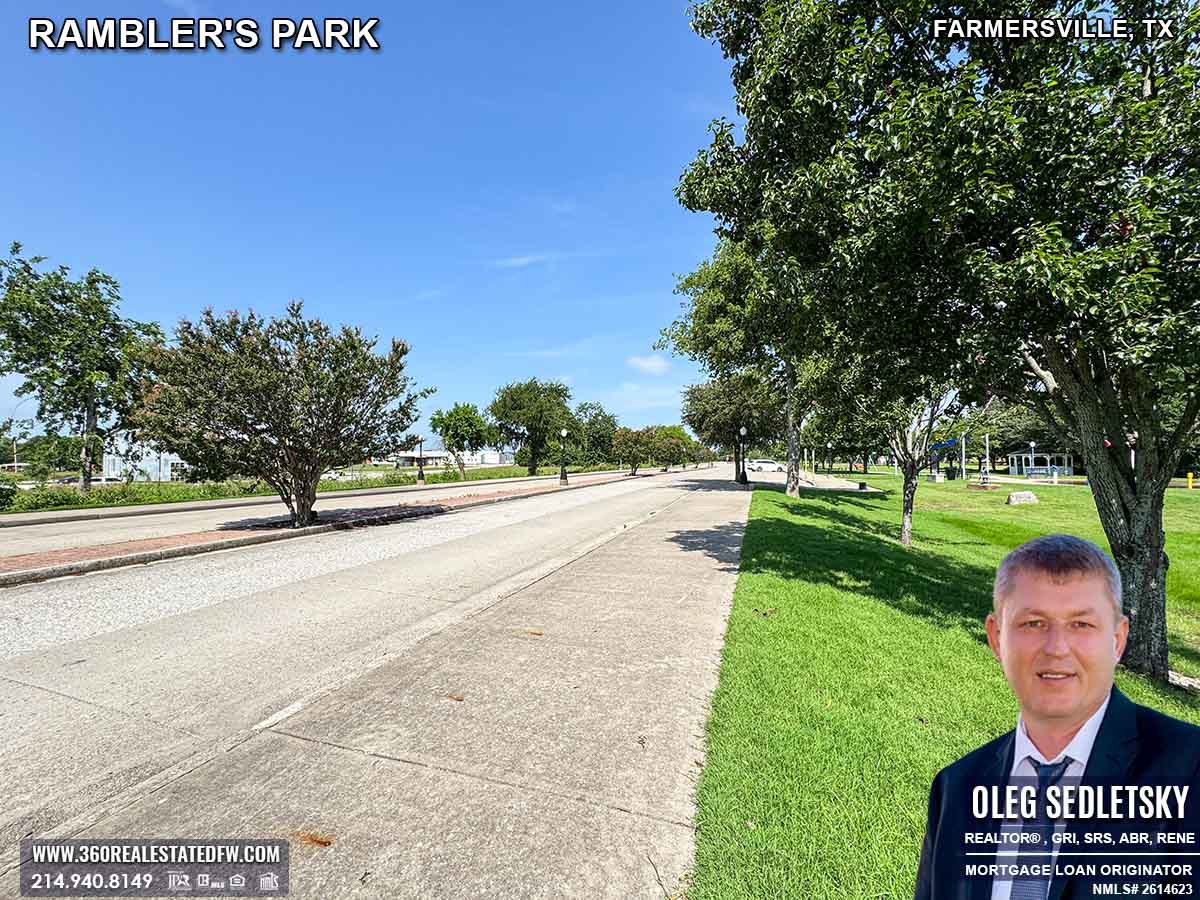
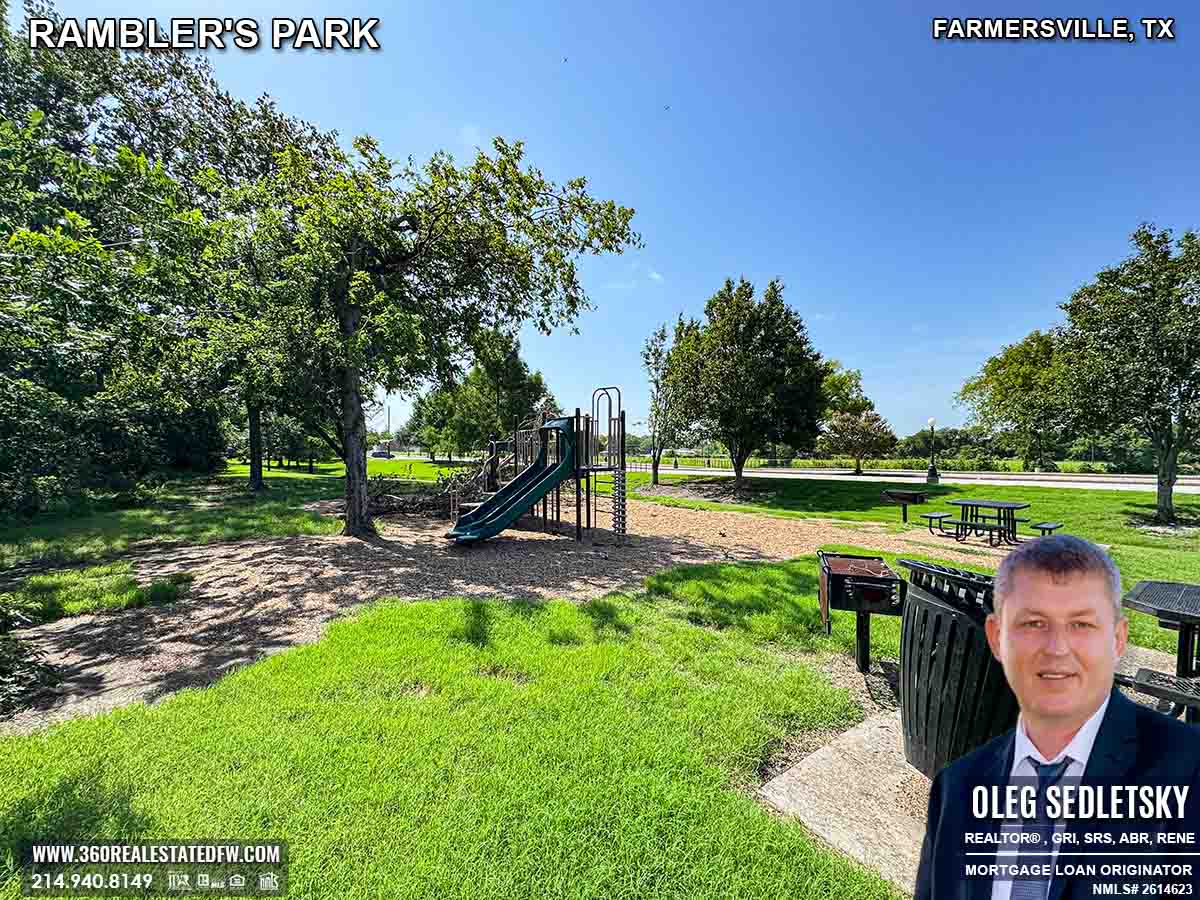
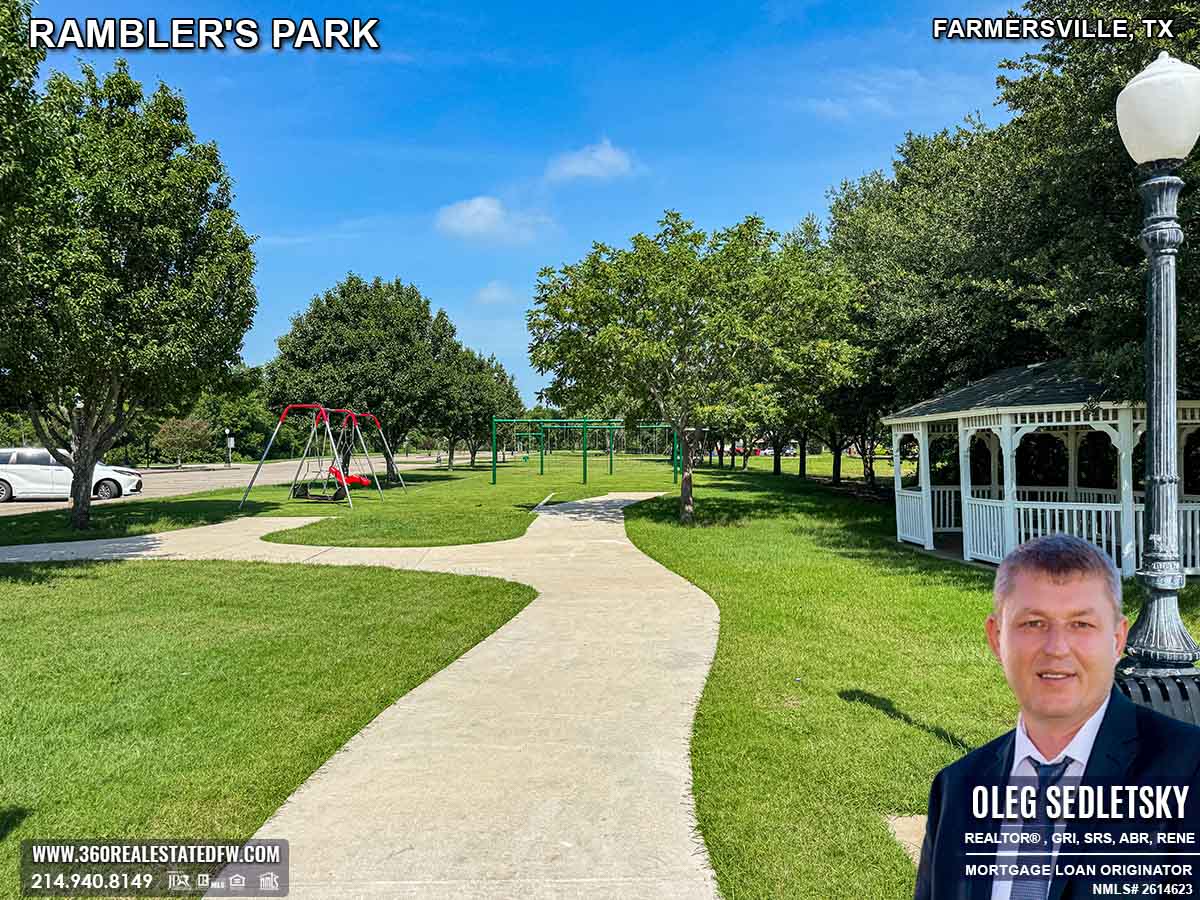
When it comes to finding the perfect blend of fun and relaxation, Rambler’s Park has it all. This cozy yet feature-packed park is a standout recreational spot in the city of Farmersville, TX, offering families, friends, and individuals an inviting space to unwind and enjoy quality time together. From its vibrant splash pad to its serene picnic areas and playful amenities, this park brings people together and proves that good things come in small packages.
Get ready for an adventure! Let’s dive in and discover all the amazing things the Rambler’s Park has waiting for you!
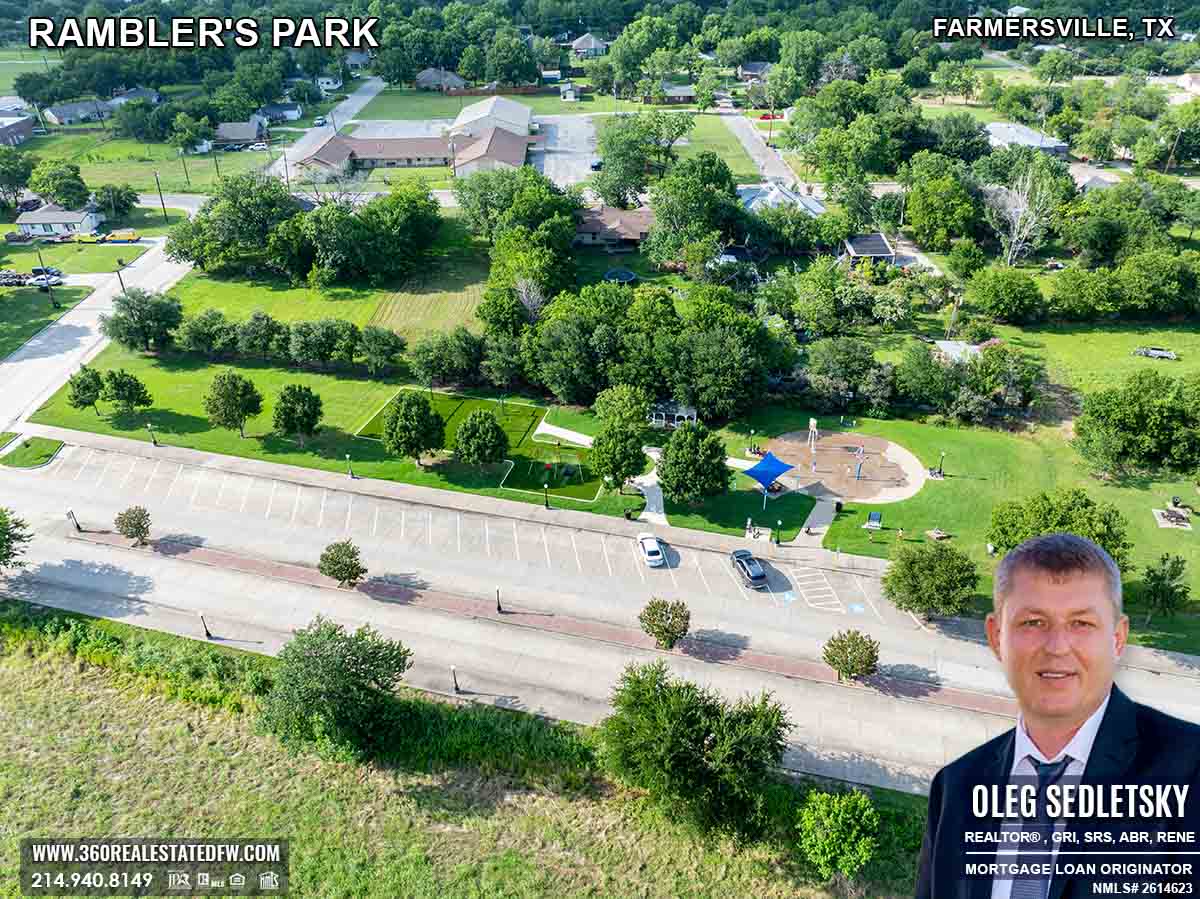
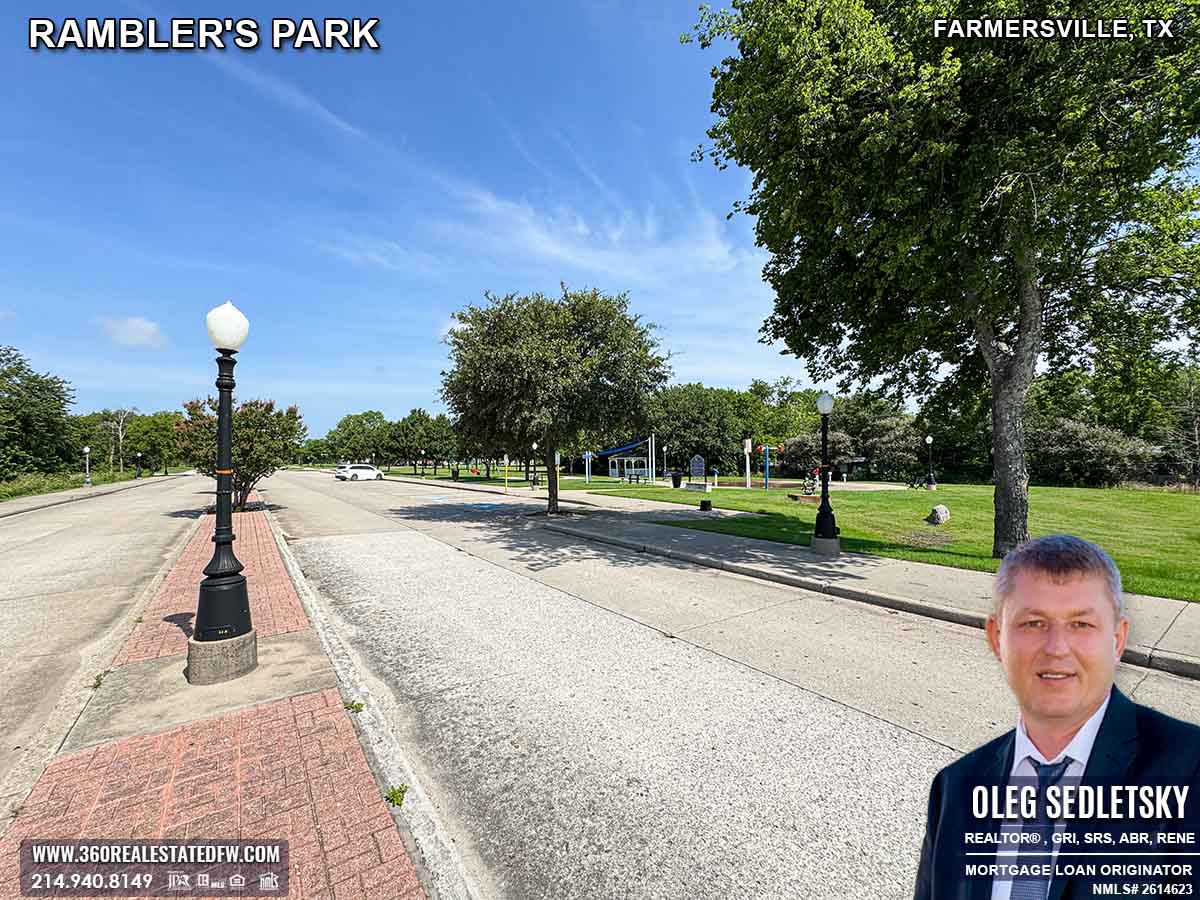
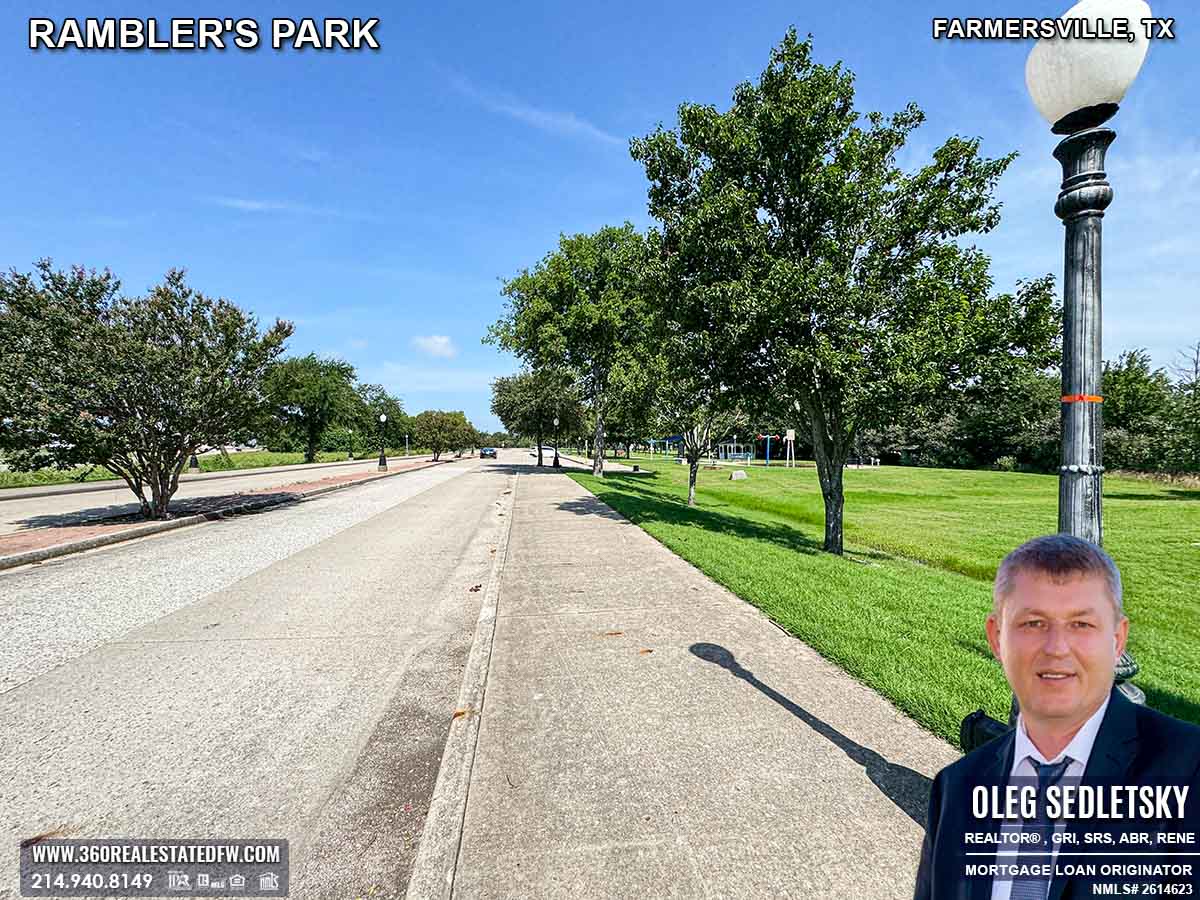
Rambler’s Park Location
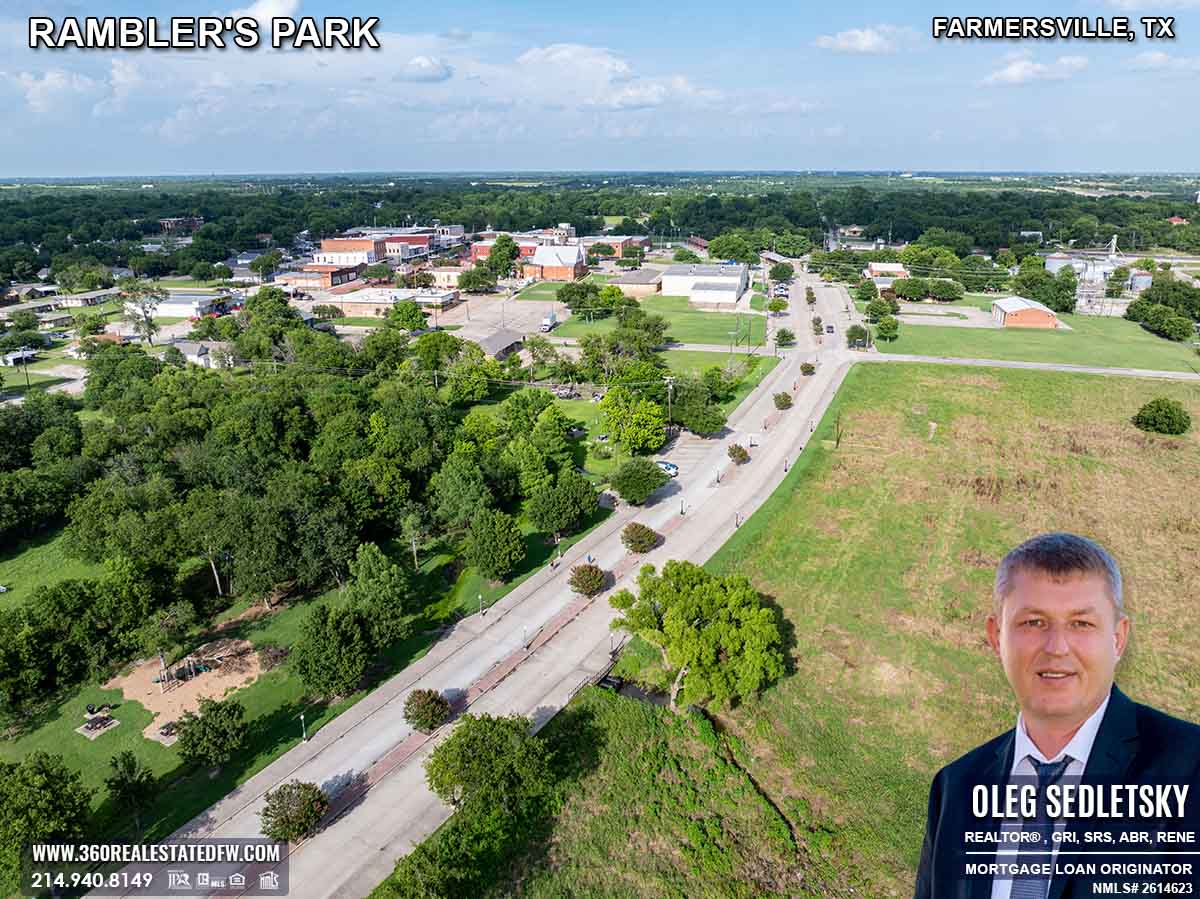
Rambler’s Park is super easy to find! Located along Farmersville Parkway and just 0.3 miles from the historic downtown, all you need to do is plug the address into your GPS and start your adventure.
Address: 424-798 Farmersville Pkwy, Farmersville, TX 75442
Rambler’s Park Hours
The park welcomes you 30 minutes before dawn and bids you farewell 30 minutes after dusk. Come and experience the serenity.
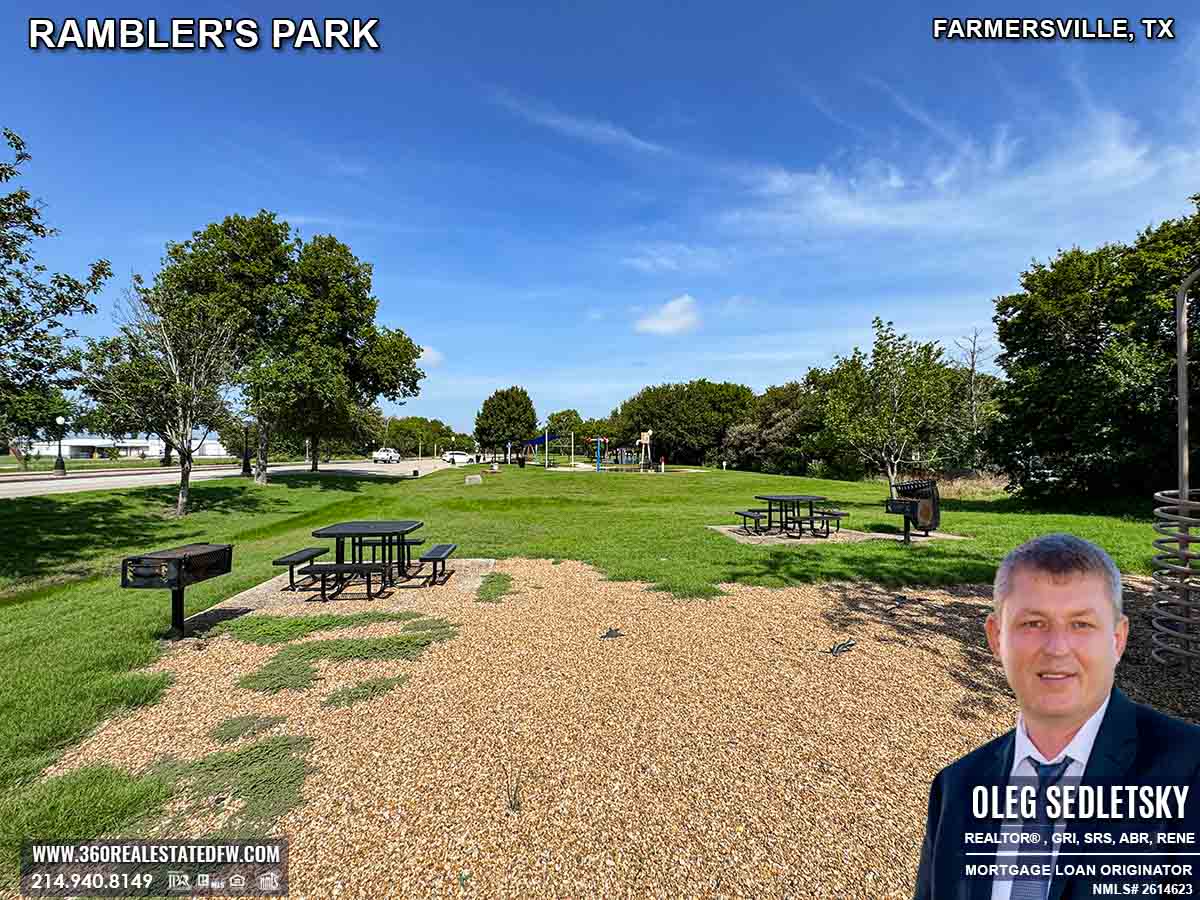
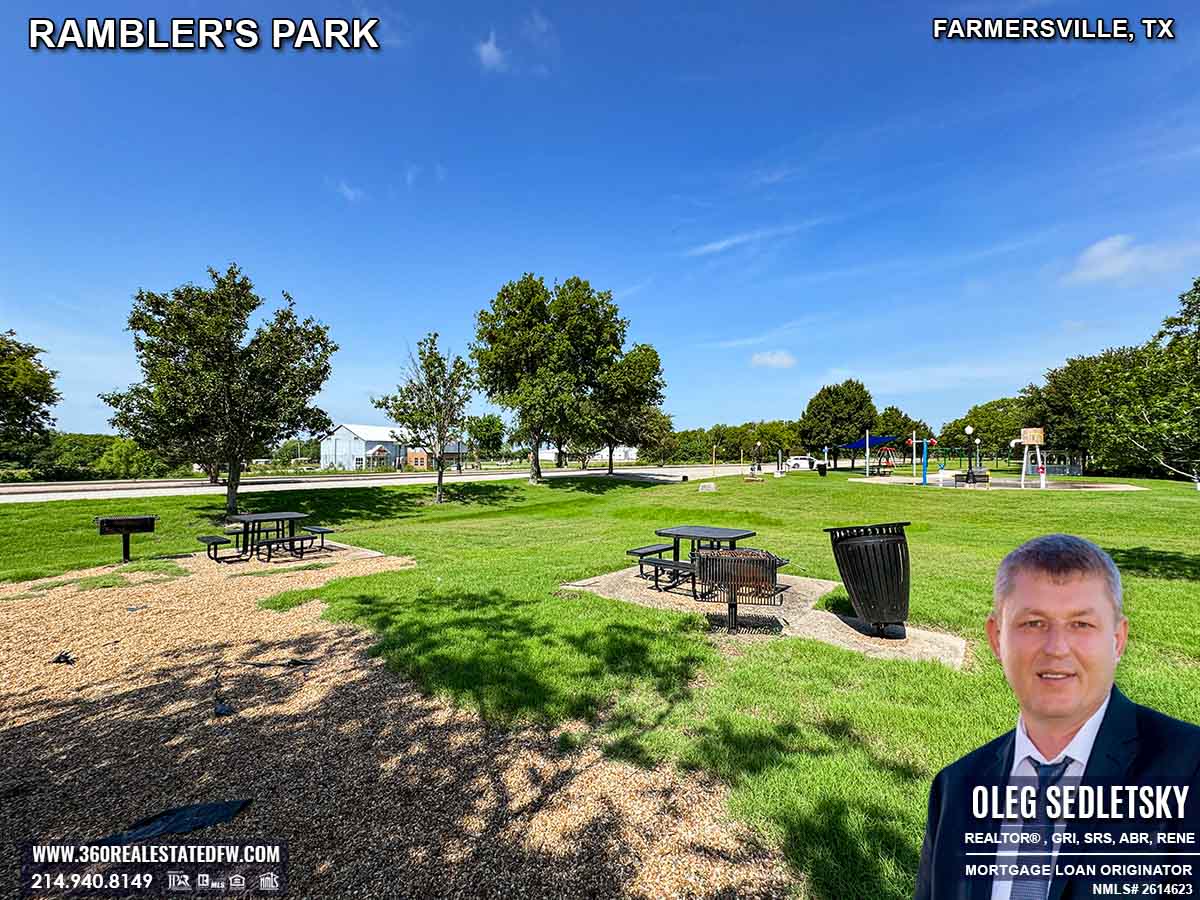
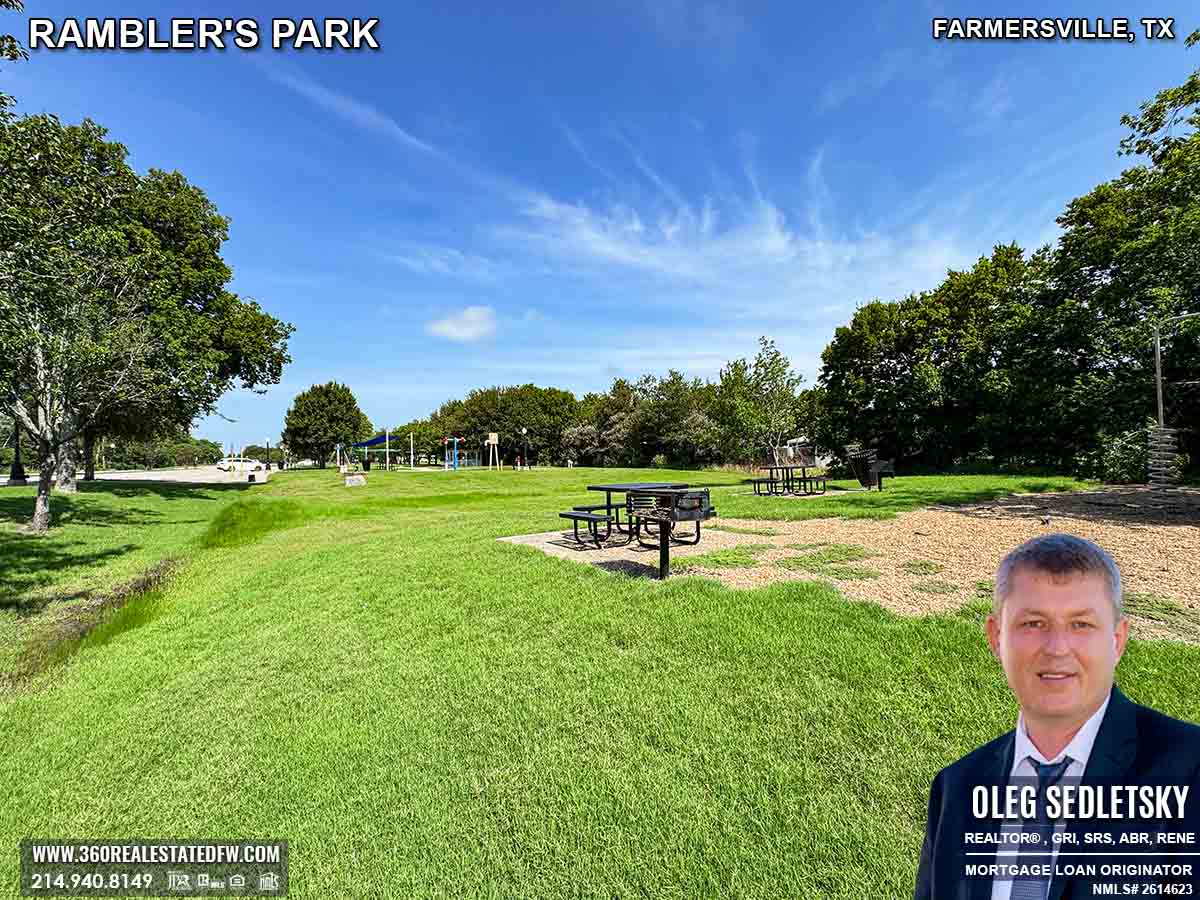
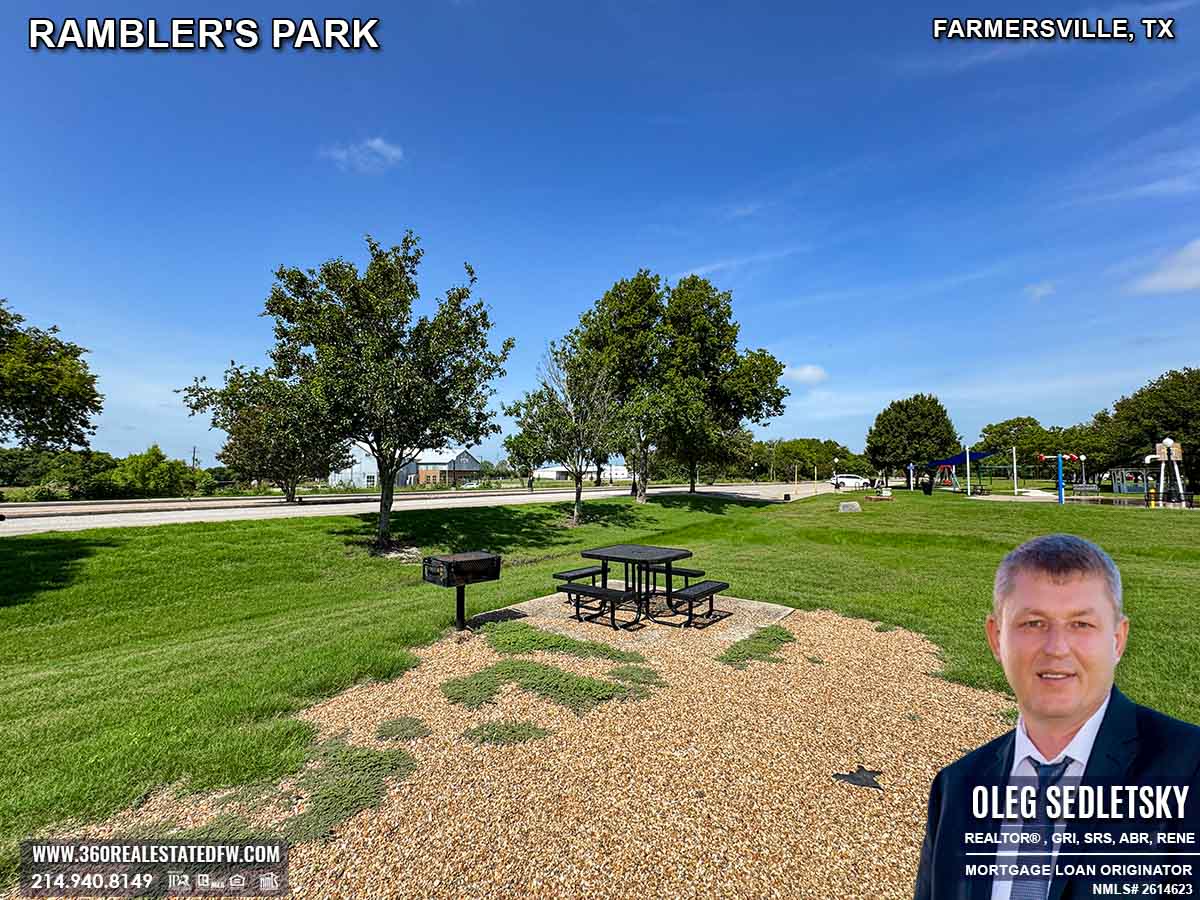
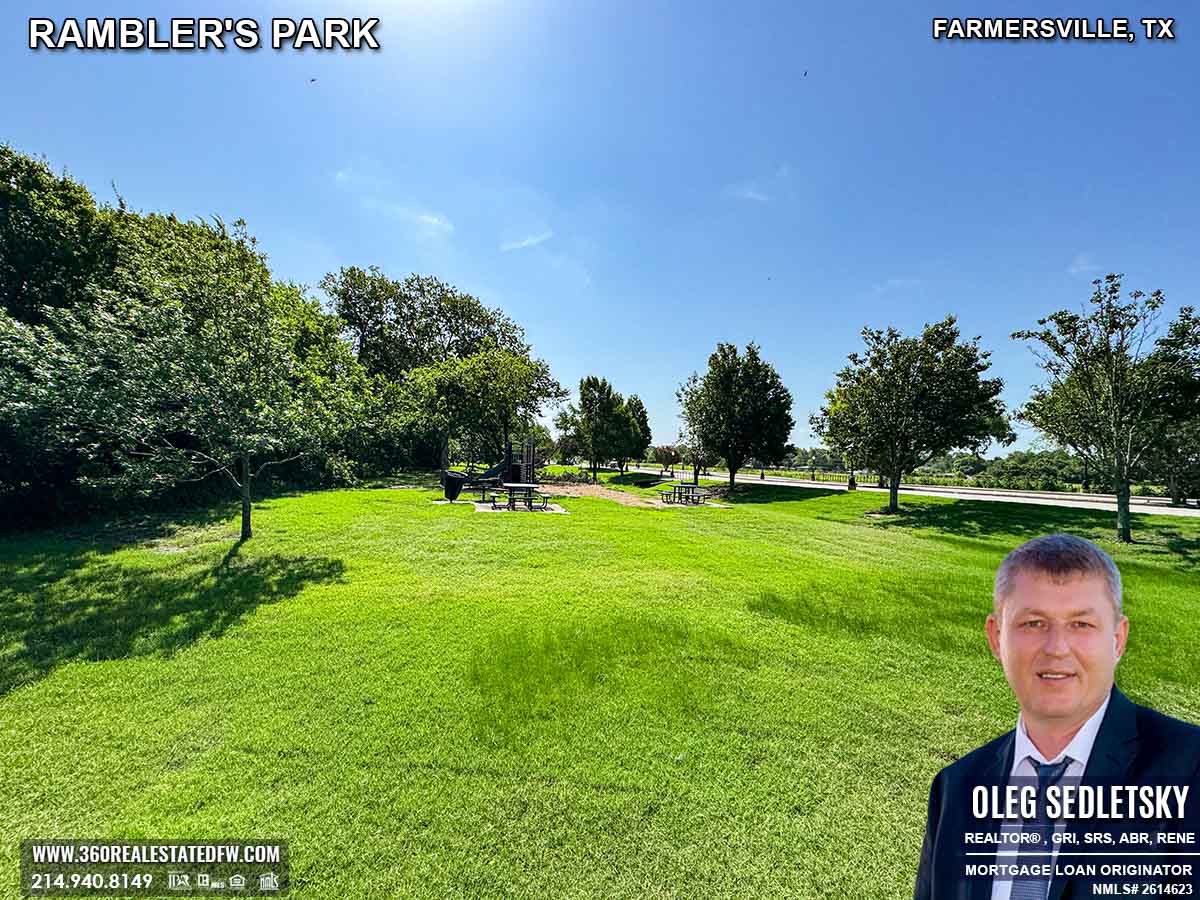
Rambler’s Park Amenities: Picnic Tables and Shaded Areas
If you’re looking to relax, recharge, or host a small celebration, the picnic area is the perfect spot. The park offers two picnic tables, each equipped with an open-flame grill, making it easy to transition from a leisurely afternoon outdoors to a delicious barbecue feast. These tables are nestled under towering, mature trees, creating natural shade and an atmosphere of calm.
Nearby trash cans are conveniently placed to keep the space tidy, and the shaded area ensures a comfortable experience even on warm, sunny days.
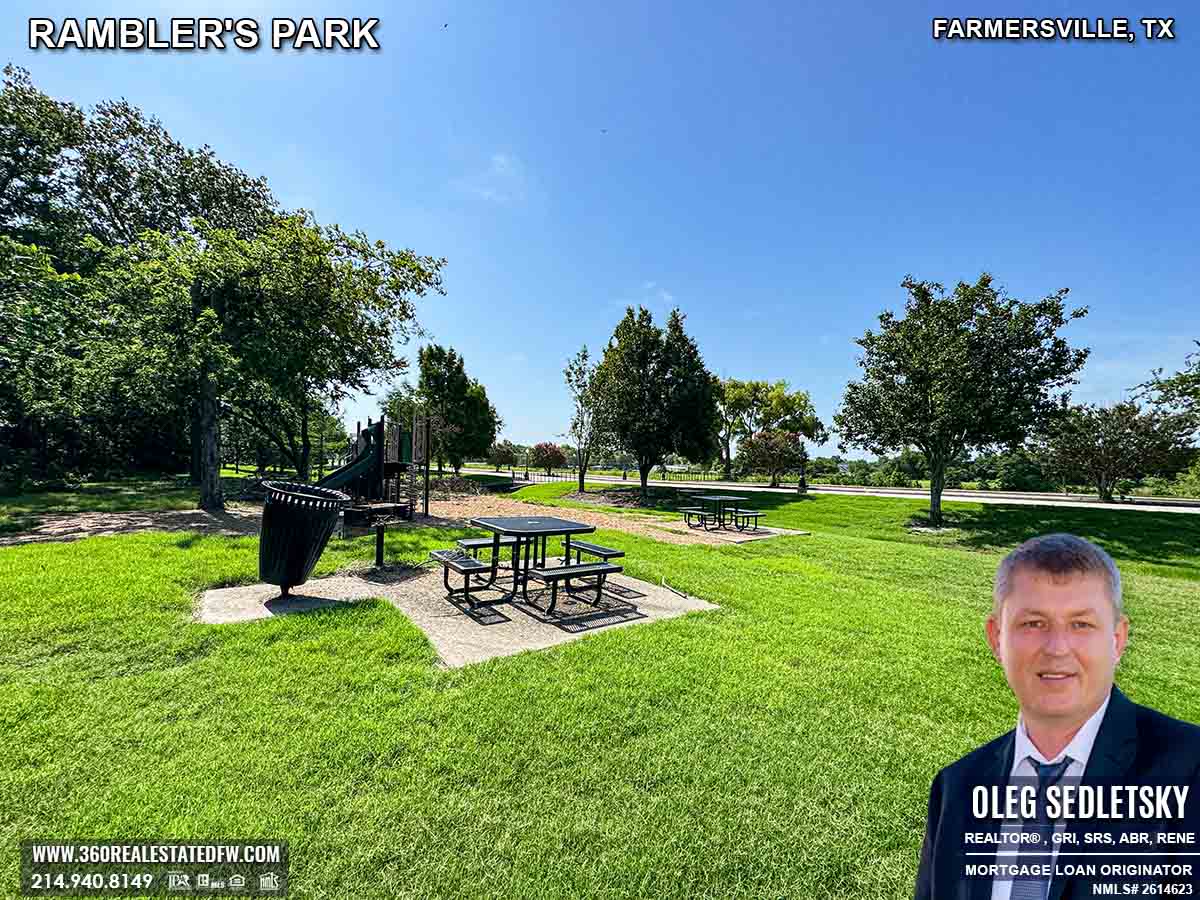
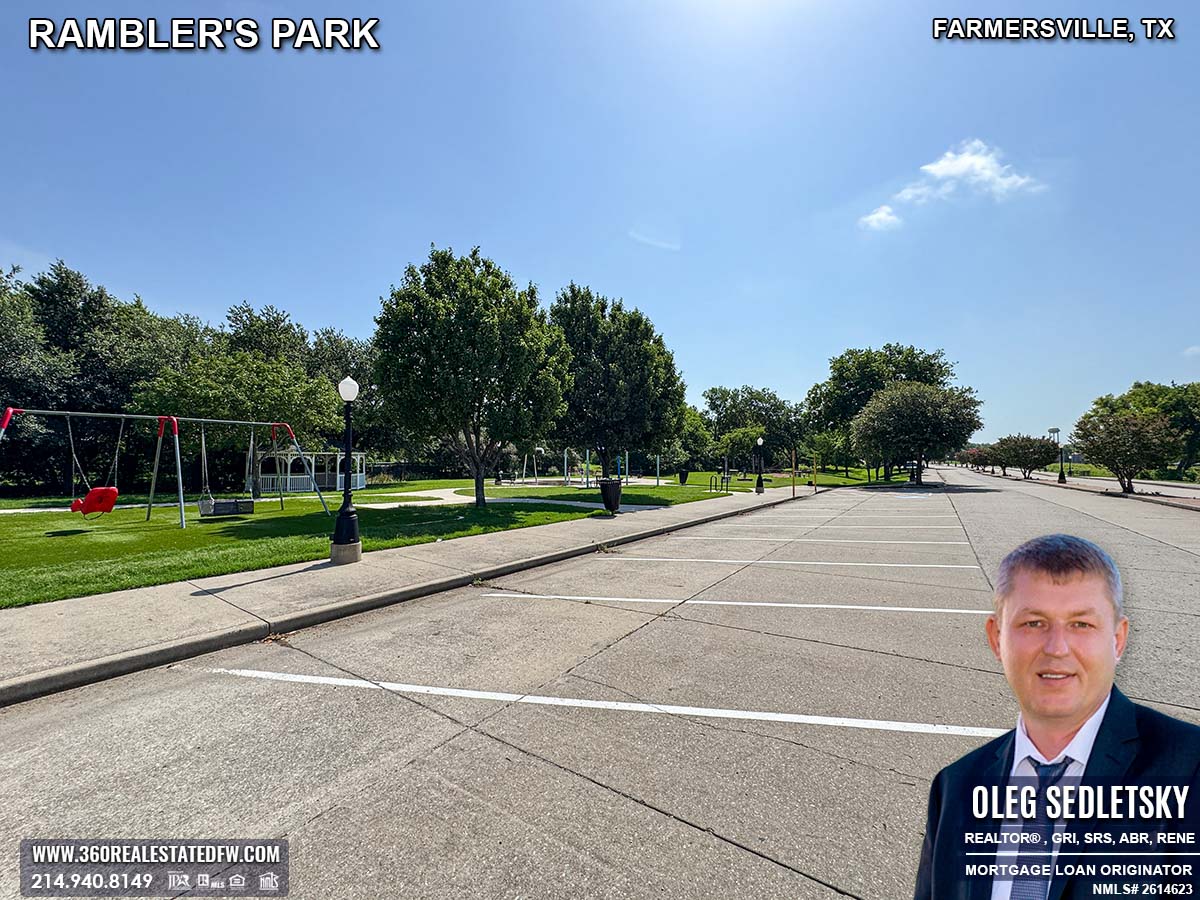
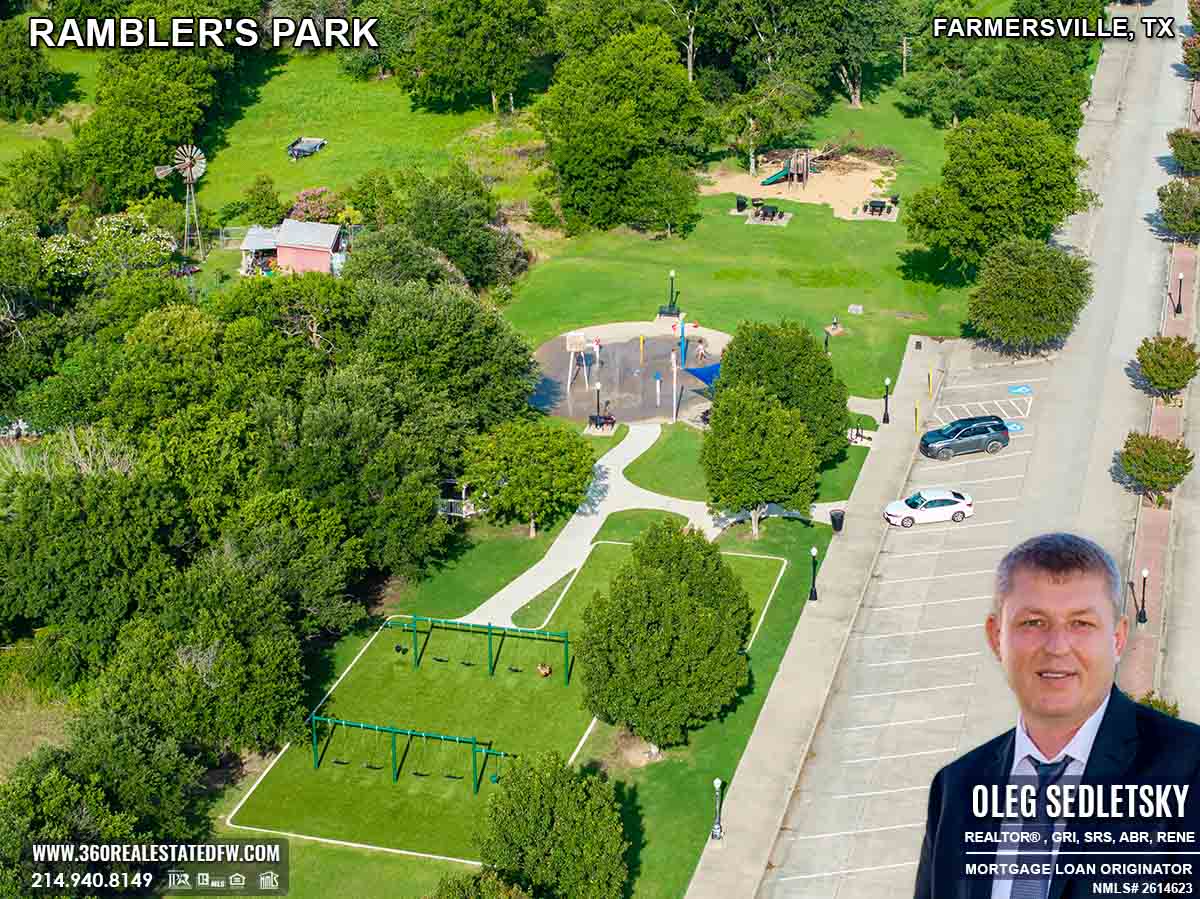
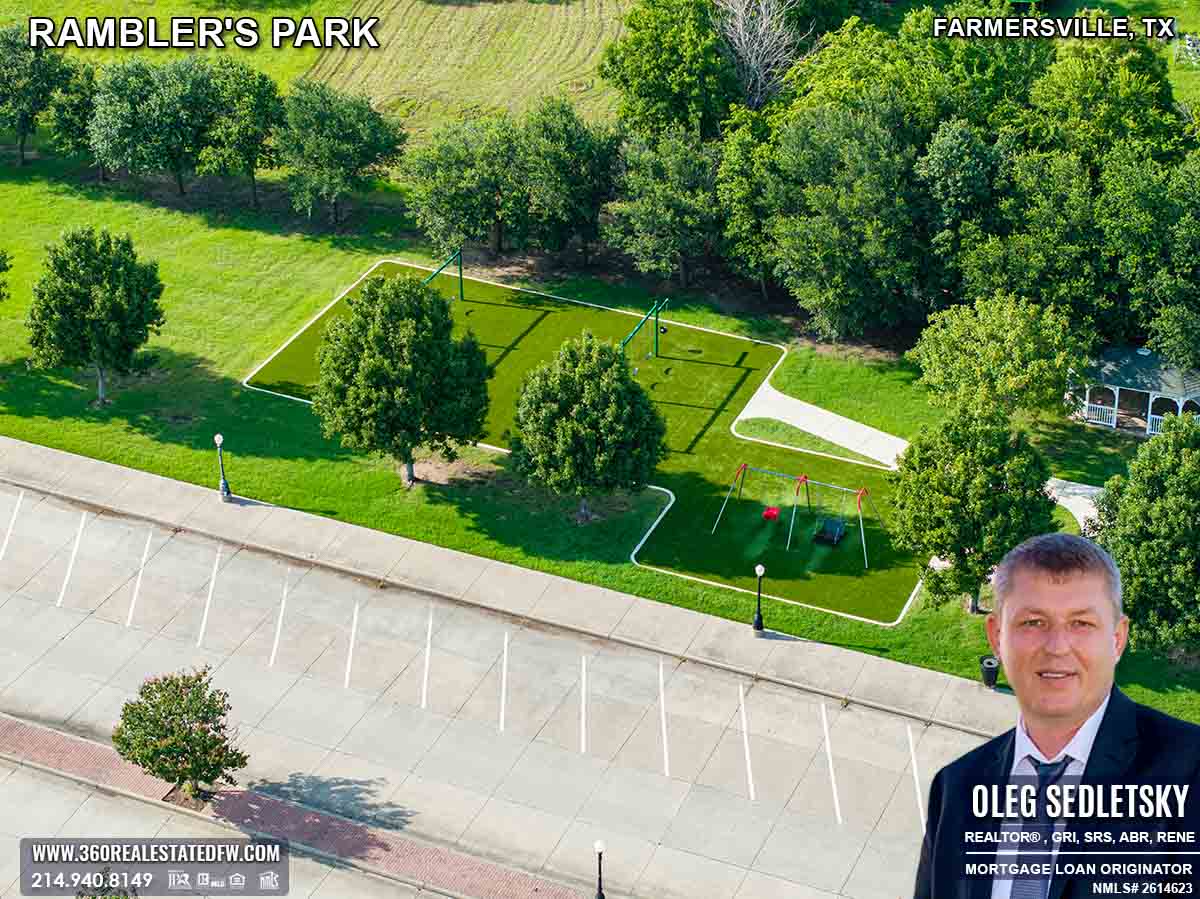
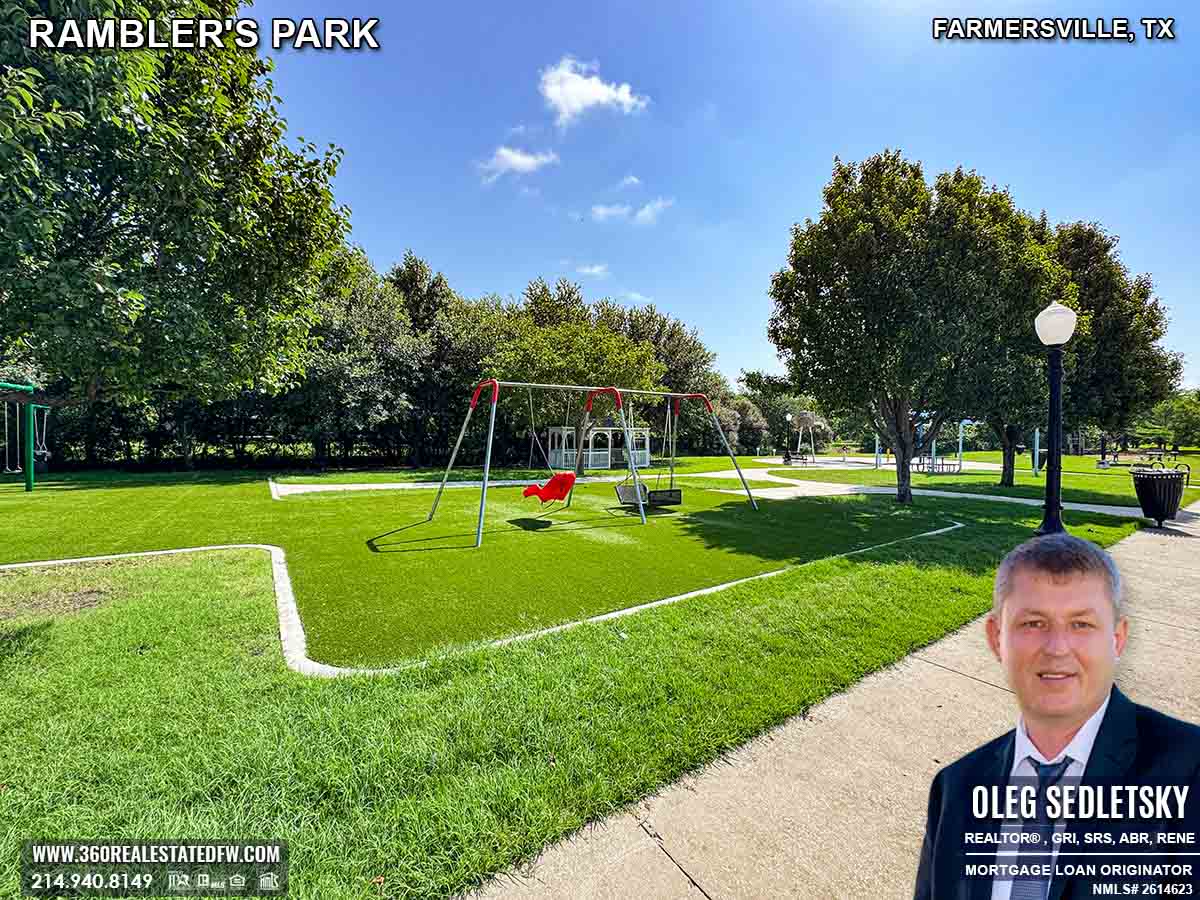
Rambler’s Park Amenities: A Playground for Non-Stop Adventure
For families with energetic little ones, the playground is another highlight that deserves attention. Located strategically near the picnic area, it allows kids to play freely while the adults prepare a meal or enjoy downtime. Its proximity to other amenities, such as the splash pad, means kids have access to endless activities.
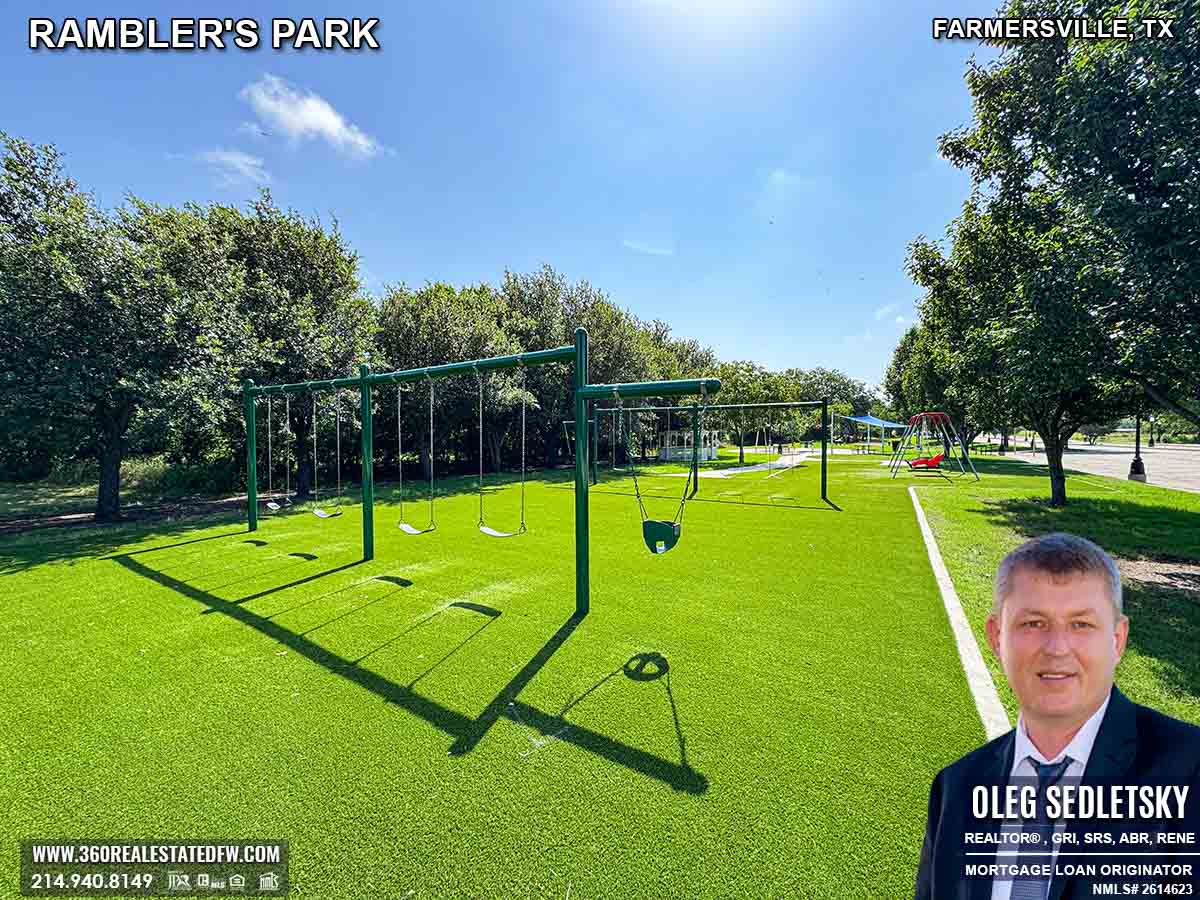
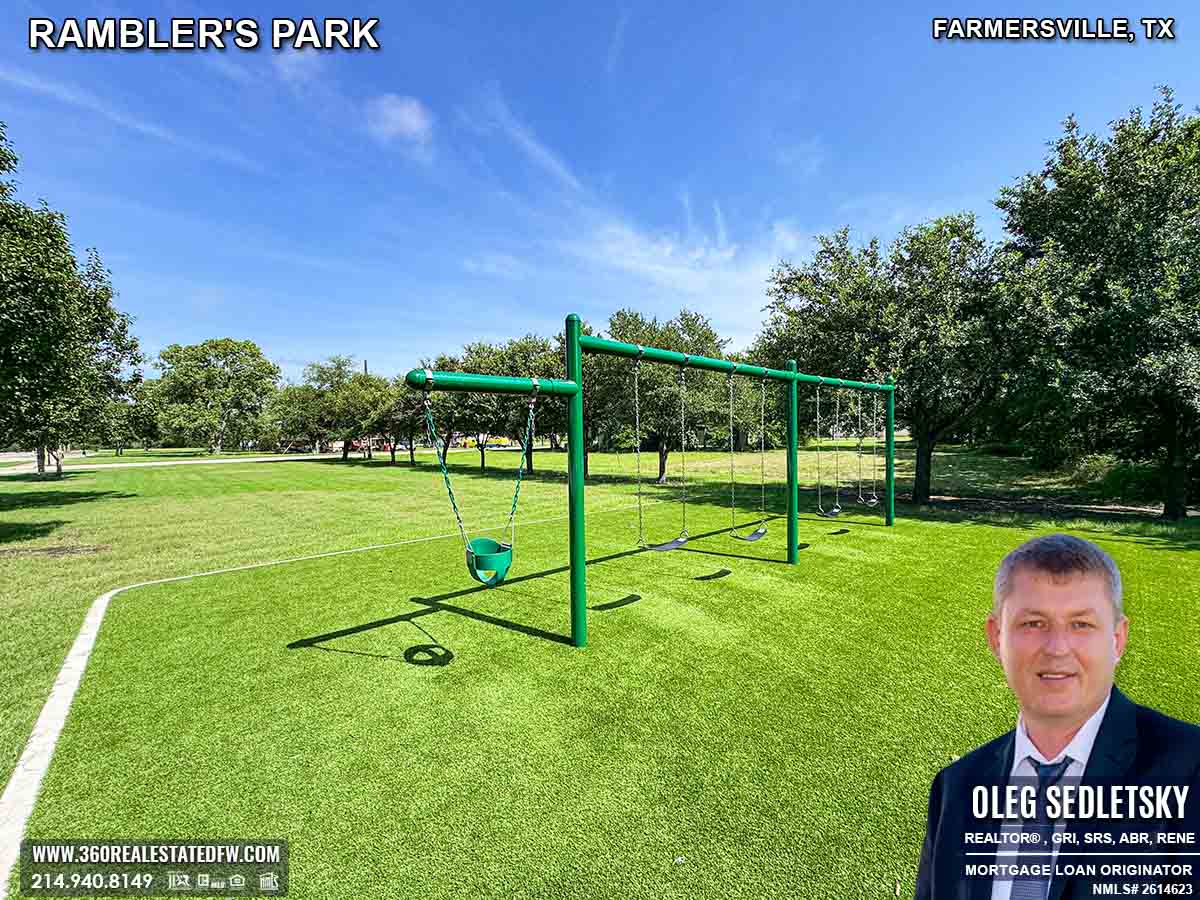
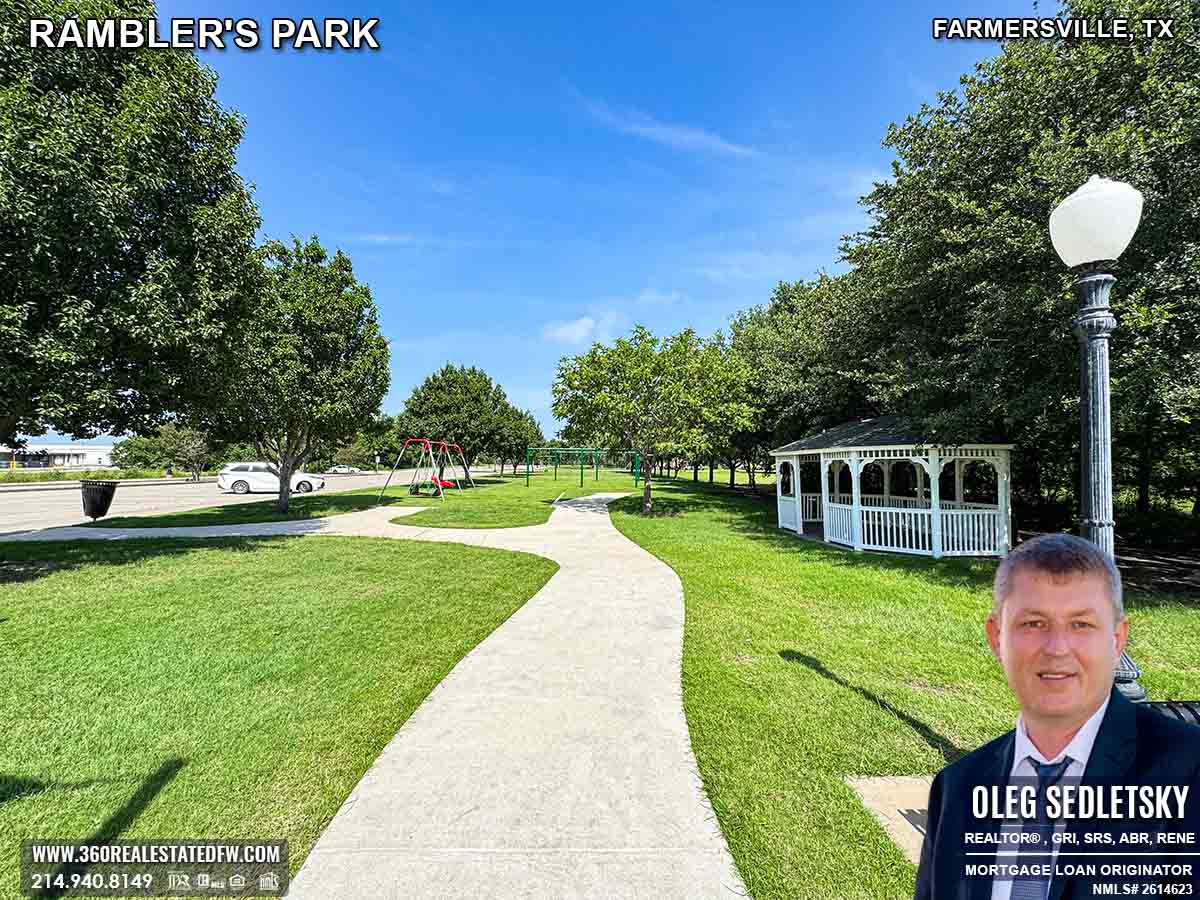
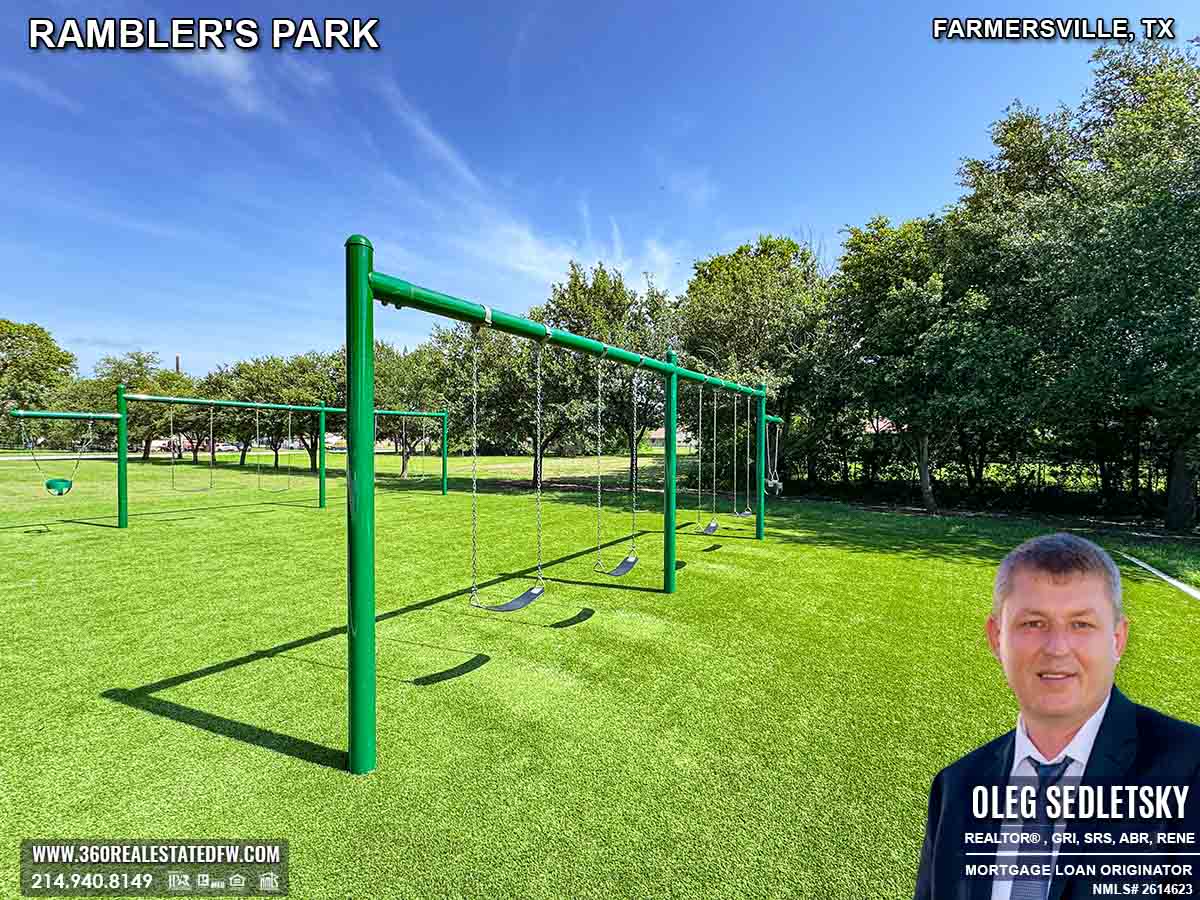
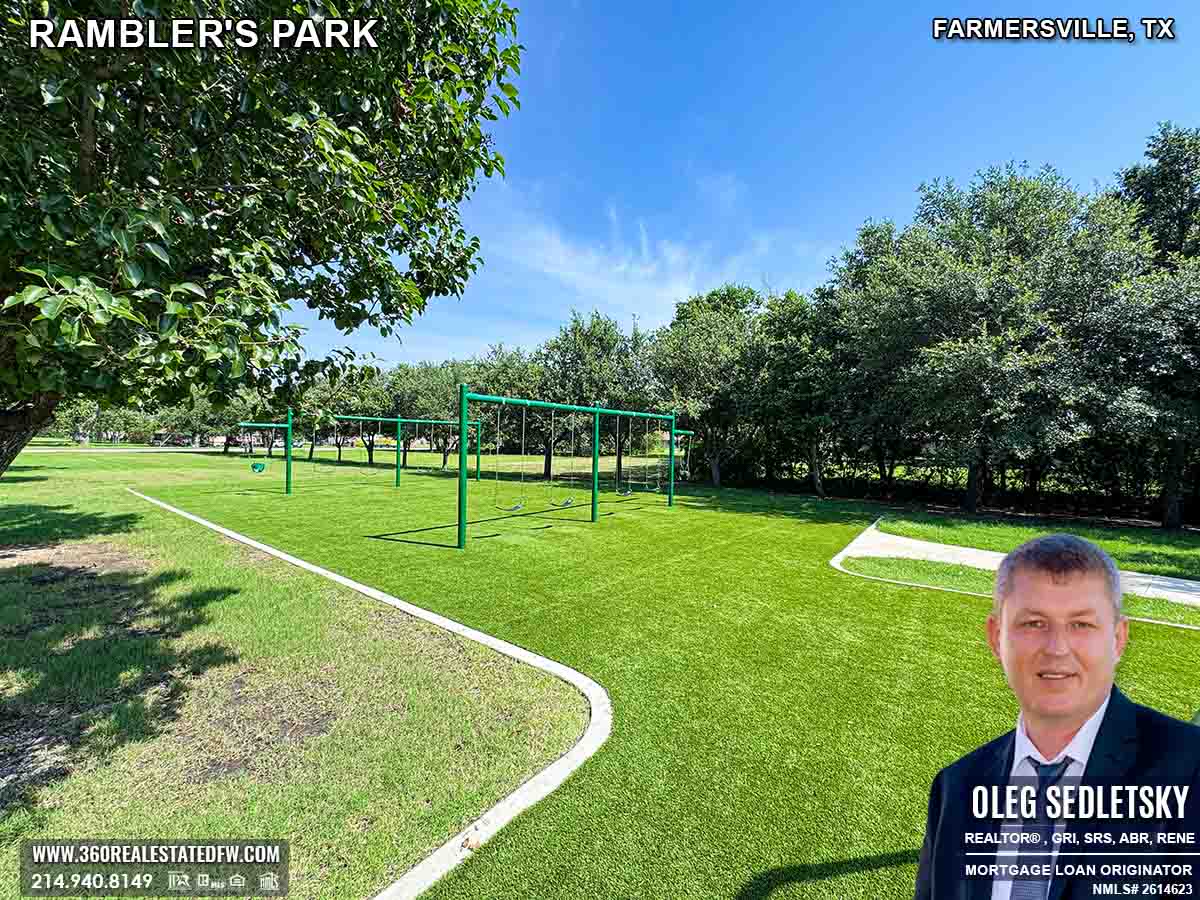
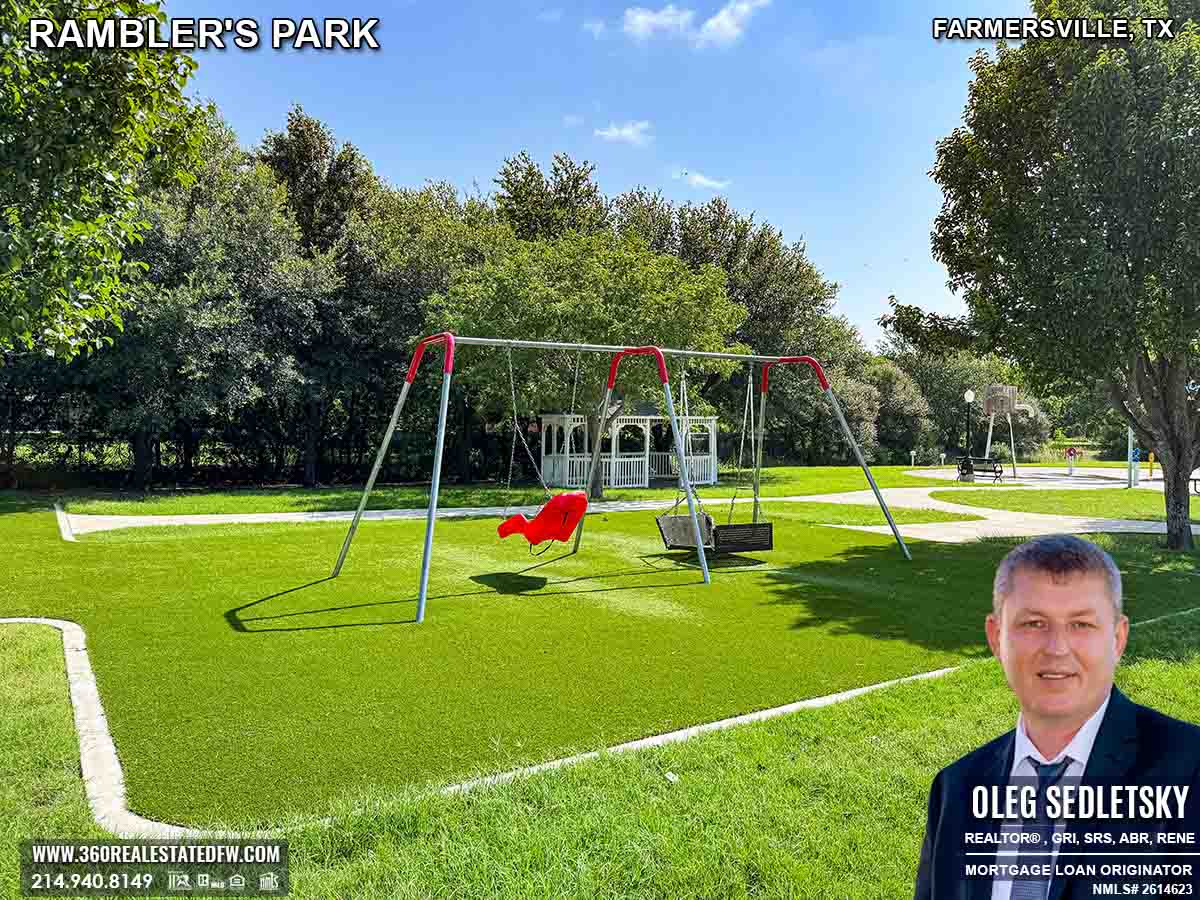
Rambler’s Park Amenities: Swing Sets That Bring Joy Year-Round
Who says swings are just for summer? At the park, the swing sets are ready for action all year long! With artificial grass keeping things neat and safe, kids can enjoy endless swinging fun, no matter the season. Come see for yourself!
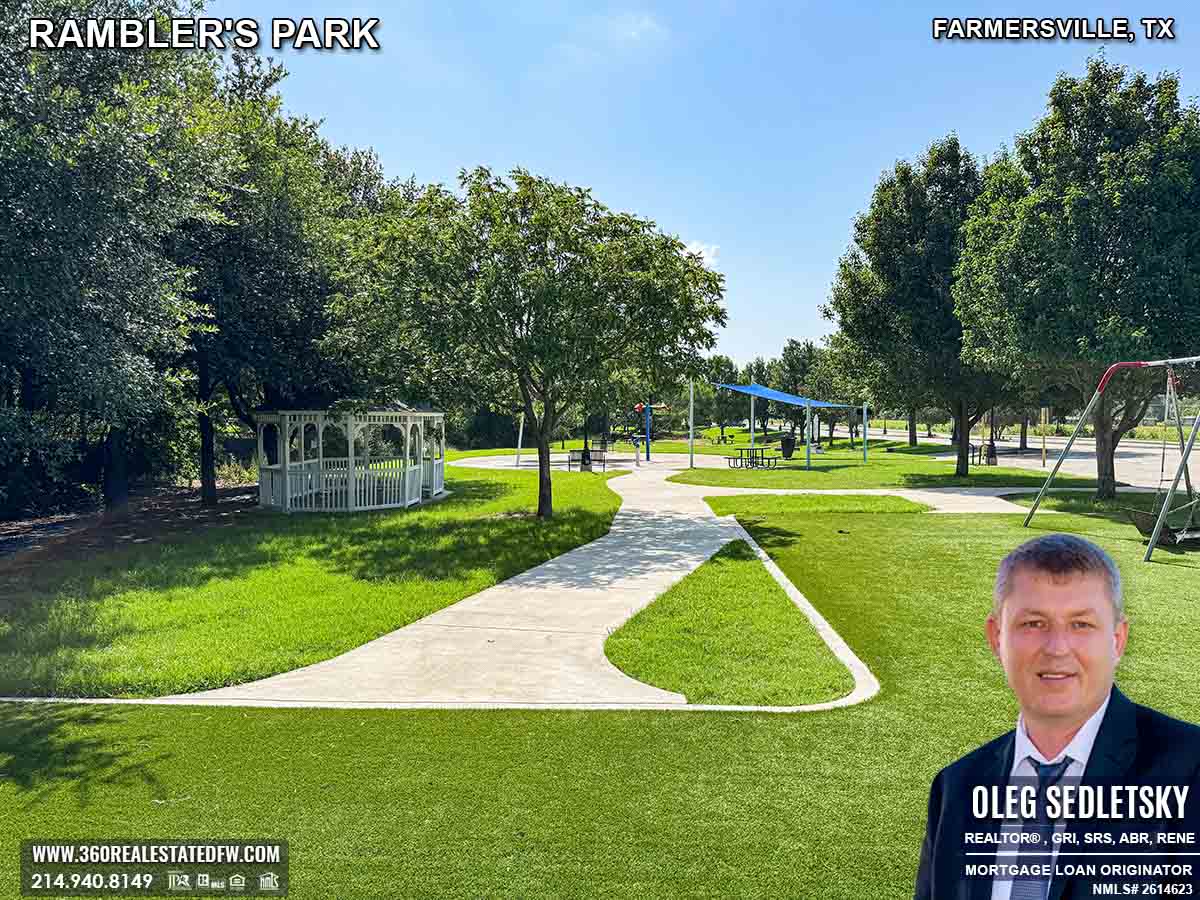
Rambler’s Park Amenities: Splash Pad
One of the park’s most celebrated features is its splash pad, perfect for families with kids who love water-based fun. The splash pad isn’t just a place to cool down; it’s a space where memories are made.
Curious about the splash pad? Head over to my Splash Pad article for all the details and some fun photos to inspire your visit!
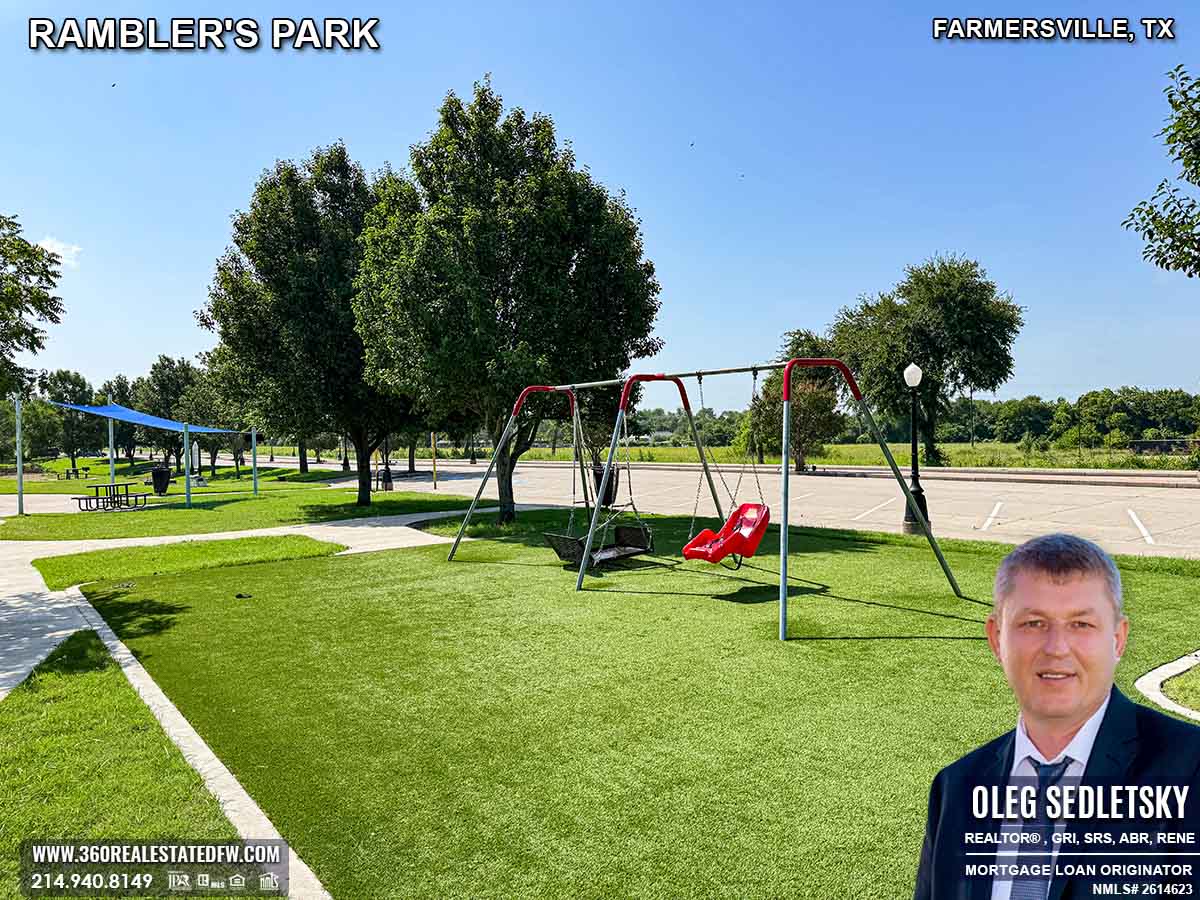
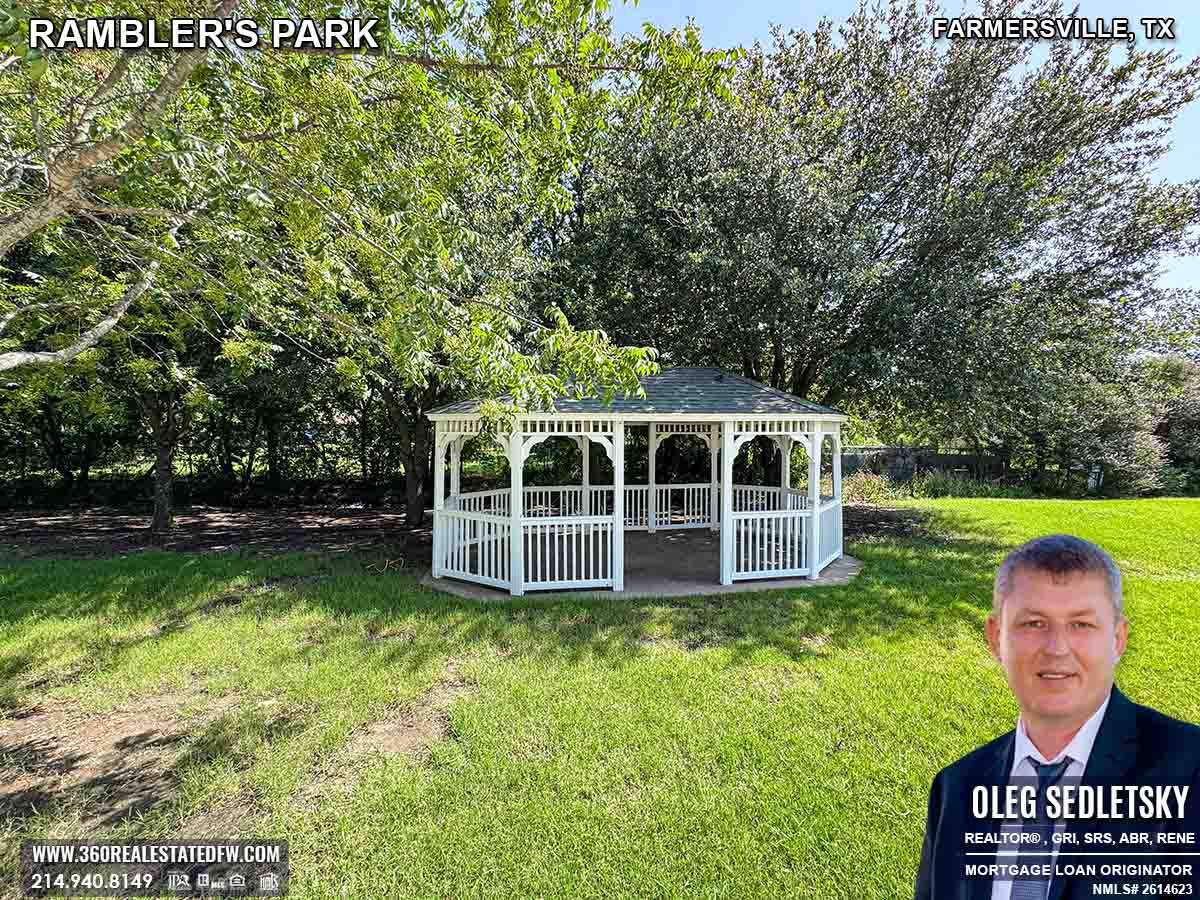
Rambler’s Park Amenities: Small Pavilion
Nestled right between the splash pad and swing sets, the pavilion is a great place to relax in the shade or let the kids play safely. It’s a cozy little hangout for everyone!
Move-In-Ready Homes and Great Living in Farmersville, TX!
Farmersville, TX is such a gem! You’ll find tons of move-in-ready homes here, whether you’re dreaming of a charming older house or a sparkling new build. Plus, the area is full of beautiful parks and fun places to explore, making it a fantastic spot to live and enjoy every moment.
I’m your local Realtor and Mortgage Expert, and I’m here to make your home-buying journey as smooth and stress-free as possible. I’m always happy to answer your questions, offer guidance, and help you find a home that feels just right for you.
Unlock Exceptional Service!
Assistance with all your real estate needs in the Dallas-Fort Worth area is just a click or call away. Reach out at 214-940-8149 or connect through the links below.
Rambler’s Park is Close to Farmersville, TX Historic Downtown (Only 0.3 Mile Away)
Rambler’s Park enjoys a prime location near the Farmersville, TX historic downtown area, a feature that adds cultural vibrancy and convenience to any visit. After your time in the park, you can easily venture into downtown for a bite to eat, some boutique shopping, or a stroll through the city’s historic streets.
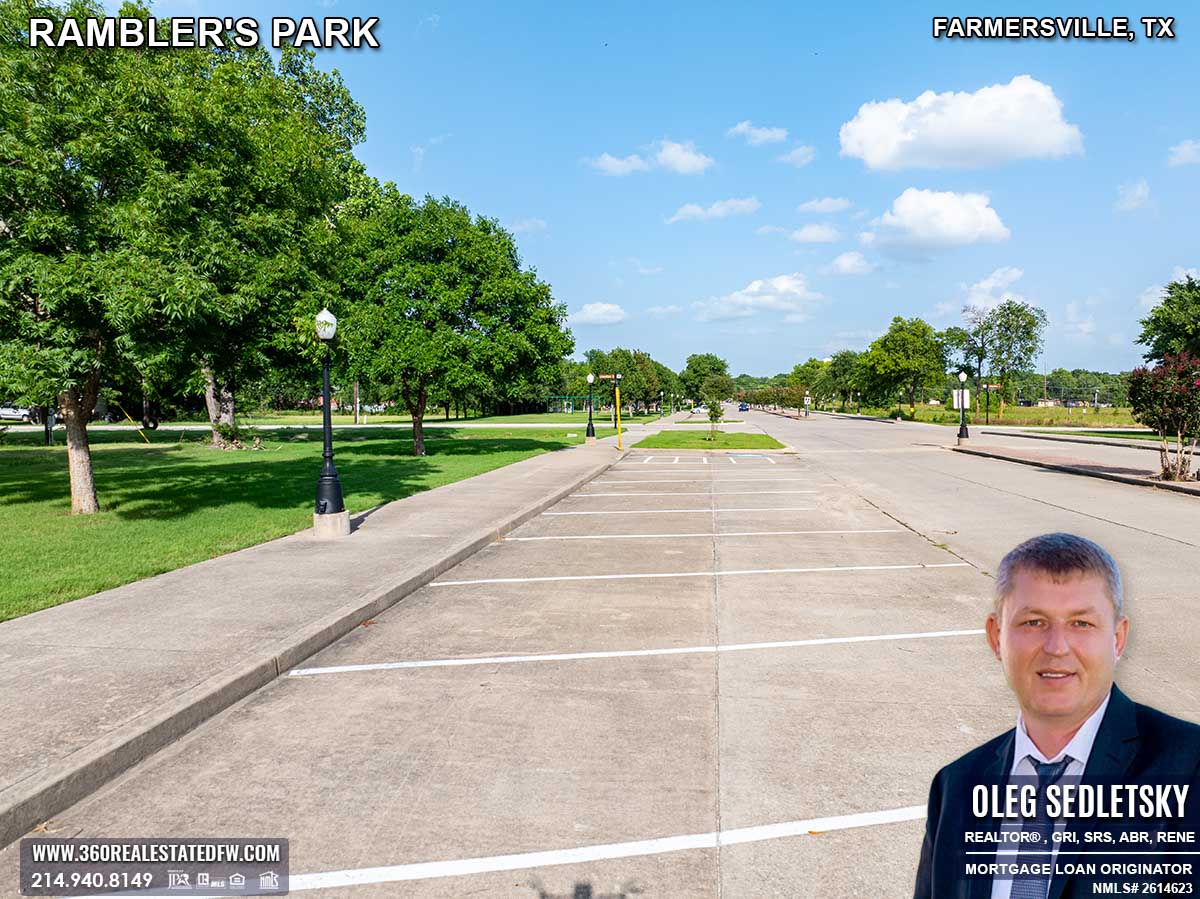
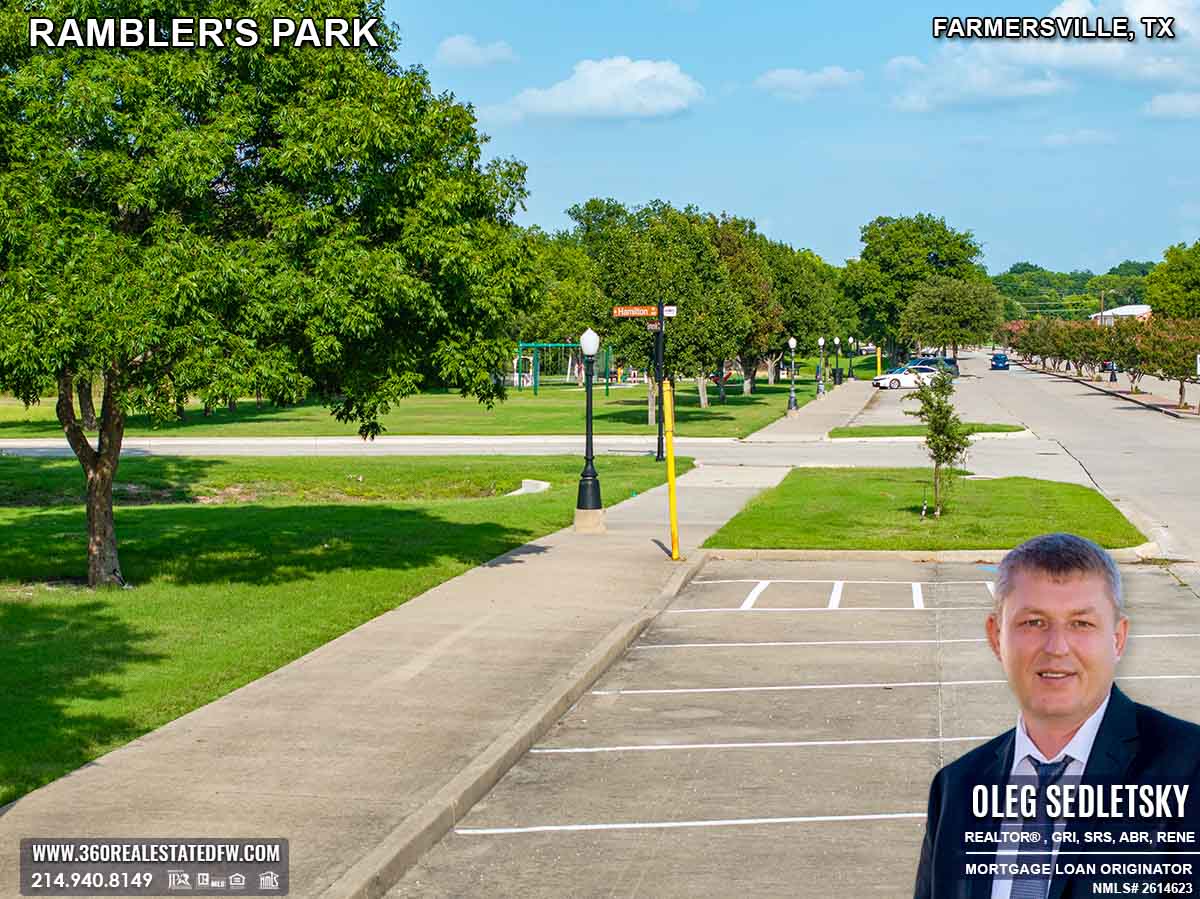
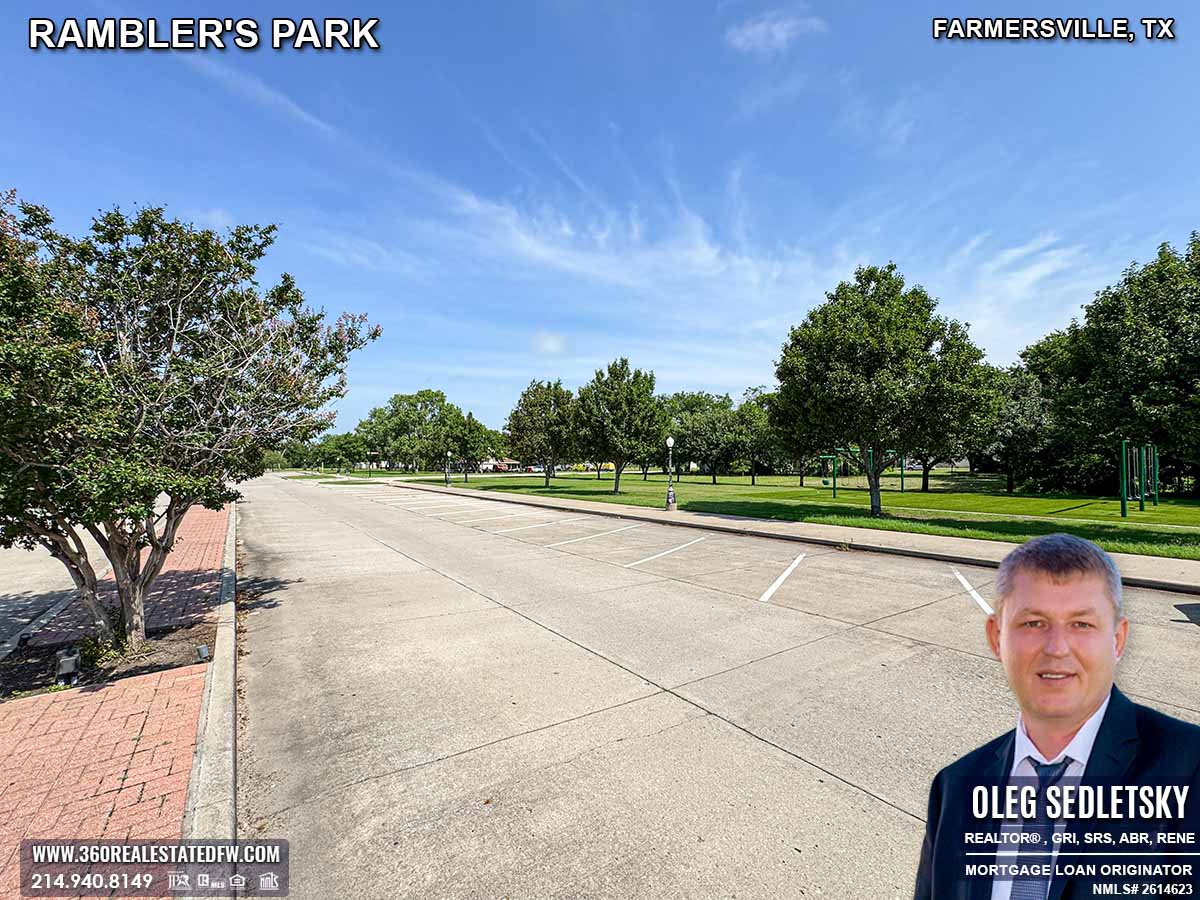
Rambler’s Park Amenities: Ample Parking for Hassle-Free Visits
No need to worry about where to park while visiting — the park offers ample parking space, with the additional option of using parking areas in the nearby historic downtown for busier days. This convenience makes the park easily accessible for everyone, whether you’re dropping by for a quick visit or planning to settle in for the day.
Plan Your Visit Today
Rambler’s Park warmly welcomes all who seek a mix of relaxation and adventure. Its family-friendly amenities, convenient location, and inviting atmosphere ensure that every visit is one to remember. Whether you’re making a splash on a hot summer’s day, engaging in some playground fun, or simply soaking in the serenity of the picnic areas, Rambler’s Park has something for everyone.
Final Thoughts: Why Rambler’s Park Stands Out
Sure, Rambler’s Park may not be the largest in Farmersville, TX, but it makes up for its modest size with its thoughtfully designed features and community appeal. Its unique amenities, such as the splash pad, artificial-grass swing sets, and shaded picnic areas, combine to offer an unforgettable recreational experience.
By providing a safe, fun, and well-maintained space, this park has become more than just a local feature—it’s a centerpiece of community connection. Residents and visitors alike come together here to create special moments, whether celebrating milestones or just enjoying a sunny afternoon outdoors.
Photo Gallery of Rambler’s Park in Farmersville, TX (over 40 photos)


Are you ready to experience the joy of homeownership in the vibrant Dallas-Fort Worth area?
Whether you’re in search of an existing home or a brand-new construction, rest assured that I’m here to assist you every step of the way.
With a dedicated Realtor by your side, the home-buying process becomes a breeze. Say goodbye to stress, and let me handle all the intricate details on your behalf.
Getting the guidance you need is as simple as filling out a brief questionnaire on my Homebuyers contact form. From there, I’ll take care of everything, ensuring a seamless and hassle-free journey towards finding your dream home.
Call/Text 214.940.8149
Dallas-Fort Worth Housing Market - Collin County Housing Market: Prices, Trends | May 2025
Housing Report for Dallas-Fort Worth-Arlington Metropolitan Statistical Area – May 2025
Single-Family Homes SUMMARY
Sales volume for single-family homes decreased 0.58% YoY from 8,779 to 8,728 transactions.
Year-to-date sales reached a total of 34,732 closed listings.
Dollar volume dipped from $4.67 billion to $4.54 billion.
The average sales price dipped 2.18% YoY from $531,956 to $520,386.
The average price per square foot subsequently declined from $214.82 to $209.64.
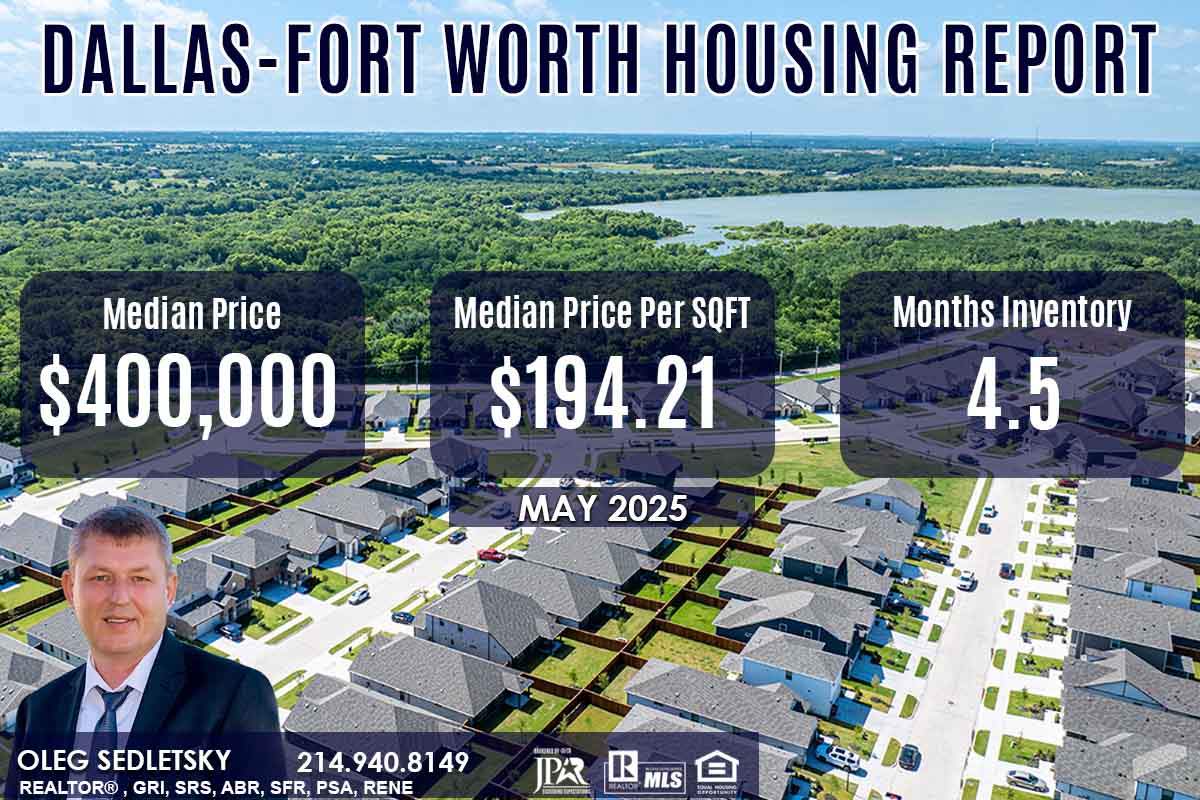
The median price declined 2.44% YoY from $410,000 to $400,000.
The median price per square foot also declined from $199.44 to $194.21.
Months inventory for single-family homes rose from 3.4 to 4.5 months supply.
Days to sell rose from 75 to 86.
—
(Days to Sell = Days on Market + Days to Close)
(YoY – Year-over-Year is a calculation commonly used in economics or financial data to show how information from one time period compares to the year prior. )
Dallas-Fort Worth Housing Report May 2025 (single family homes residential)
May 2025 | YoY %
Home Sales: 8,728 | -0.58%
Dollar Volume: $4,541,925,171 | -2.74%
Median Close Price: $400,000 | -2.44%
New Listings: 14,146 | 8.65%
Active Listings: 32,248 | 35.61%
Months Inventory: 4.5 | 33.32%
Days to Sell: 86 | 14.67%
Average Price PSF: $209.64 | -2.41%
Median Price PSF: $194.21 | -2.62%
Median Square Feet: 2,129 | 0.05%
Close to Original List Price: 95.53% | -1.57%
COLLIN COUNTY HOUSING REPORT – May 2025
May 2025 | YoY %
New Listings: 3,026 | + 21.6%
Average Sales Price: $583,075 | – 0.6%
Median Sales Price: $485,000 | – 4.9%
Days on Market Until Sale: 50 | + 35.1%
Inventory of Homes for Sale: 6,679 | + 57.6%
Months Supply of Inventory: 4.9 | + 48.5%
Close to Original List Price: 95.2% | – 2.3%
Note! Sales Prices do not include prices from any previous listing contracts or seller concessions.
Relocating to Dallas-Fort Worth?
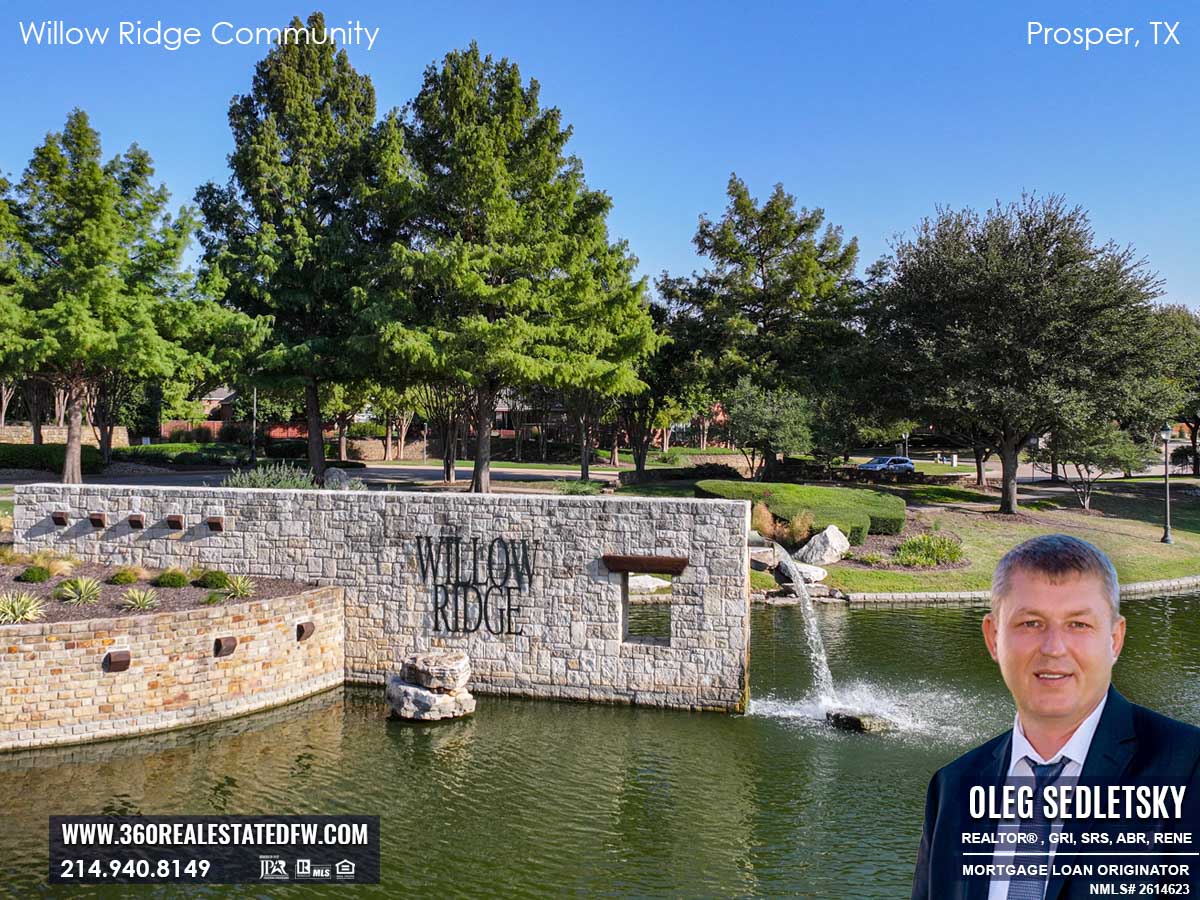
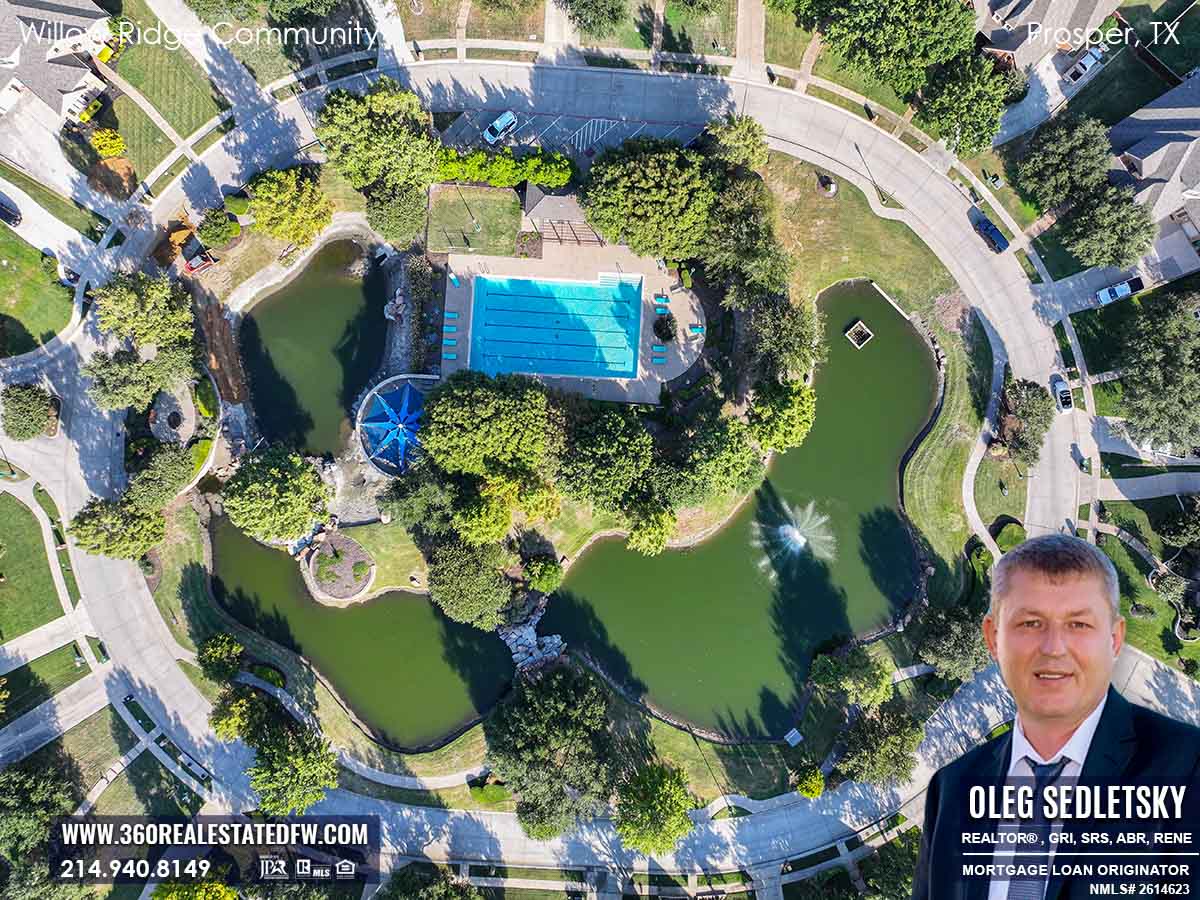
Consider Willow Ridge community in Prosper, Texas
Welcome to the vibrant Willow Ridge community, future homeowners! You’re about to explore a unique blend of luxury, convenience, and a family-friendly atmosphere. Nestled in the heart of Town of Prosper, TX, the Willow Ridge community offers a lifestyle that’s both dynamic and serene. I’m Oleg Sedletsky, your go-to Realtor and Mortgage Loan Originator in Prosper, Texas, and I’m excited to introduce you to the remarkable features and benefits here at Willow Ridge. Let’s dive into all that this amazing community has to offer!
Prosper, TX is located in Collin County Texas and is part of Dallas-Fort Worth metropolitan area.

About the data used in this report
Data used in Dallas-Fort Worth- Arlington report come from Texas Realtor® Data Relevance Project, a partnership between the Texas Association of Realtors® and local Realtor® associations throughout the state. The analysis is provided through a research agreement with the Real Estate Center at Texas A&M University
Data used in Collin County report come from North Texas Real Estate Information Services, Inc.
You may also be interested in:
Latest from Dallas Real Estate Blog
– Texas Homebuyers Tips, Tricks and Lifehacks
– New Construction Homes in Dallas TX
– Texas Home Sellers Tips, Tricks and Lifehacks
– Mortgages for Homebuyers and Investors in Dallas-Fort Worth
Dallas-Fort Worth Relocation Guide
Explore an important information for Home Sellers in the Dallas-Fort Worth area
Explore an important information for Home Buyers in the Dallas-Fort Worth area
2025
Dallas-Fort Worth Housing Market – Collin County Housing Market: Prices and Trends | January 2025
Dallas-Fort Worth Housing Market – Collin County Housing Market: Prices and Trends | February 2025
Dallas-Fort Worth Housing Market – Collin County Housing Market: Prices and Trends | March 2025
Dallas-Fort Worth Housing Market – Collin County Housing Market: Prices and Trends | April 2025
Dallas-Fort Worth Housing Market – Collin County Housing Market: Prices and Trends | May 2025
Dallas-Fort Worth Housing Market – Collin County Housing Market: Prices and Trends | June 2025
Dallas-Fort Worth Housing Market – Collin County Housing Market: Prices and Trends | July 2025
Dallas-Fort Worth Housing Market – Collin County Housing Market: Prices and Trends | August 2025
Dallas-Fort Worth Housing Market – Collin County Housing Market: Prices and Trends | September 2025
Dallas-Fort Worth Housing Market – Collin County Housing Market: Prices and Trends | October 2025
Dallas-Fort Worth Housing Market – Collin County Housing Market: Prices and Trends | November 2025
Dallas-Fort Worth Housing Market – Collin County Housing Market: Prices and Trends | December 2025
2024
Dallas-Fort Worth Housing Market: Prices and Trends | December 2024
Dallas-Fort Worth Housing Market: Prices and Trends | November 2024
Dallas-Fort Worth Housing Market: Prices and Trends | October 2024
Dallas-Fort Worth Market: Prices and Trends | September 2024
Dallas-Fort Worth Housing Market: Prices and Trends | August 2024
Dallas-Fort Worth Housing Market: Prices and Trends | July 2024
Dallas-Fort Worth Housing Market: Prices and Trends | June 2024
Dallas-Fort Worth Housing Market: Prices and Trends | May 2024
Dallas-Fort Worth Housing Market: Prices and Trends | April 2024
Dallas-Fort Worth Housing Market: Prices and Trends | March 2024
Dallas-Fort Worth Housing Market: Prices and Trends | February 2024
Dallas-Fort Worth Housing Market: Prices and Trends | January 2024
2023
Dallas-Fort Worth Housing Market: Prices and Trends | December 2023
Dallas-Fort Worth Housing Market: Prices and Trends | November 2023
Dallas-Fort Worth Housing Market: Prices and Trends | October 2023
Dallas-Fort Worth Housing Market: Prices and Trends | September 2023
Dallas-Fort Worth Housing Market: Prices and Trends | August 2023
Dallas-Fort Worth Housing Market: Prices and Trends | July 2023
Dallas-Fort Worth Housing Market: Prices and Trends | June 2023
Dallas-Fort Worth Housing Market: Prices and Trends | May 2023
Dallas-Fort Worth Housing Market: Prices and Trends | April 2023
Dallas-Fort Worth Housing Market: Prices and Trends | March 2023
Dallas-Fort Worth Housing Market: Prices and Trends | February 2023
Dallas-Fort Worth Housing Market: Prices and Trends | January 2023
2022
Dallas-Fort Worth Housing Market: Prices and Trends | December 2022
Dallas-Fort Worth Housing Market: Prices and Trends | November 2022
Dallas-Fort Worth Housing Market: Prices and Trends | October 2022
Dallas-Fort Worth Housing Market: Prices and Trends | September 2022
Dallas-Fort Worth Housing Market: Prices and Trends | August 2022
Dallas-Fort Worth Housing Market: Prices and Trends | July 2022
Dallas-Fort Worth Housing Market: Prices and Trends | June 2022
Dallas-Fort Worth Housing Market: Prices and Trends | May 2022
Dallas-Fort Worth Housing Market: Prices and Trends | April 2022
Dallas-Fort Worth Housing Market: Prices and Trends | March 2022
Dallas-Fort Worth Housing Market: Prices and Trends | February 2022
Dallas-Fort Worth Housing Market: Prices and Trends | January 2022
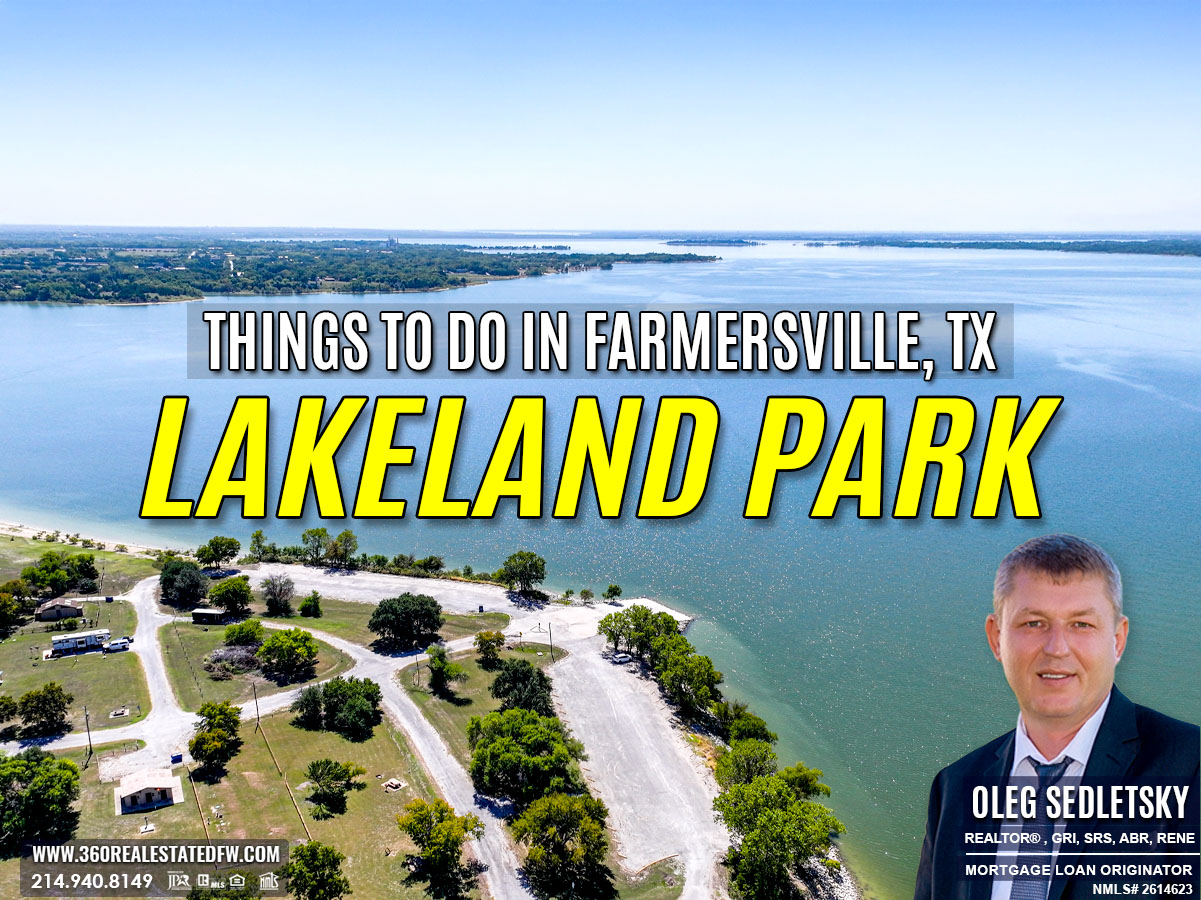
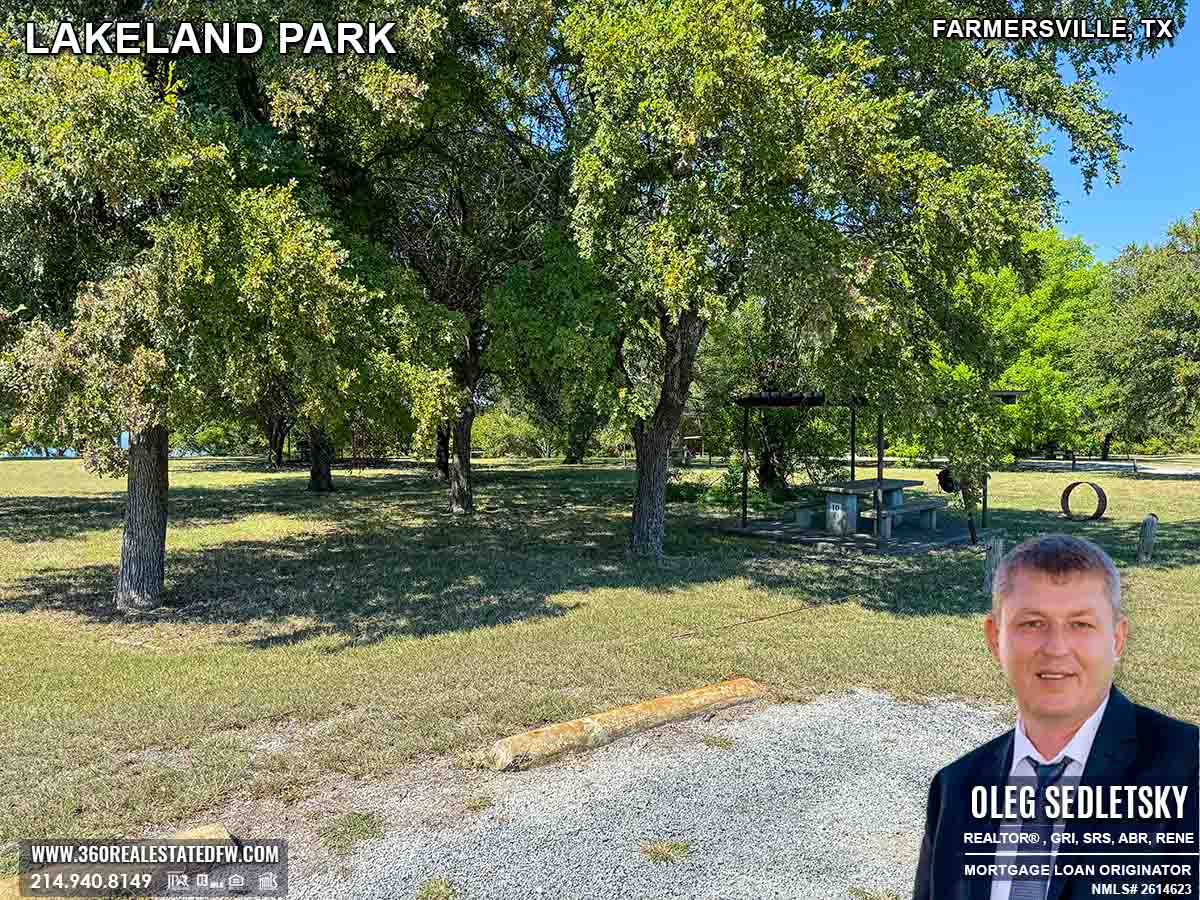
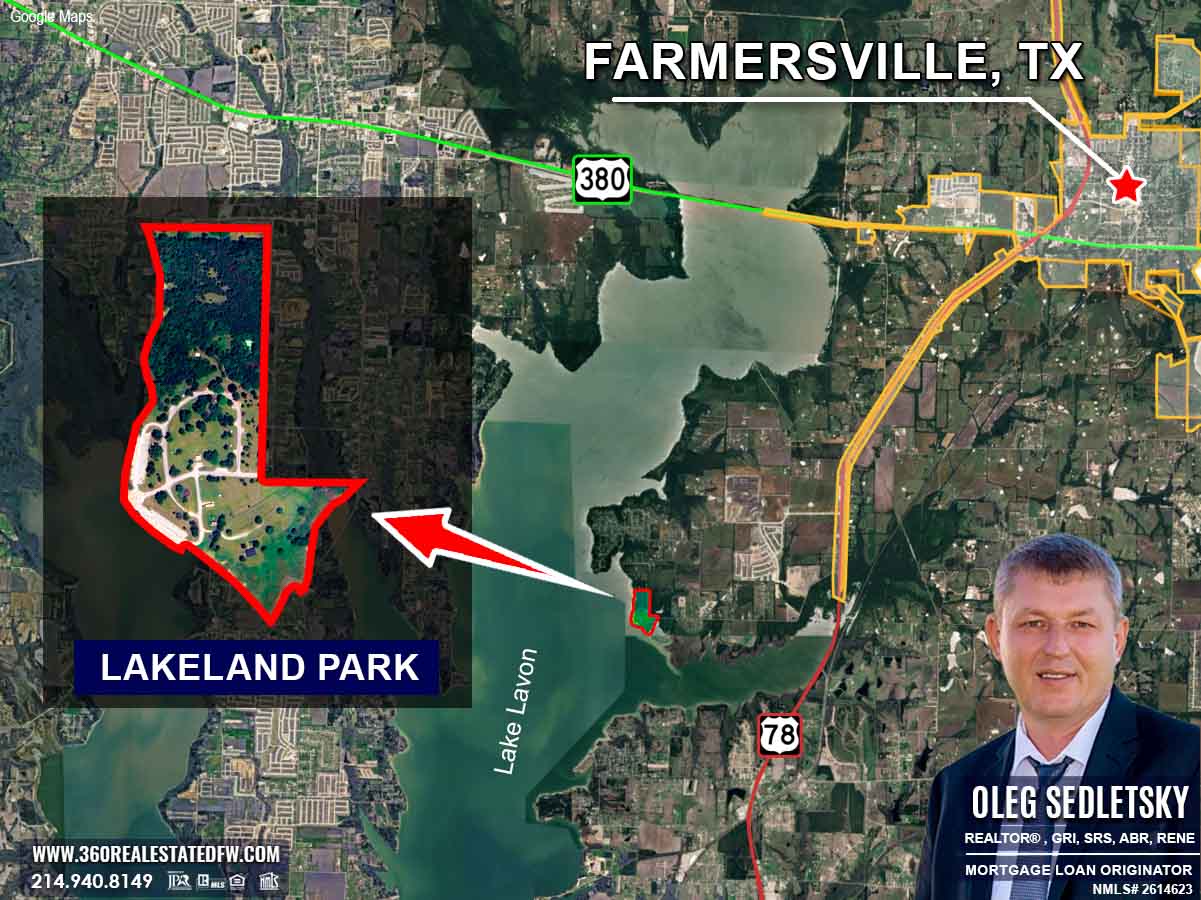
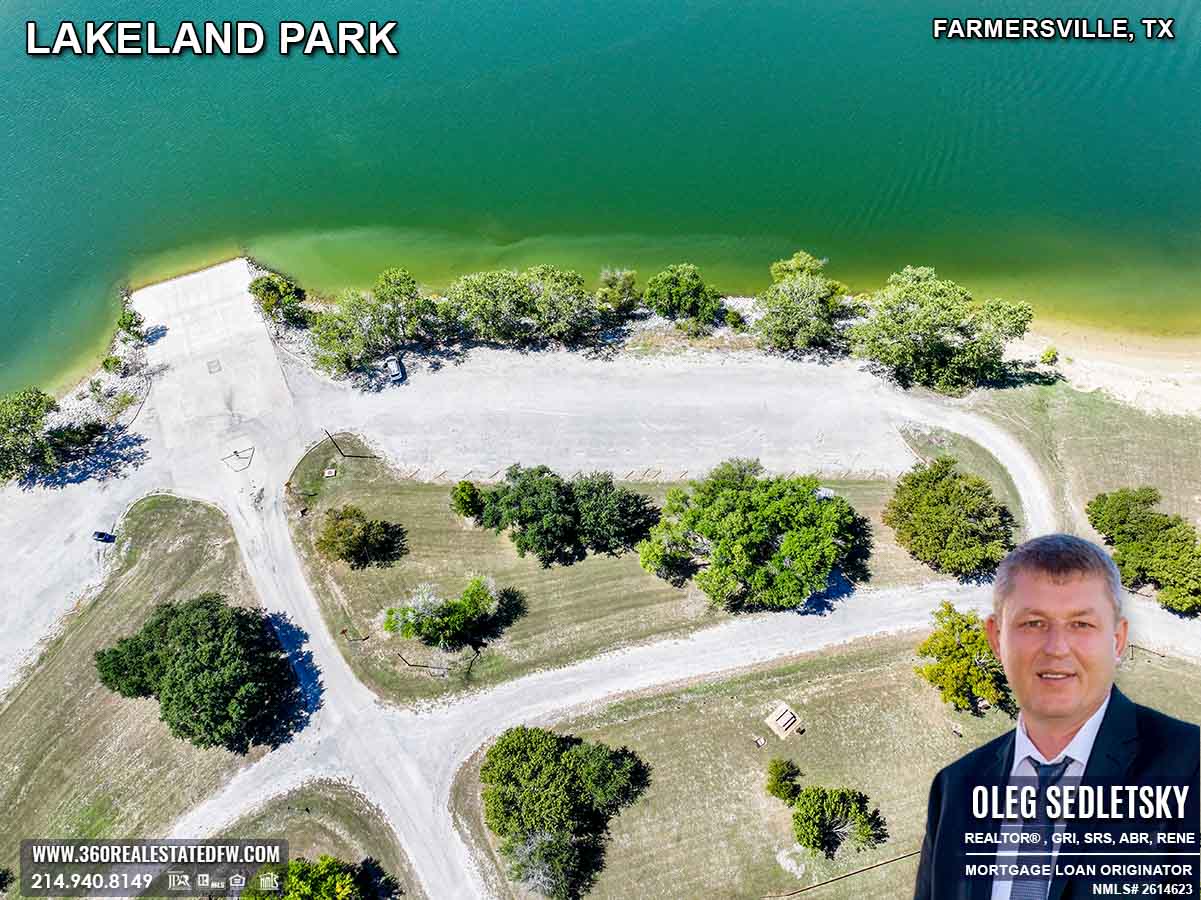
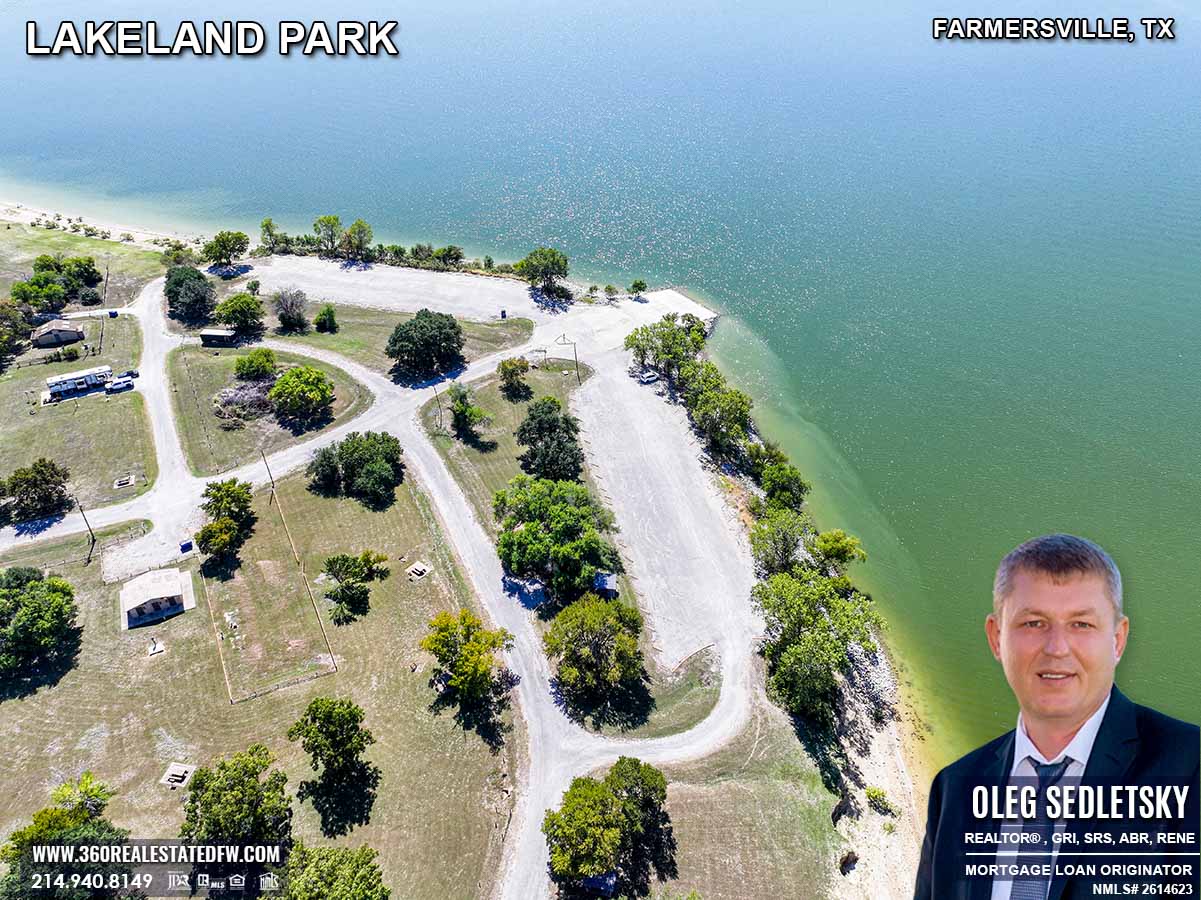
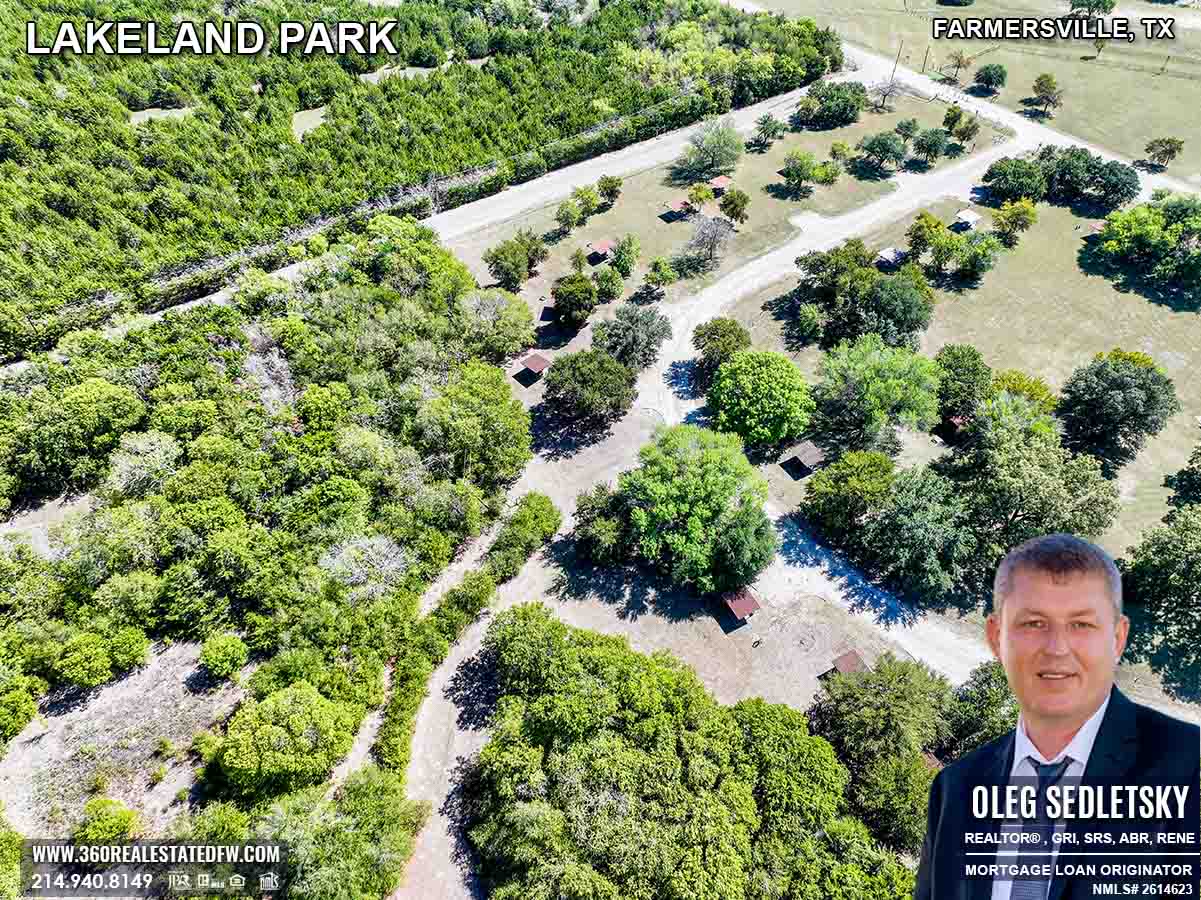
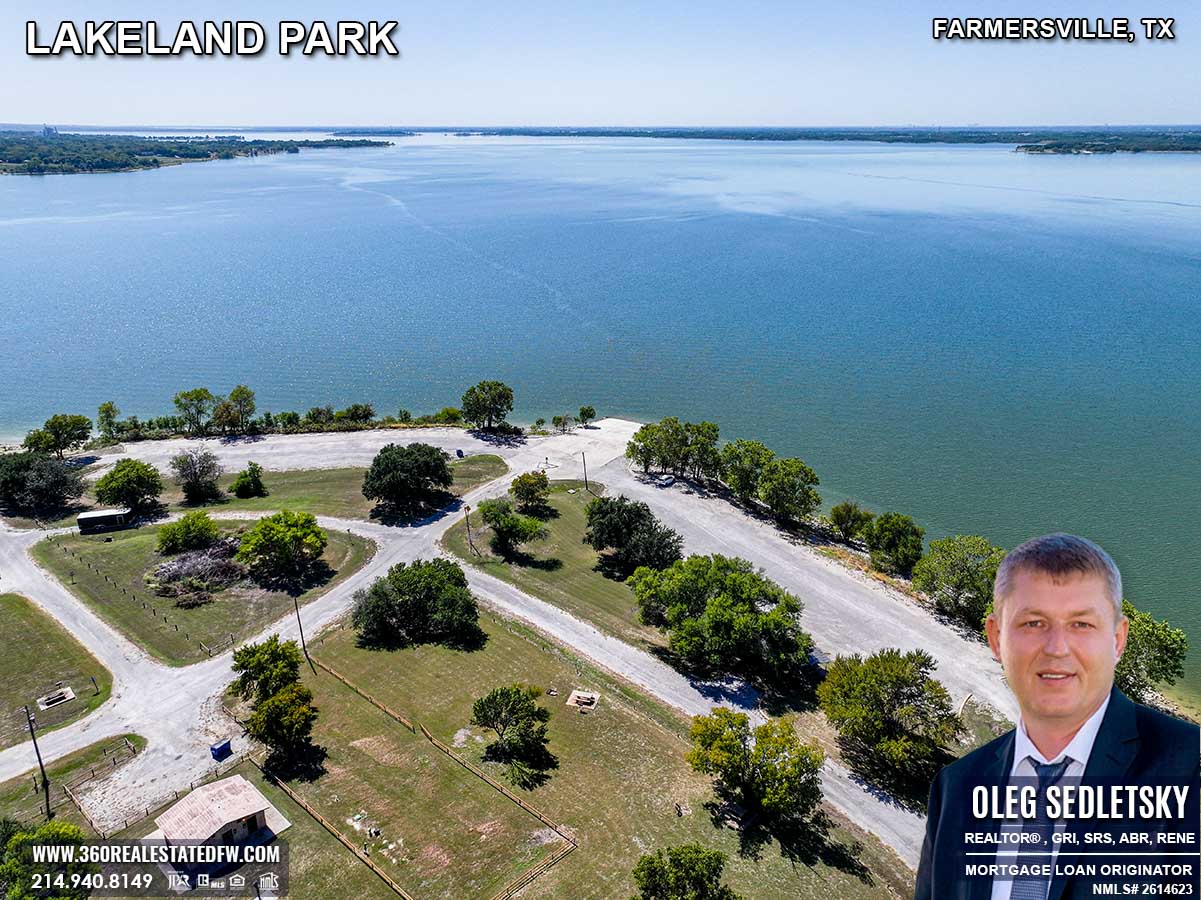
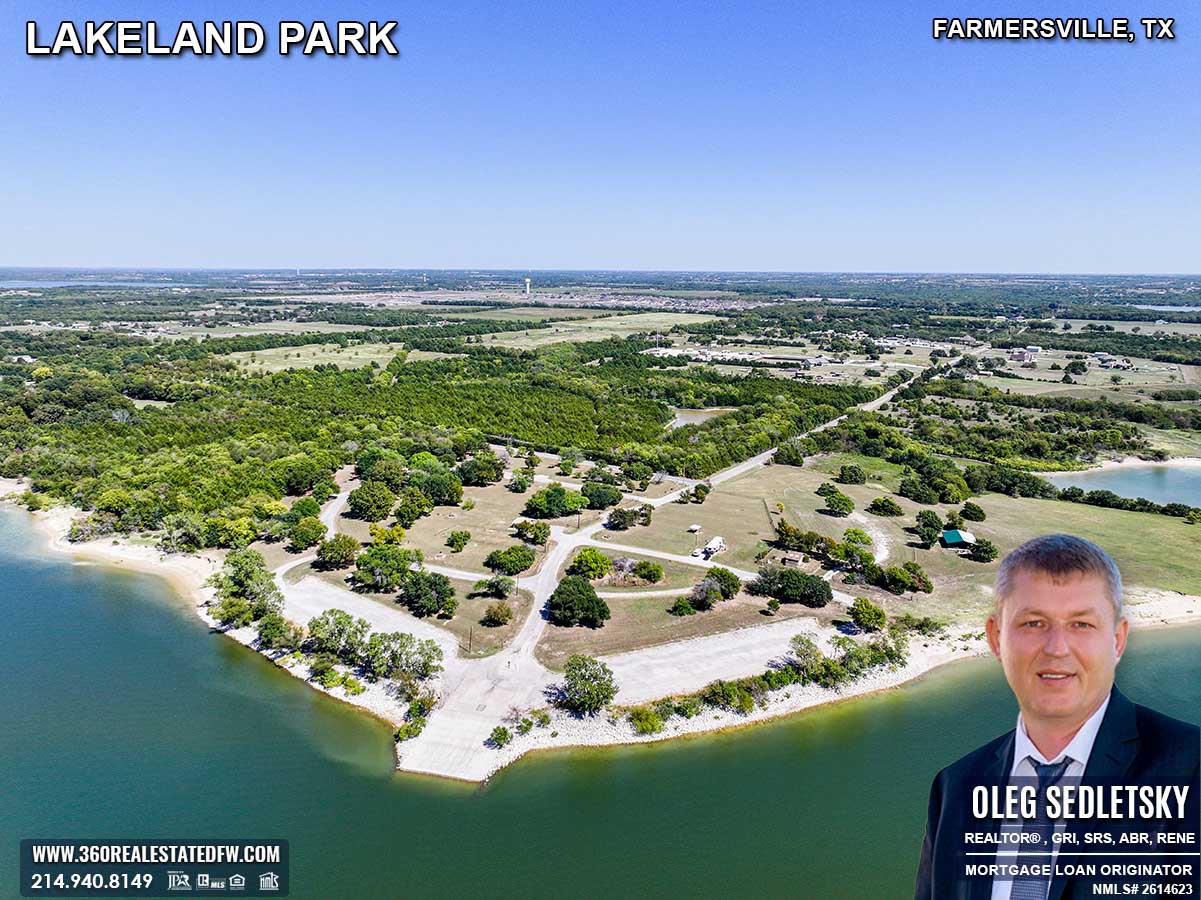
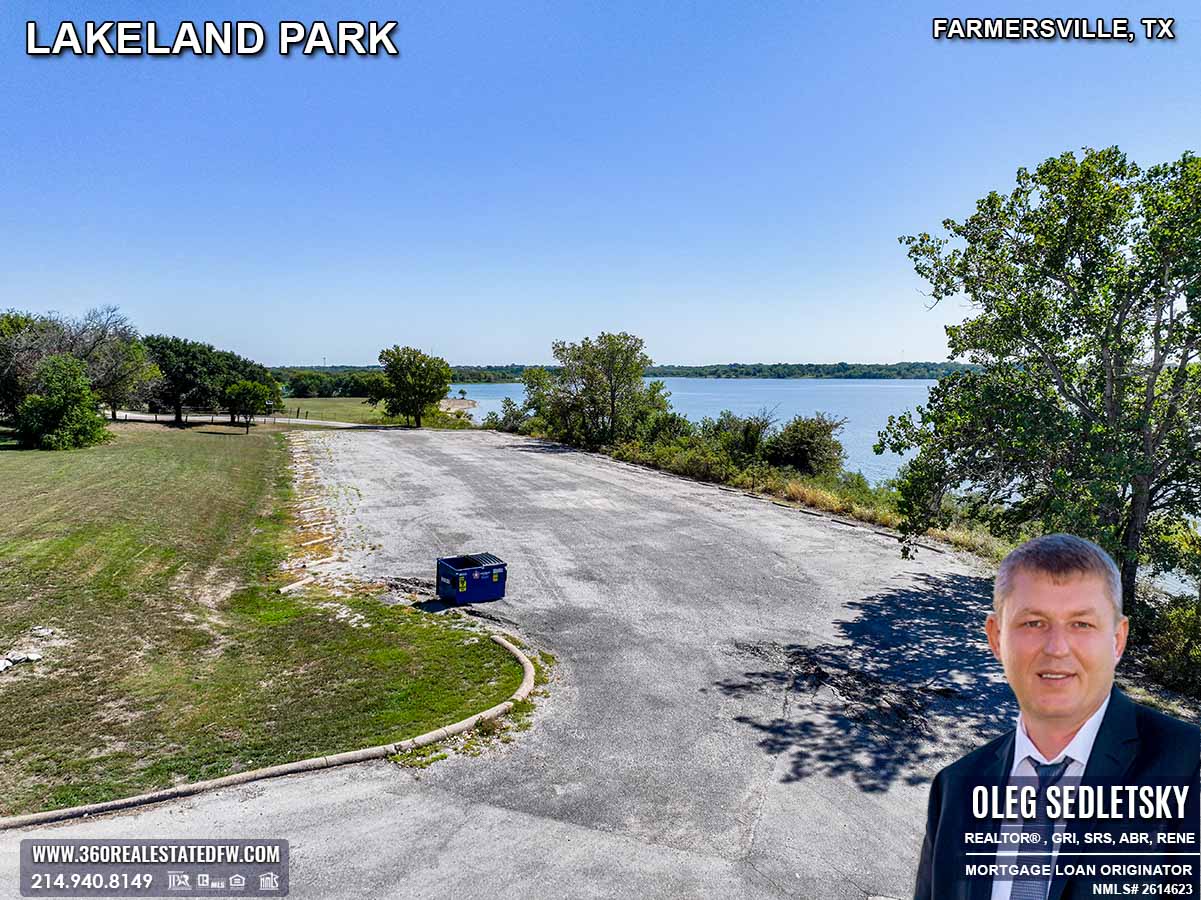
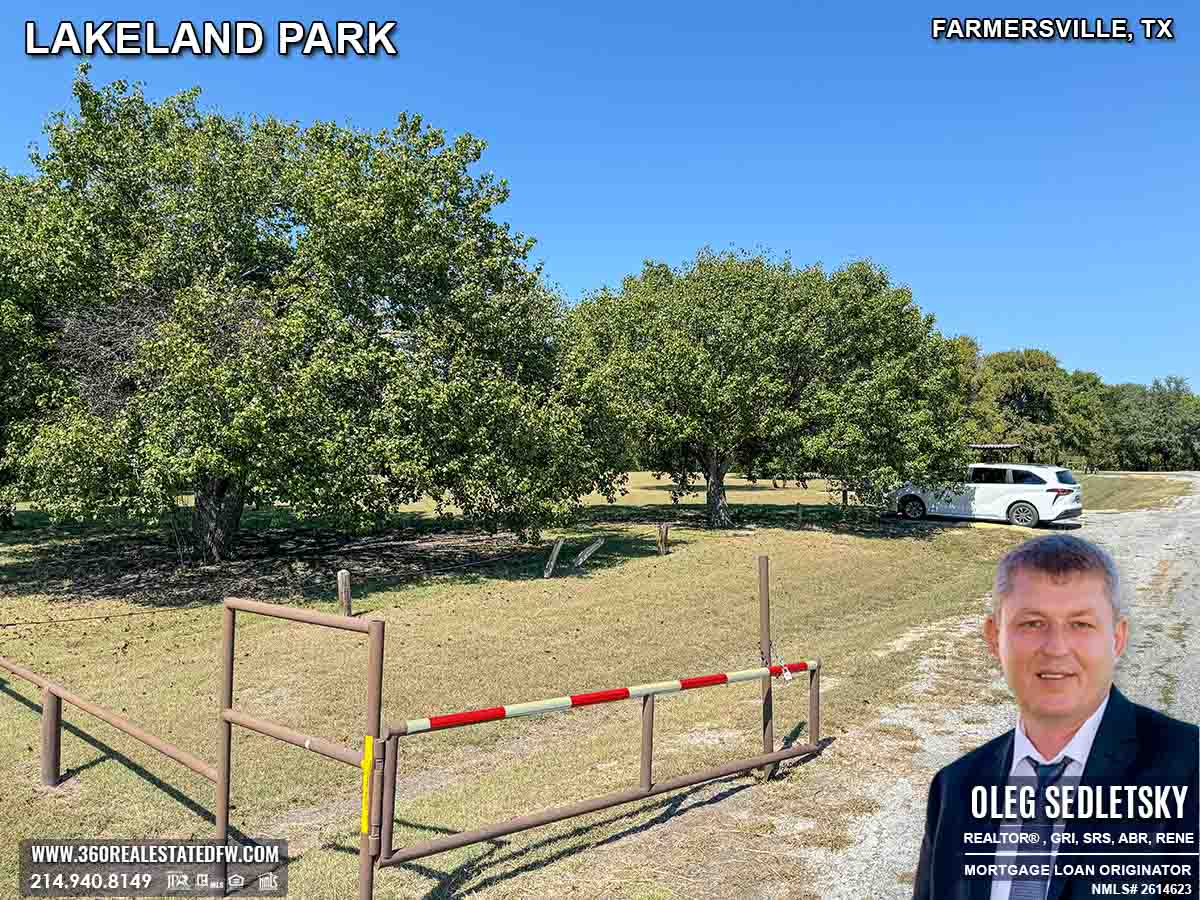
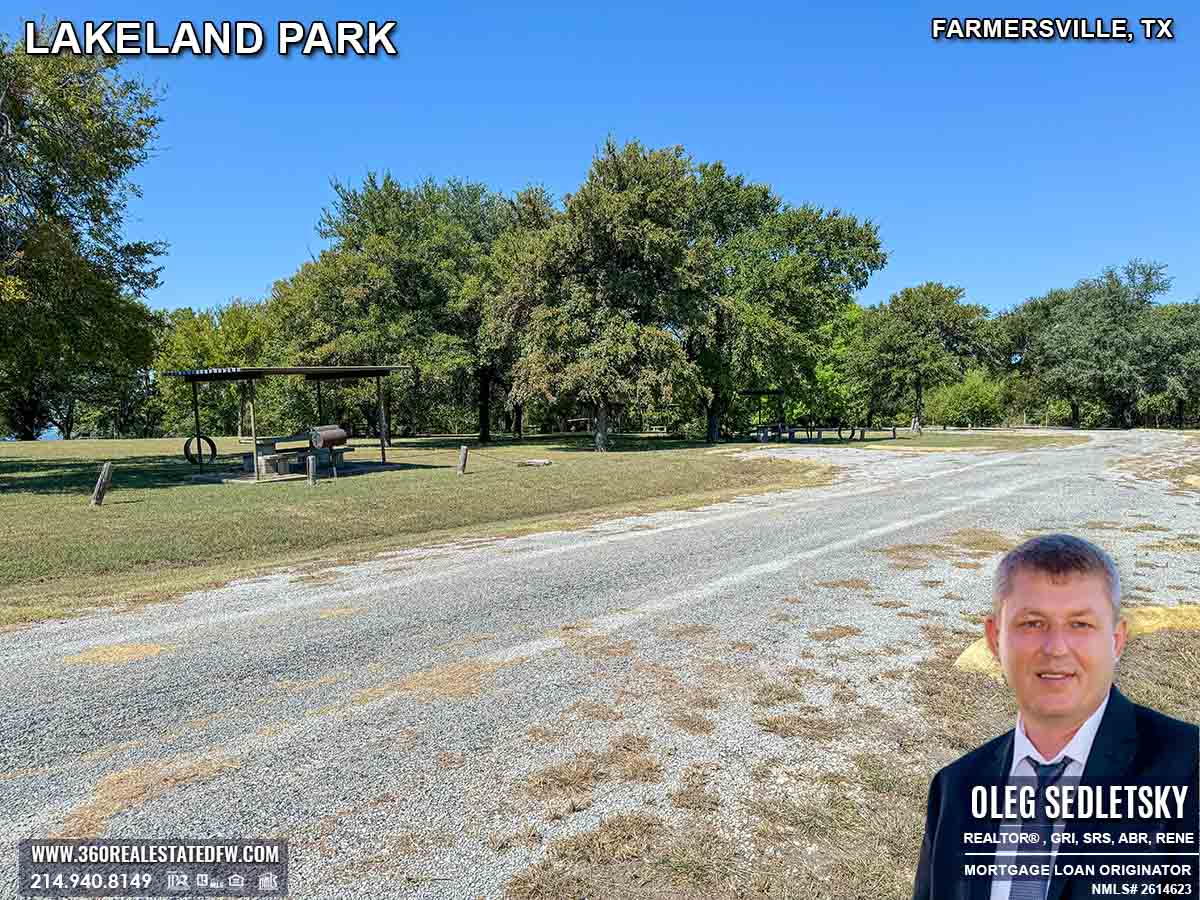
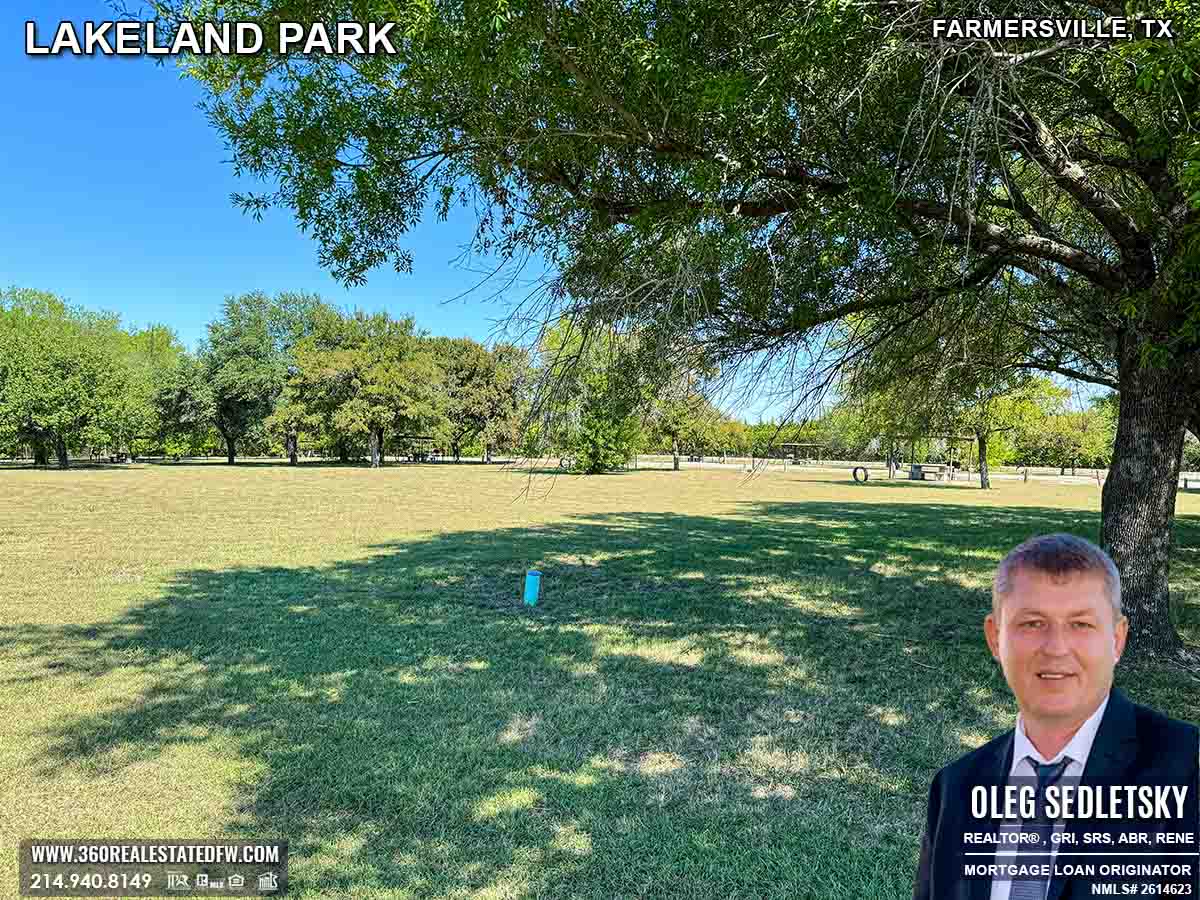
Things to do in Farmersville, TX - Lakeland Park - Picnicking, Boating, Fishing - Lavon Lake outdoor recreation - Over 100 photos
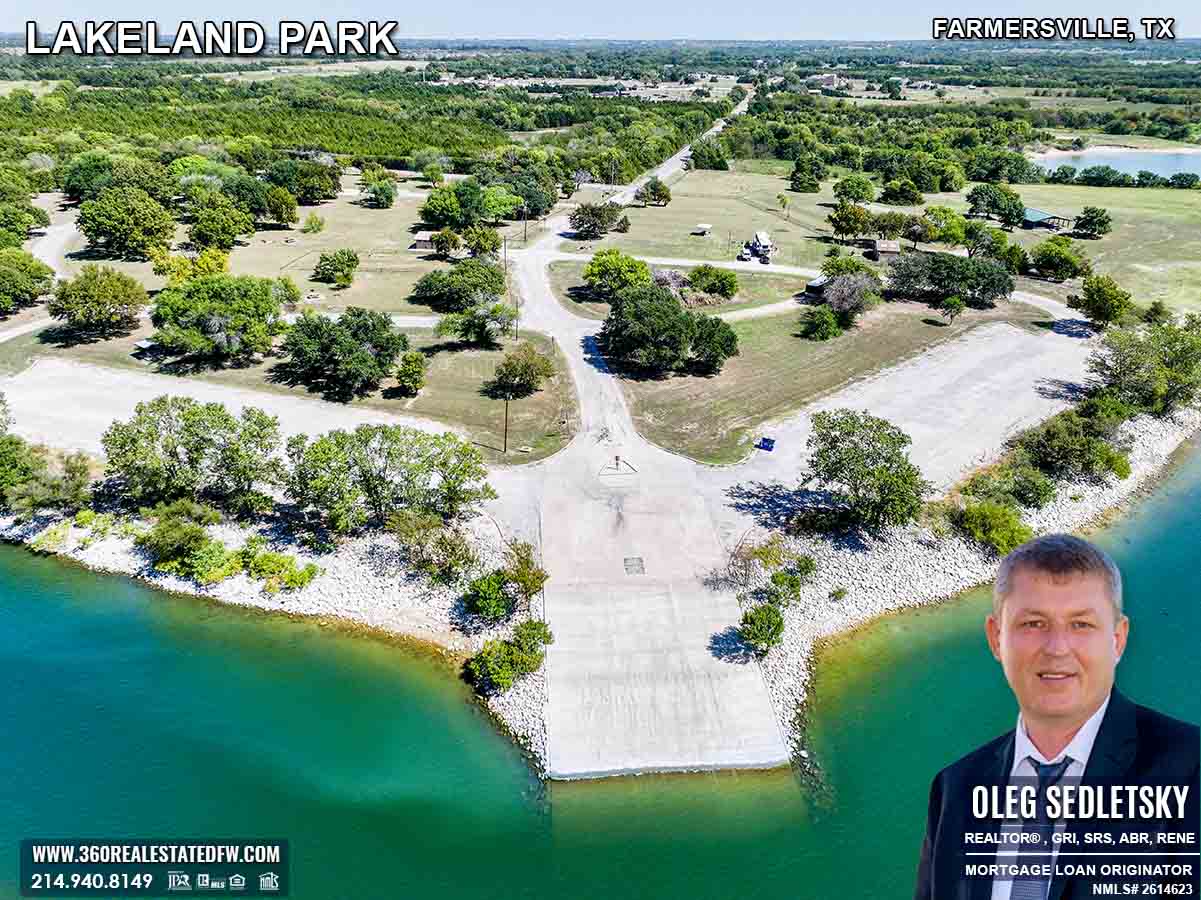
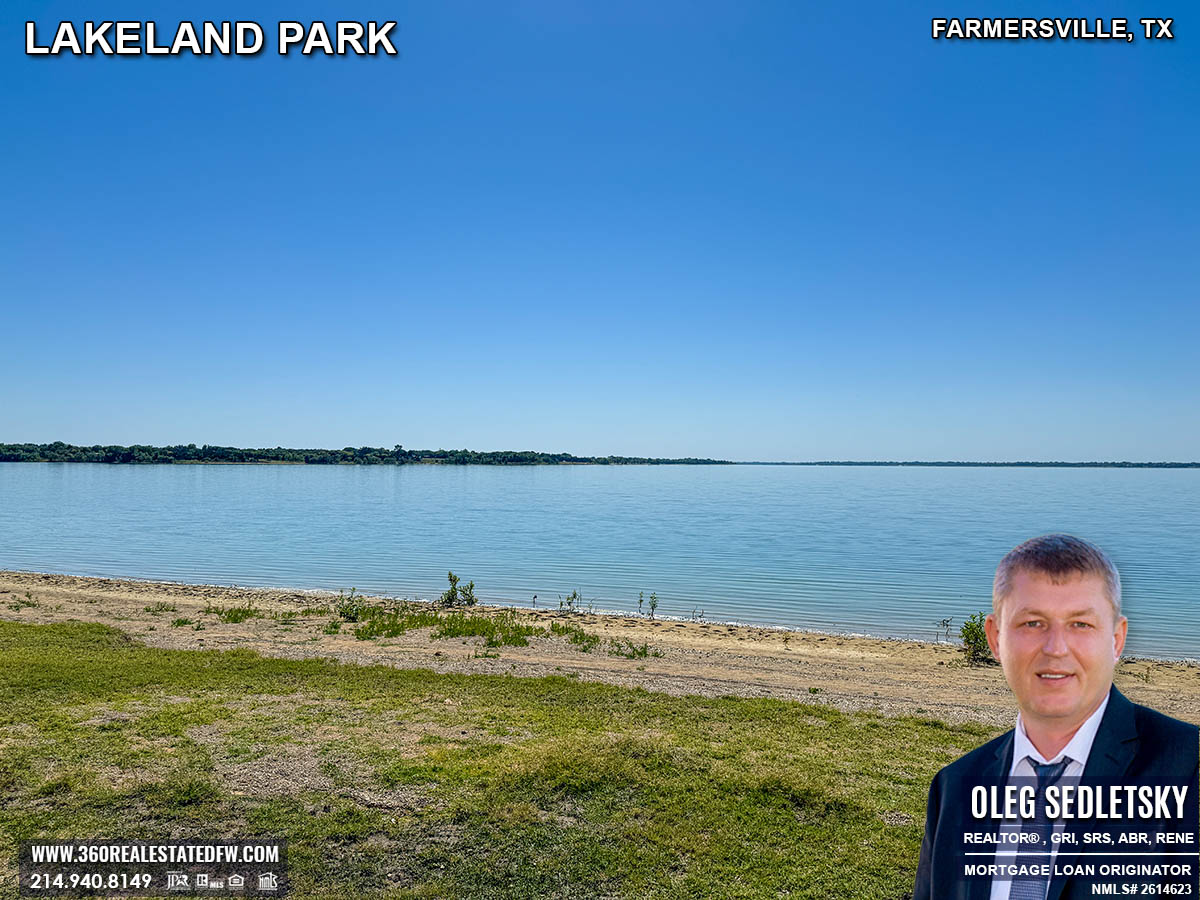
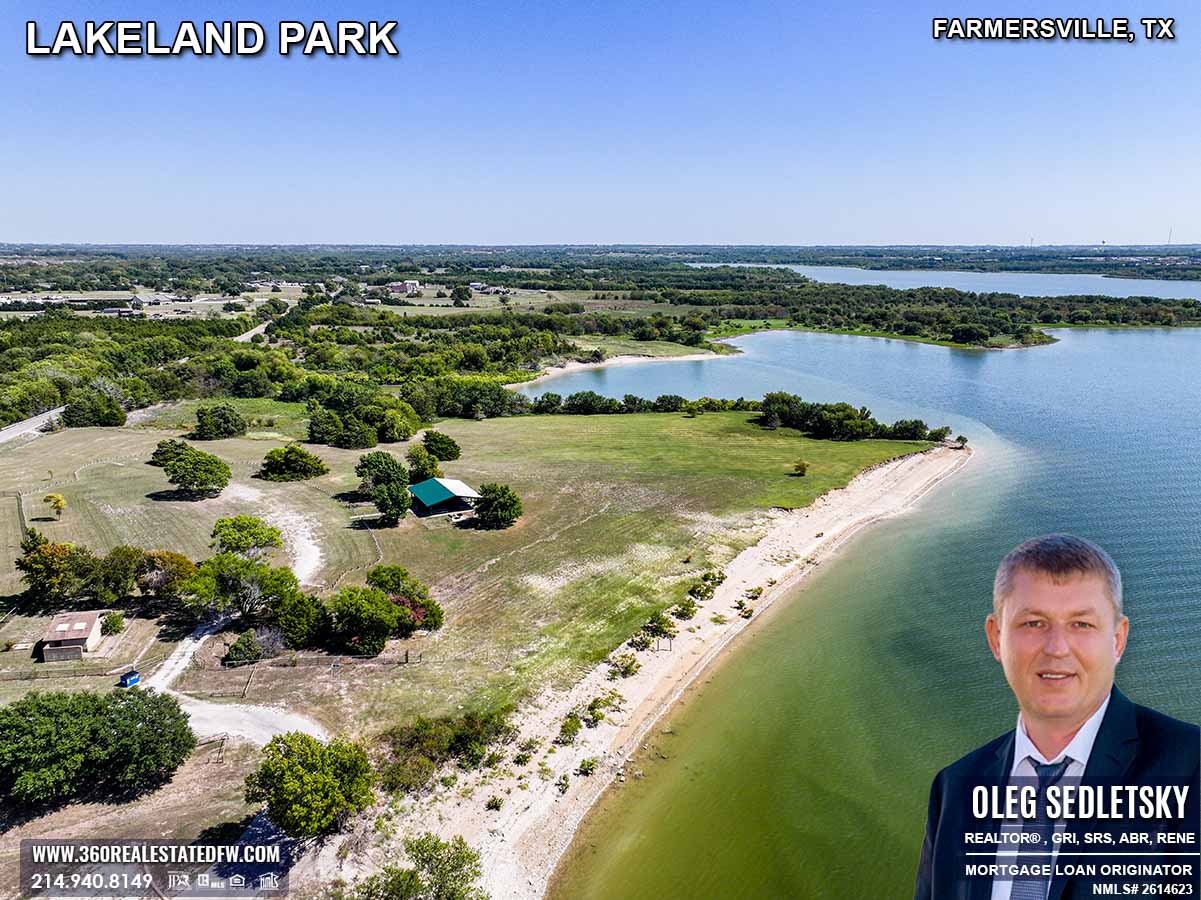
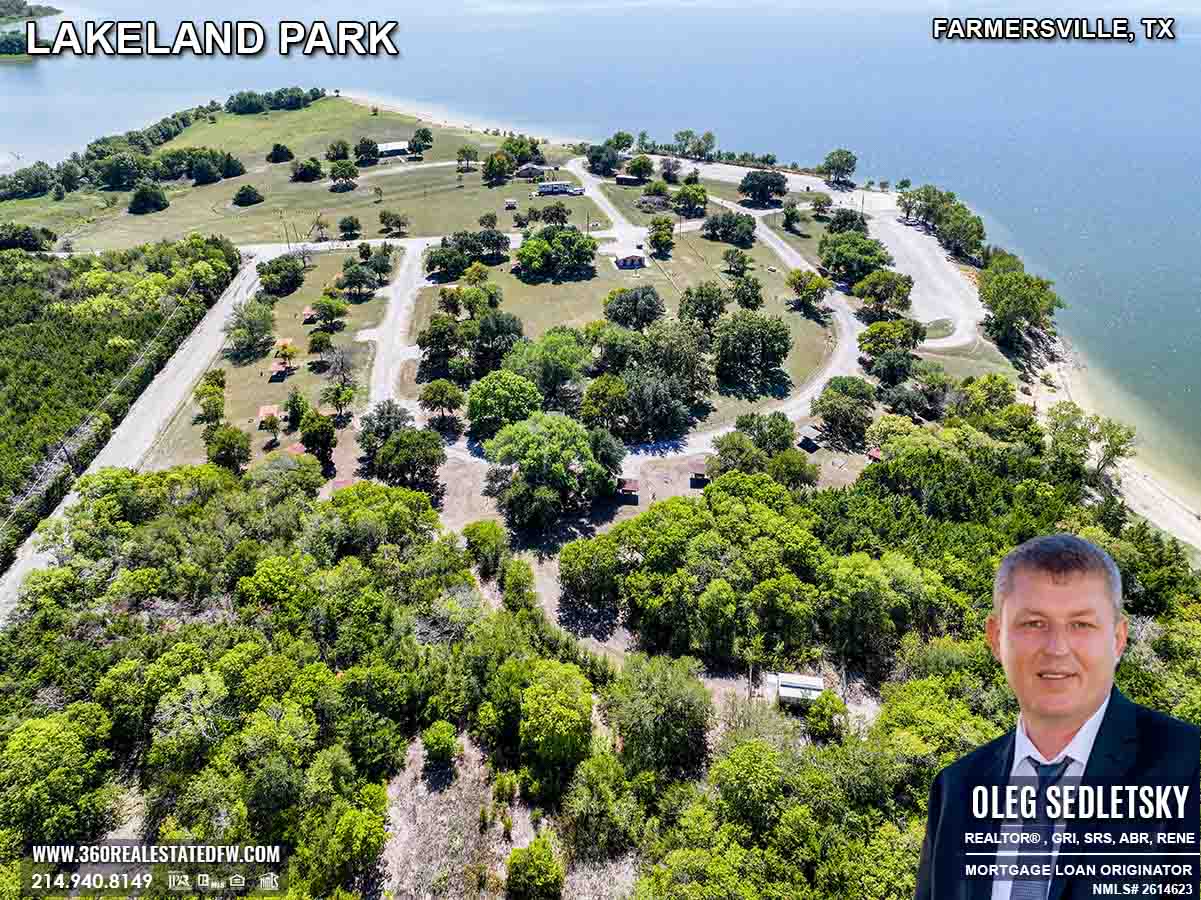
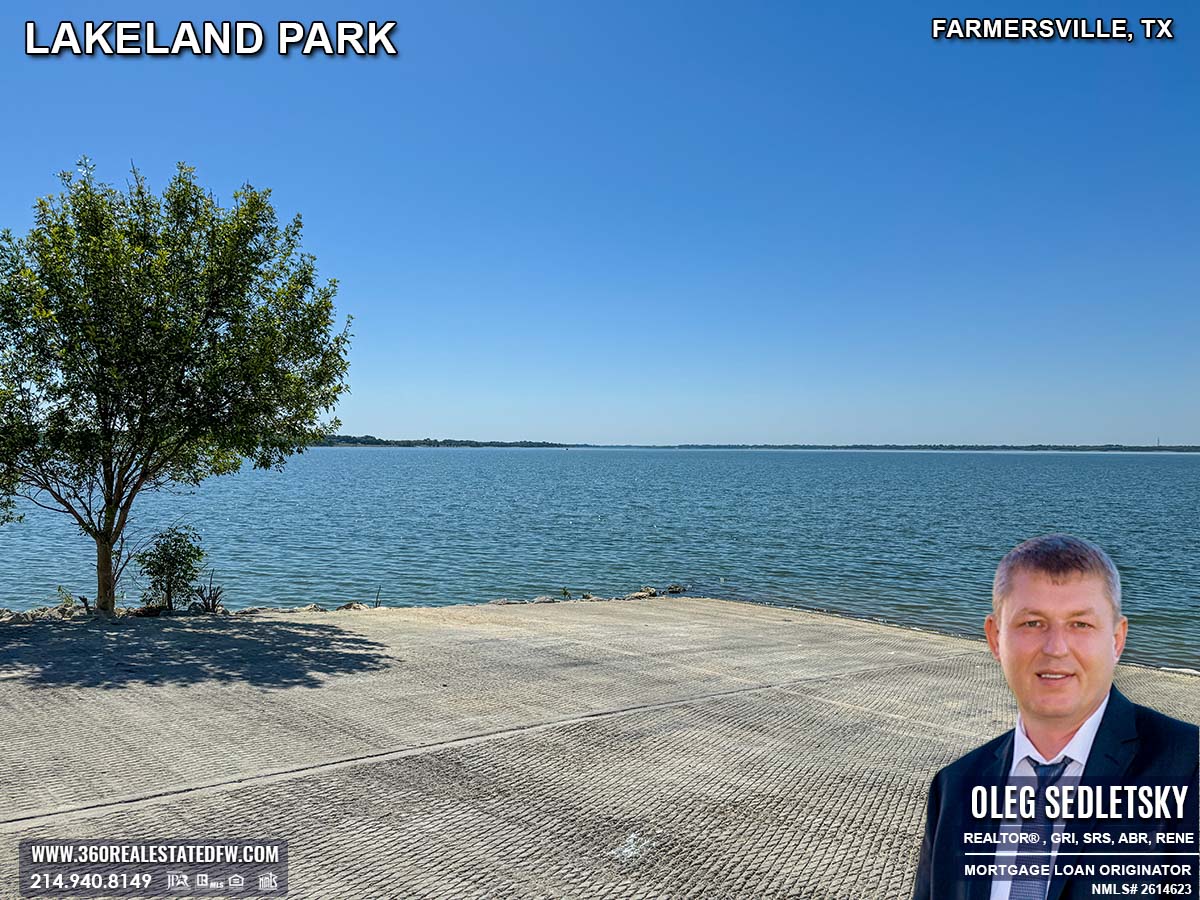
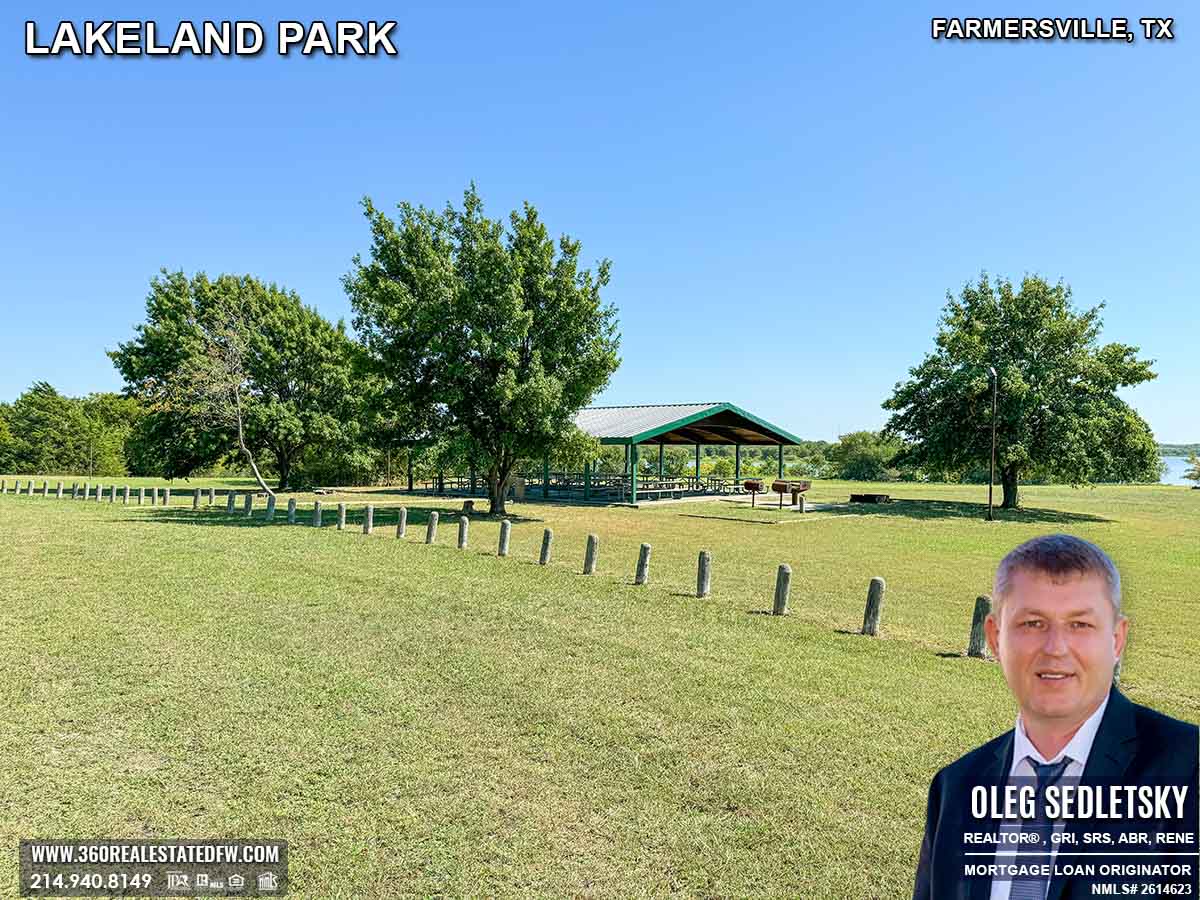
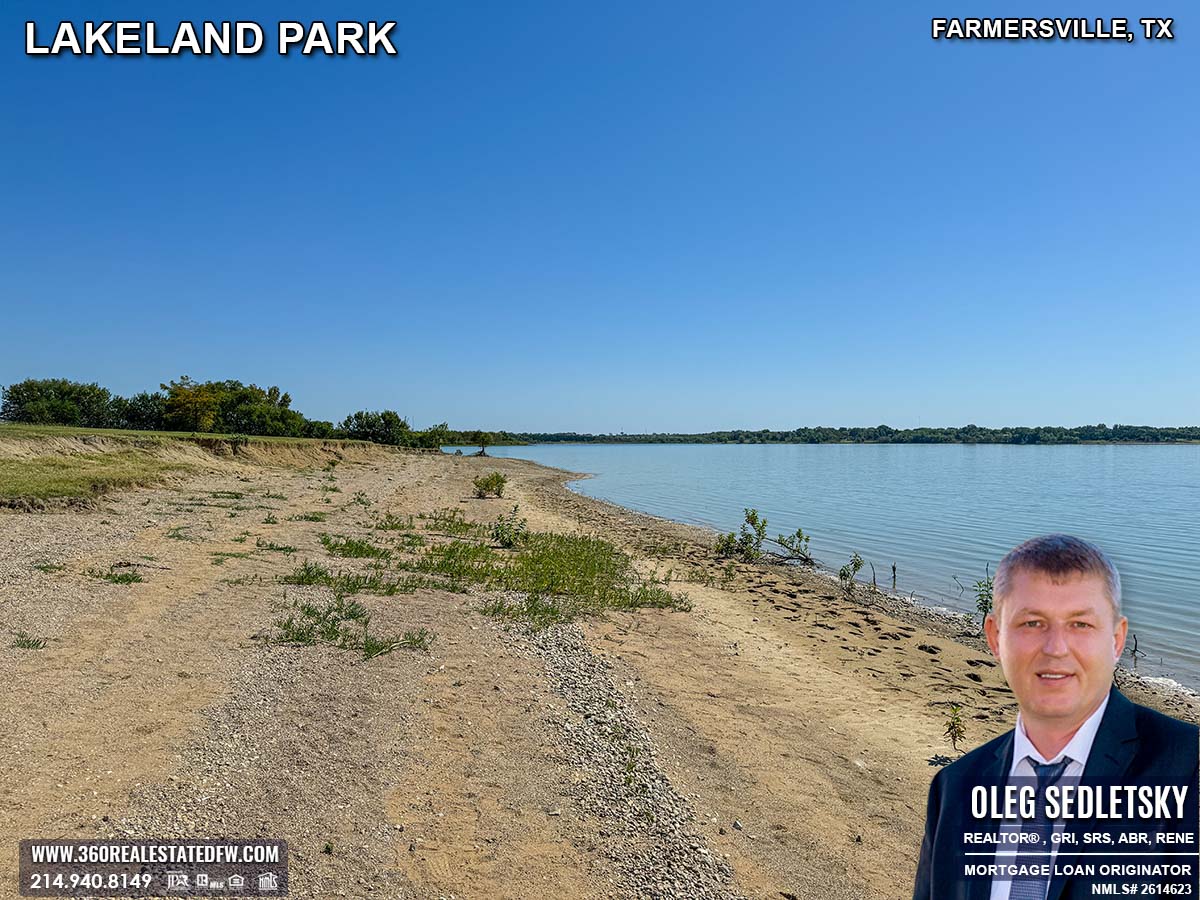
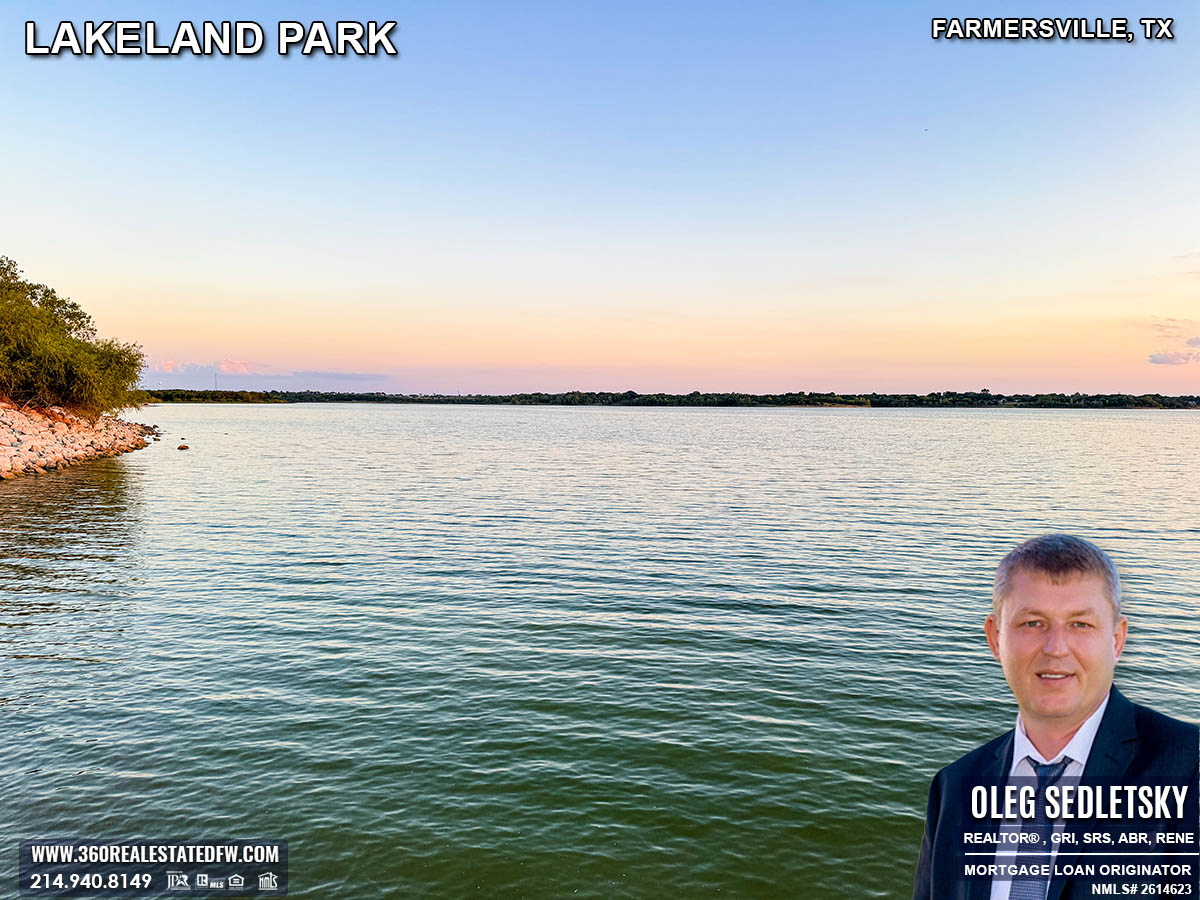
Discover the Charm of Lakeland Park on Lake Lavon in Farmersville, TX
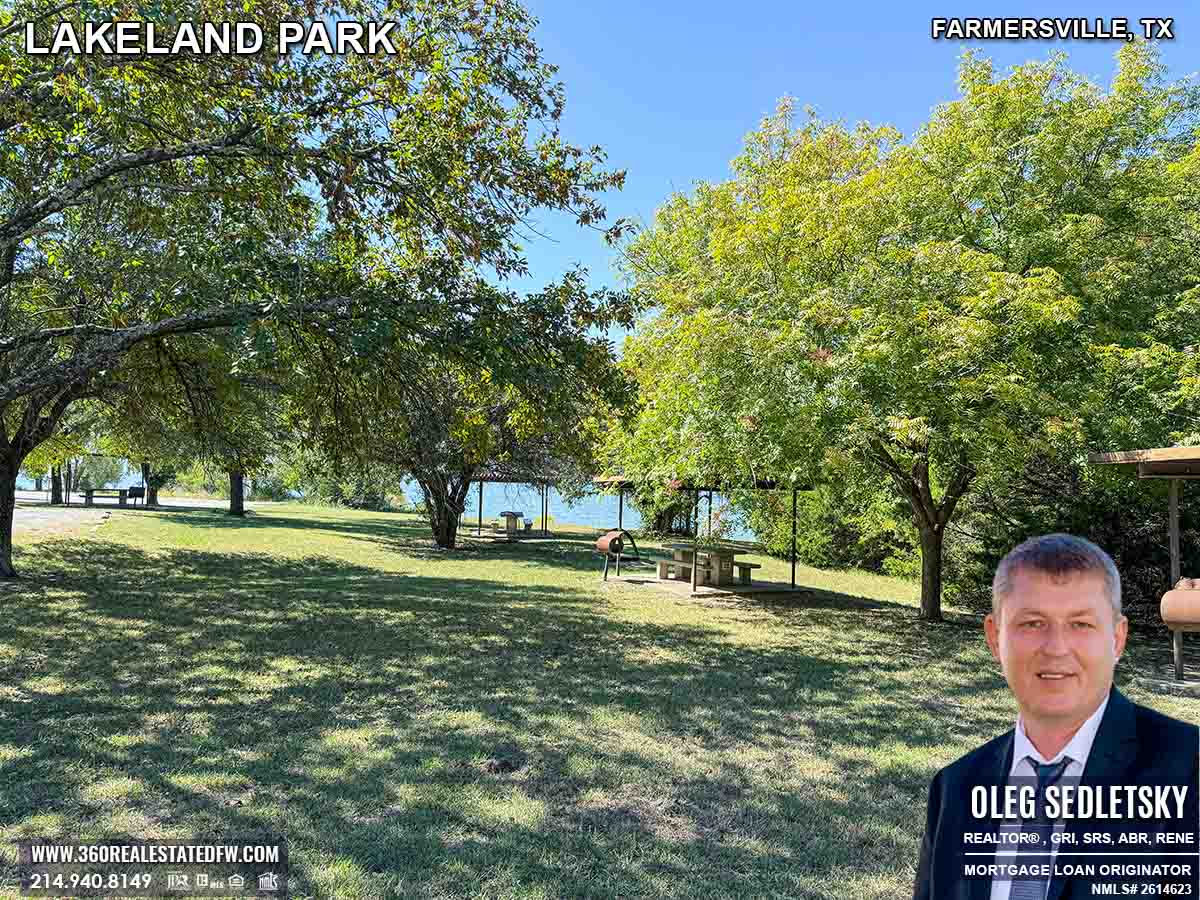
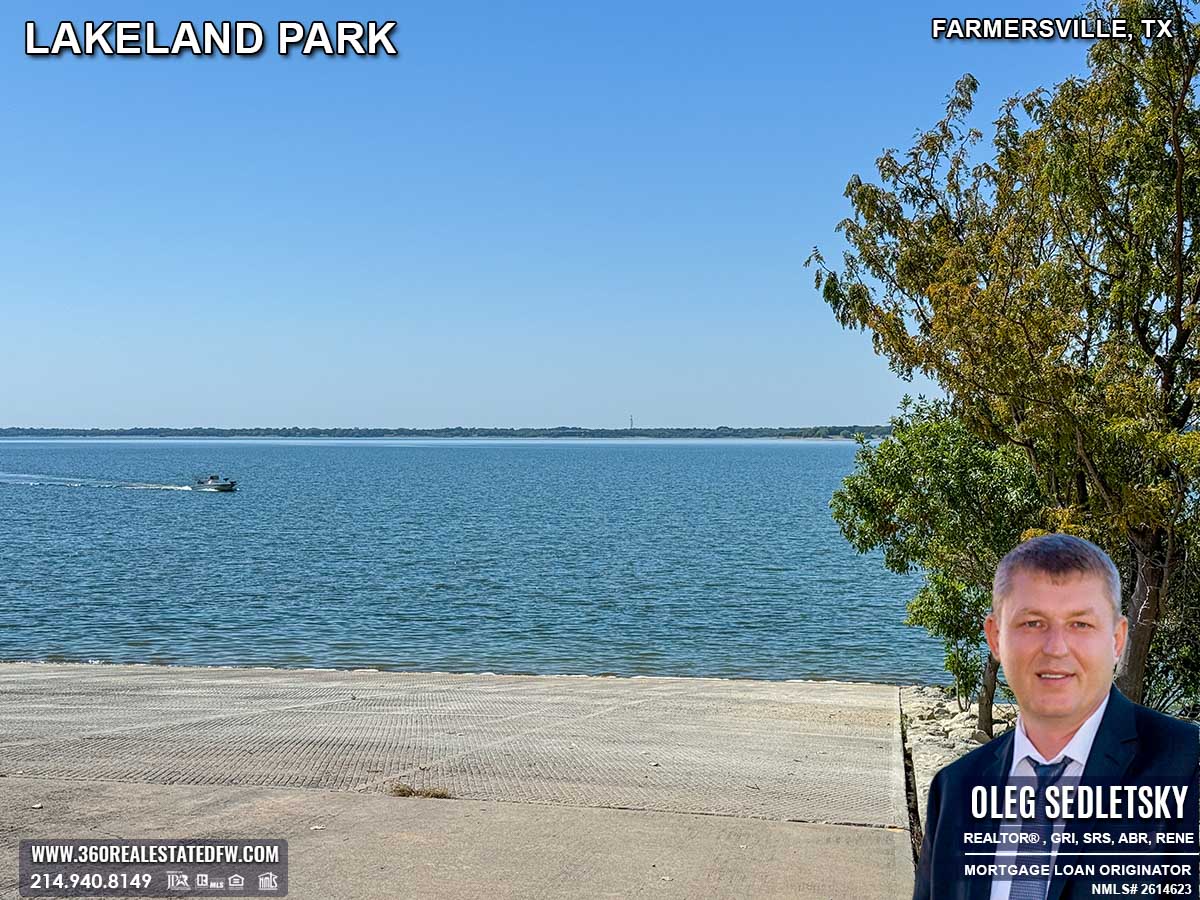
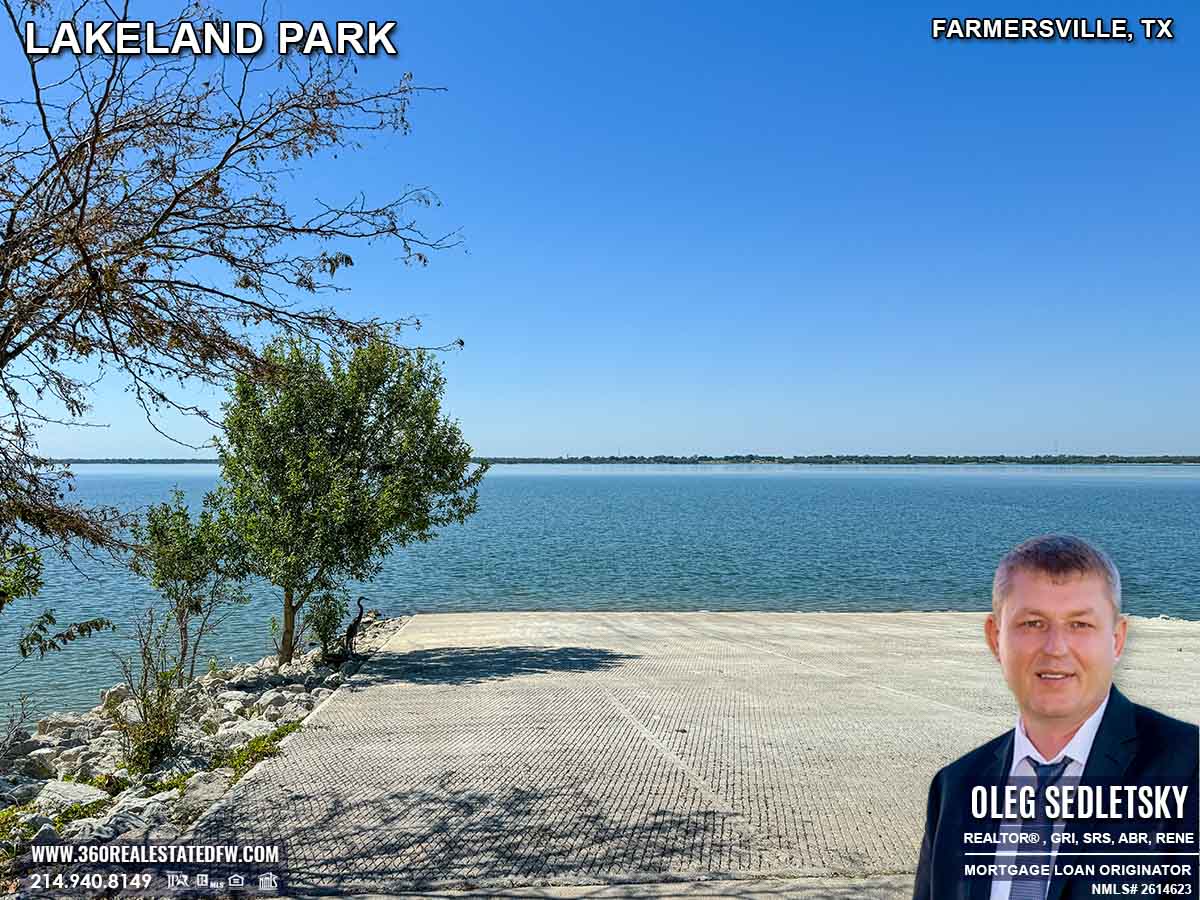
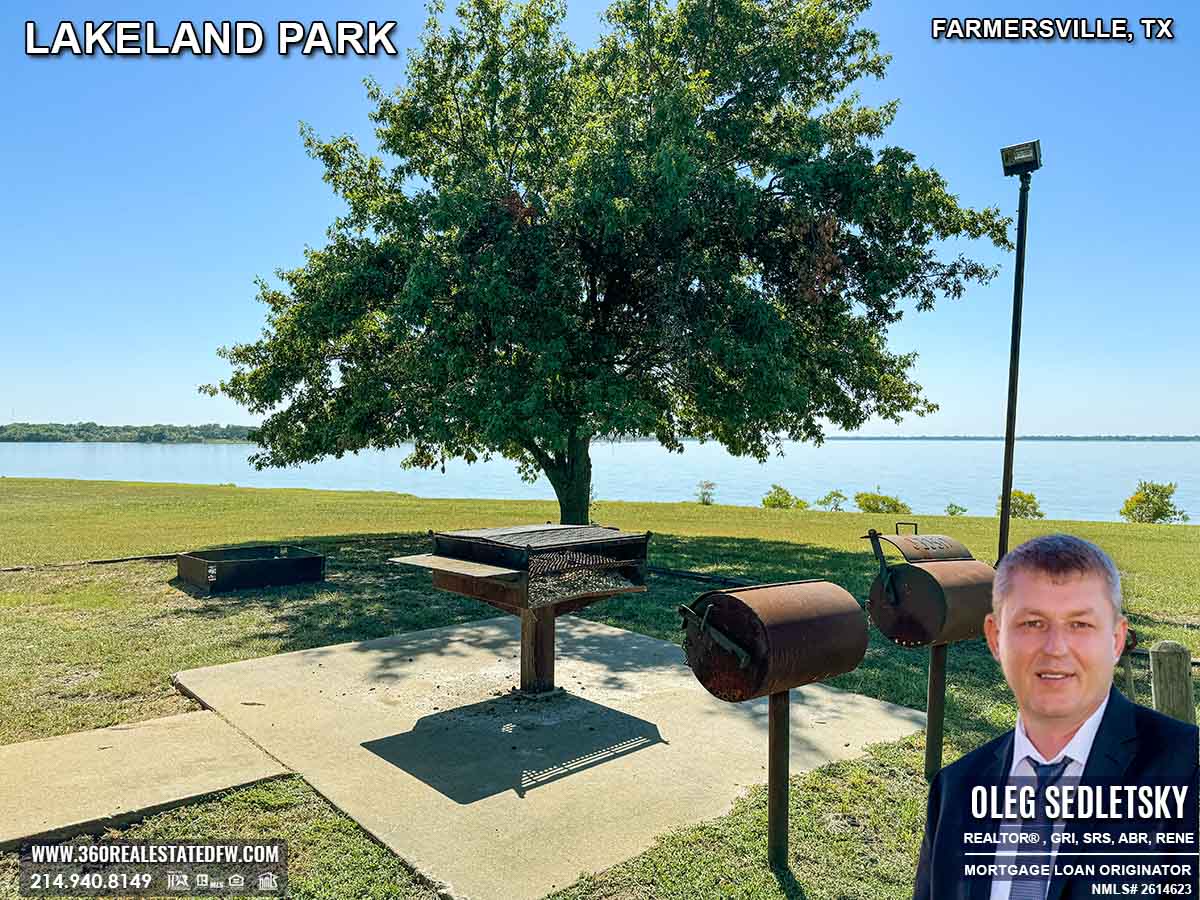
If you’re an outdoor enthusiast or simply someone who loves to sit and admire a breathtaking sunset, this park is calling your name. Nestled along the shores of Lake Lavon in Farmersville, TX, it offers plenty of opportunities to relax, explore, and create memories with family and friends. From fishing to picnicking, this gem has something for everyone. Let’s take a closer look!
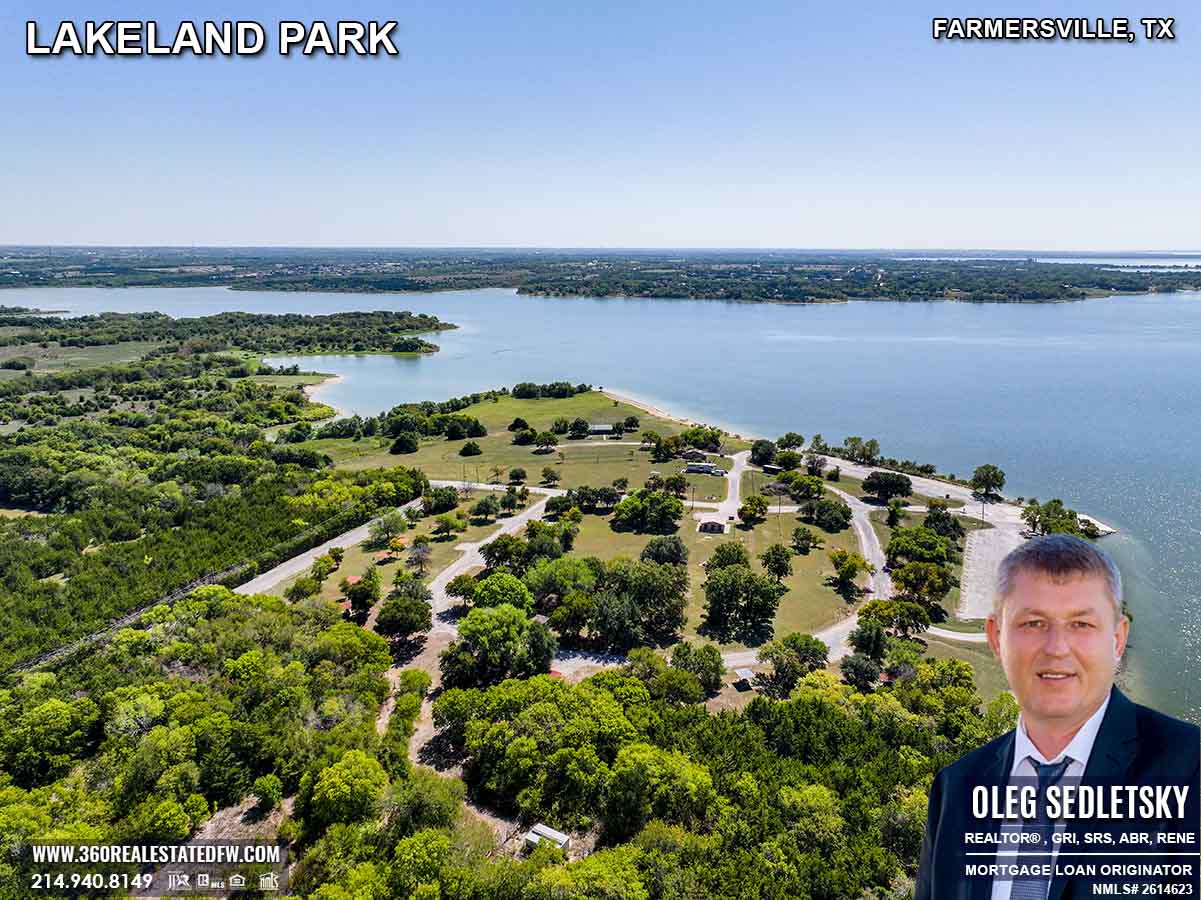
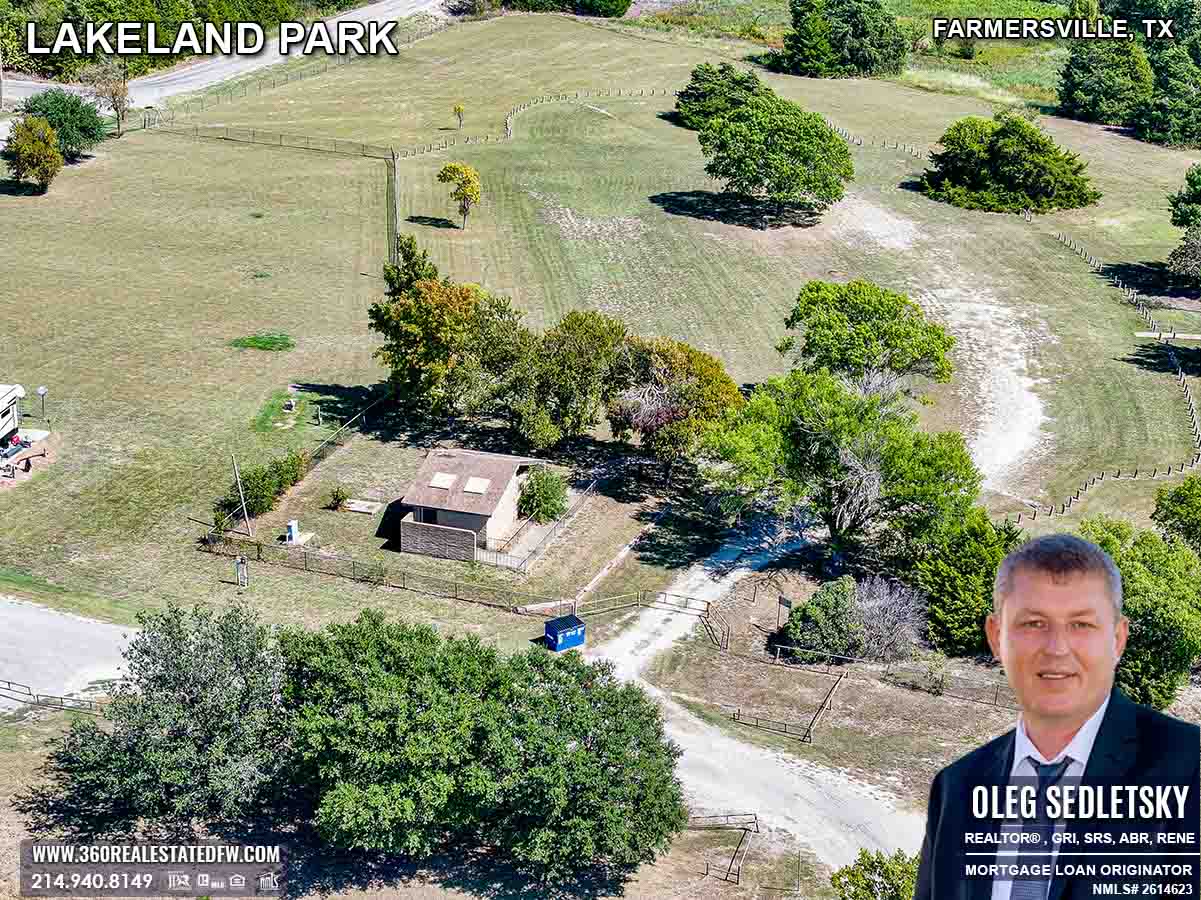
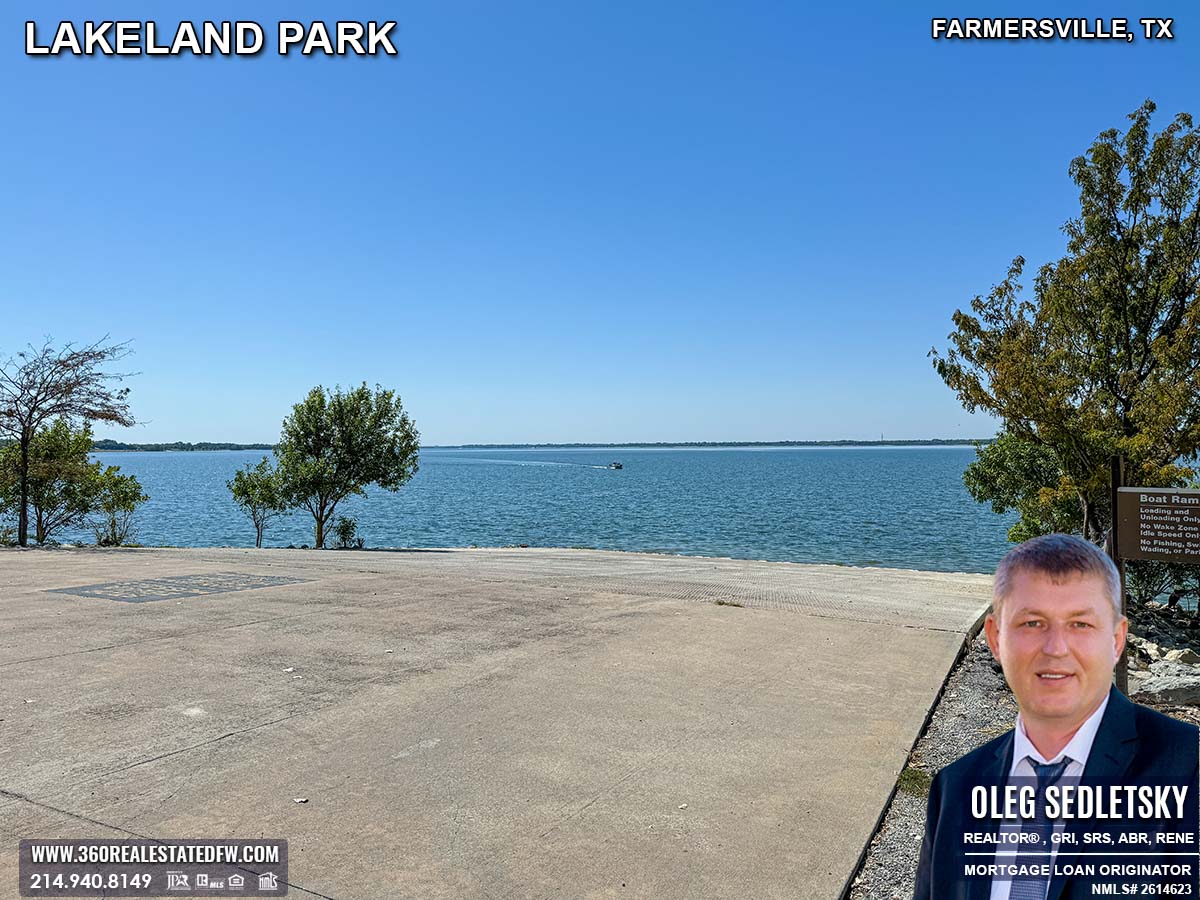
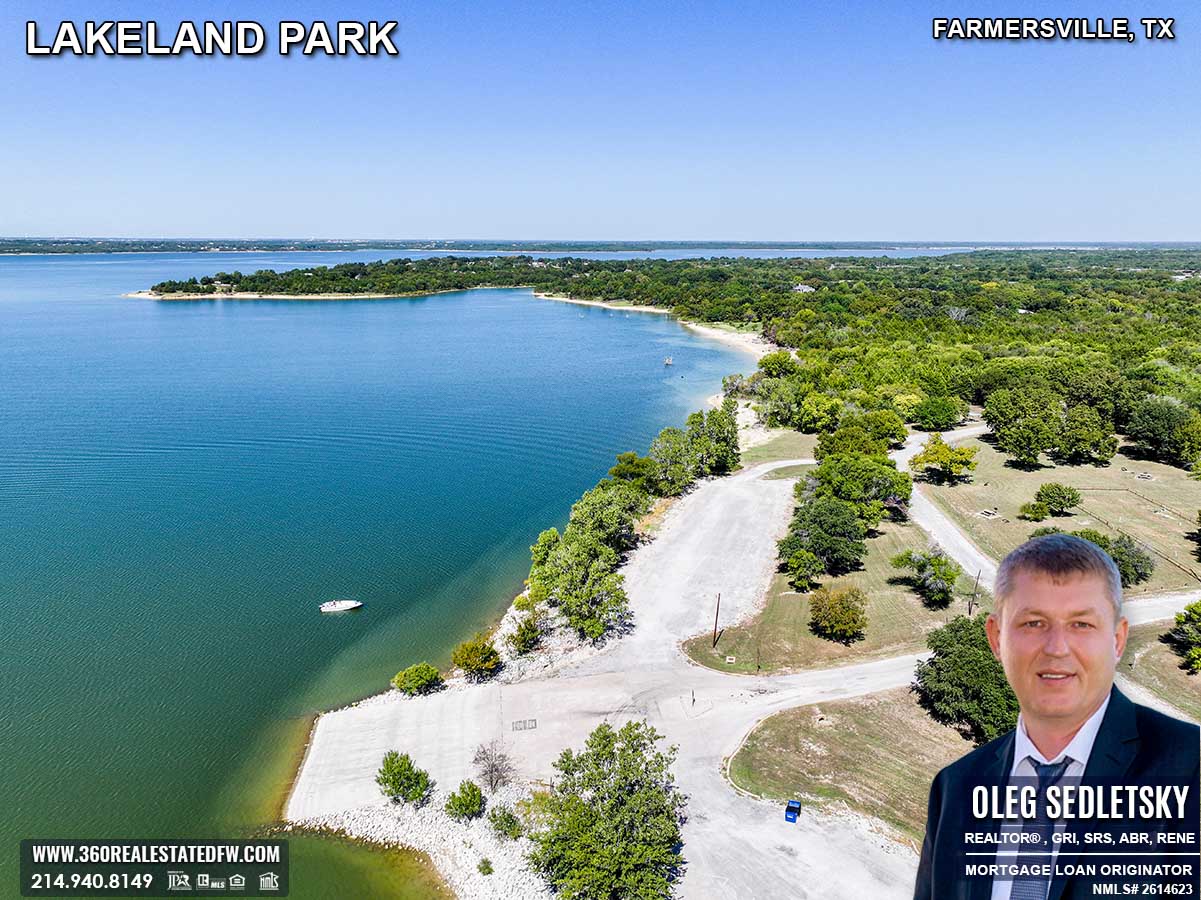
A Fantastic Lake Park for Outdoor Lovers in Farmersville, TX
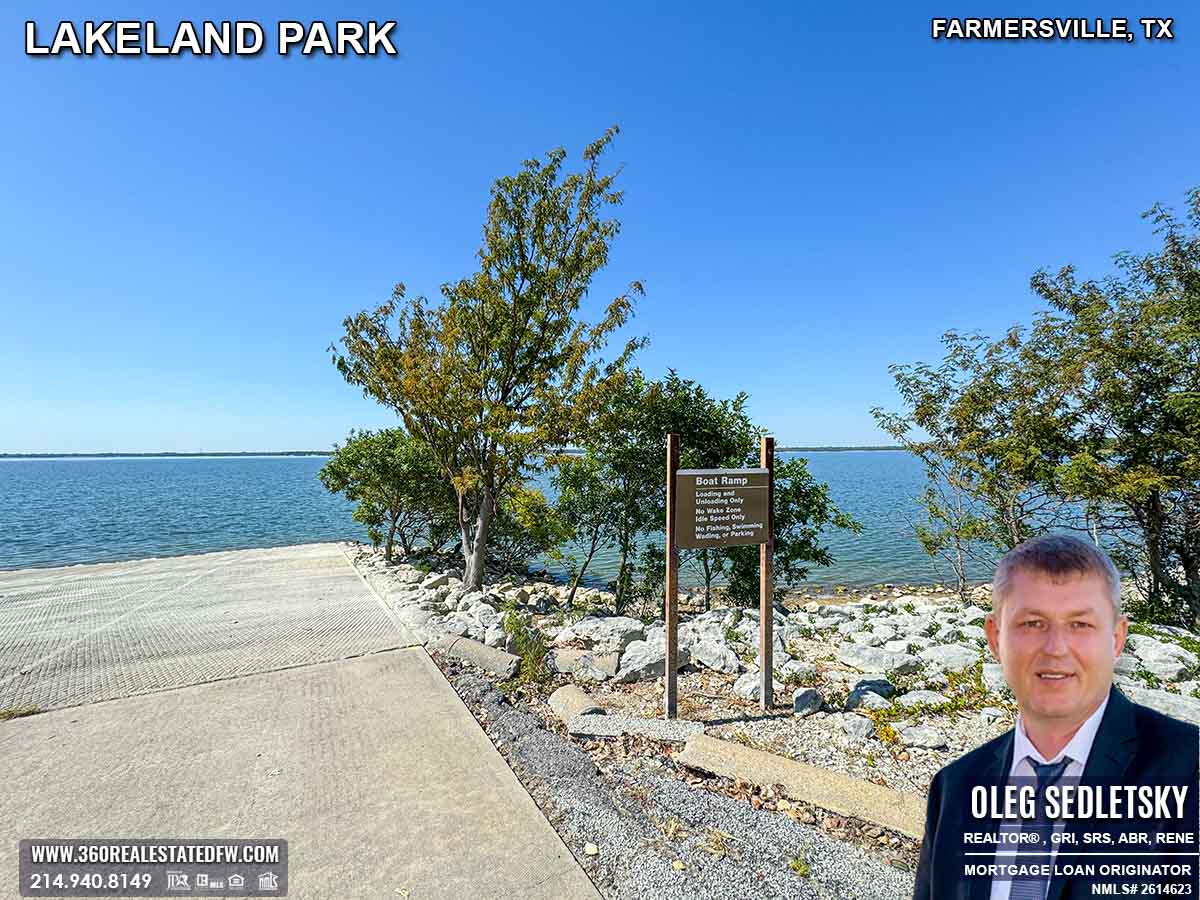
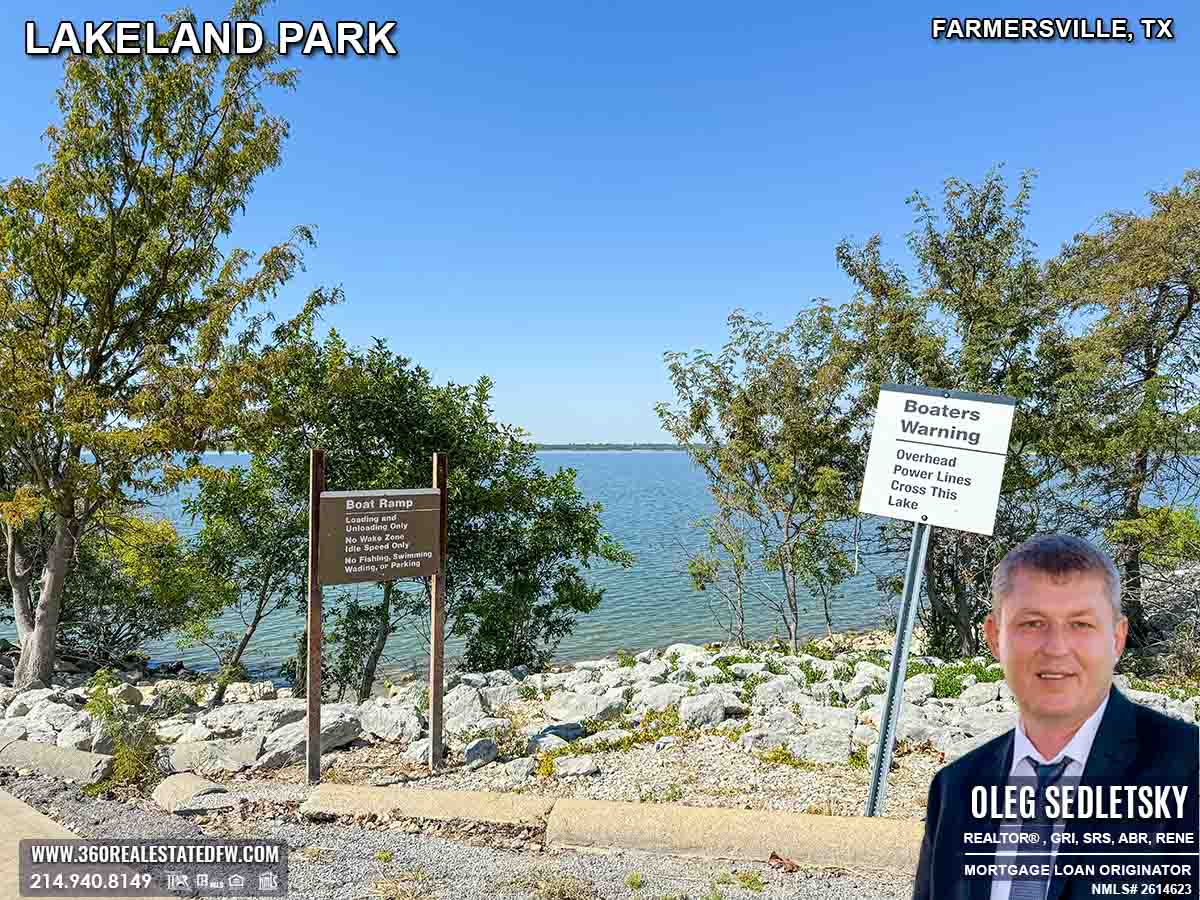
This park has everything you’d expect from a nature lover’s paradise. Want to unwind with a laid-back fishing session? Prefer a cozy picnic in the shade after a day outdoors? Or maybe you’re planning a memorable event at the lakeside pavilion? Whatever your ideal day in nature looks like, this park promises to deliver. With a clean 4-lane boat ramp, picturesque surroundings, and even restrooms nearby for convenience, it’s the perfect getaway to enjoy the great outdoors.
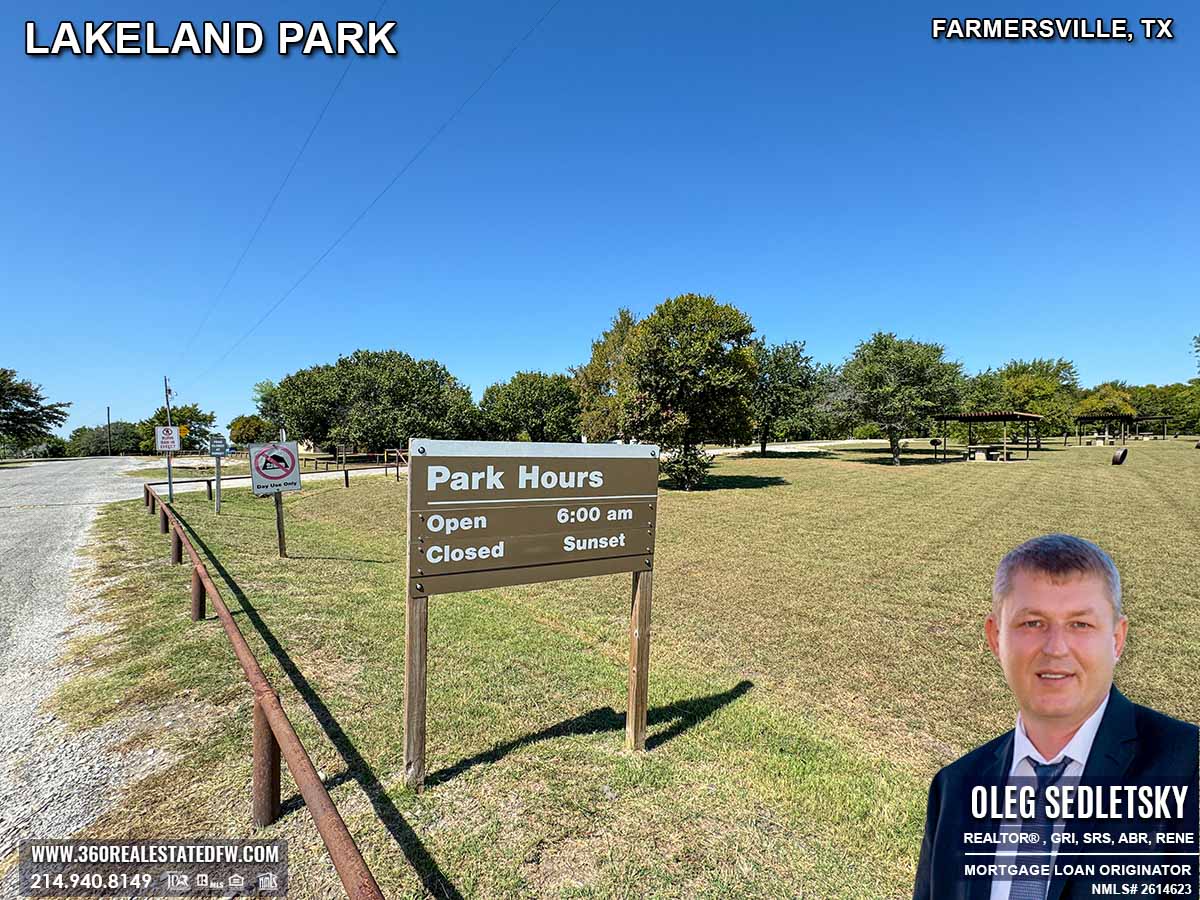
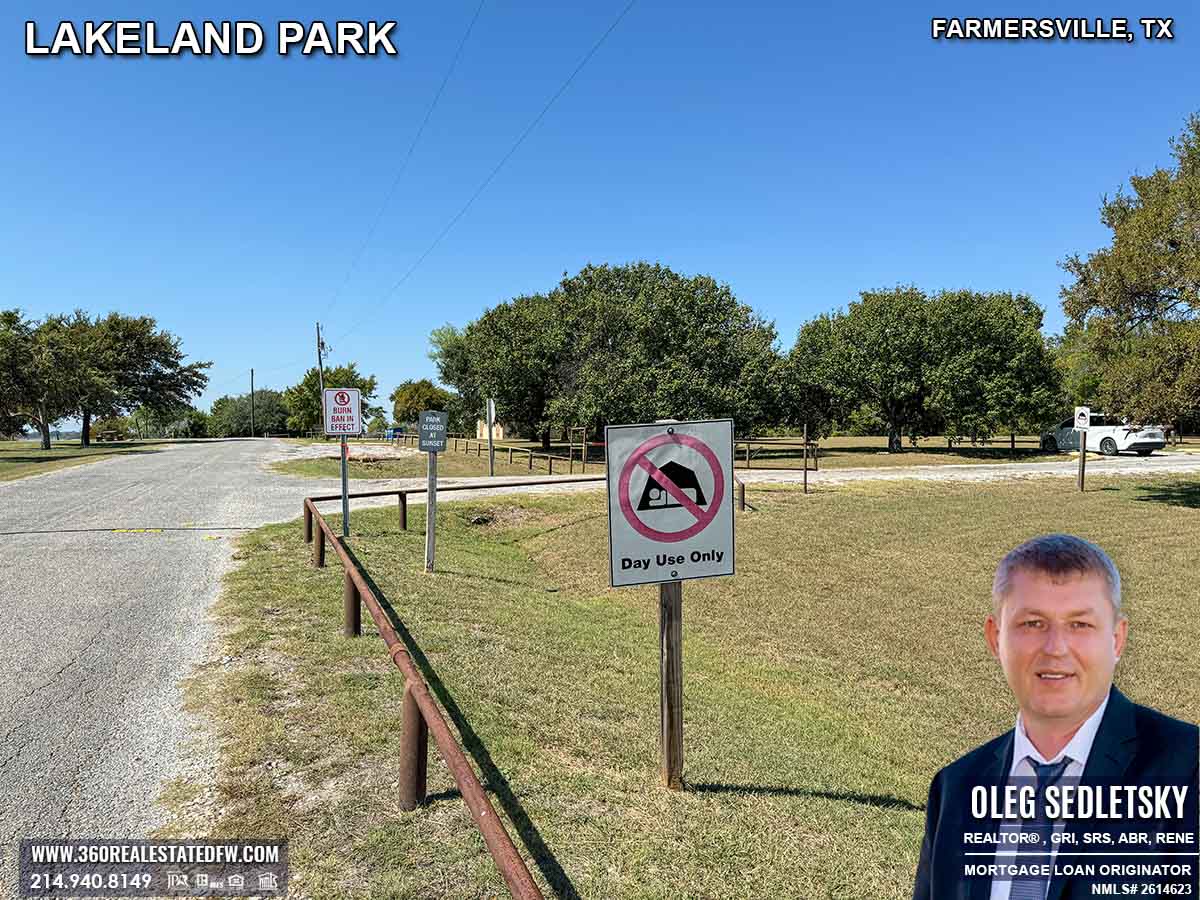
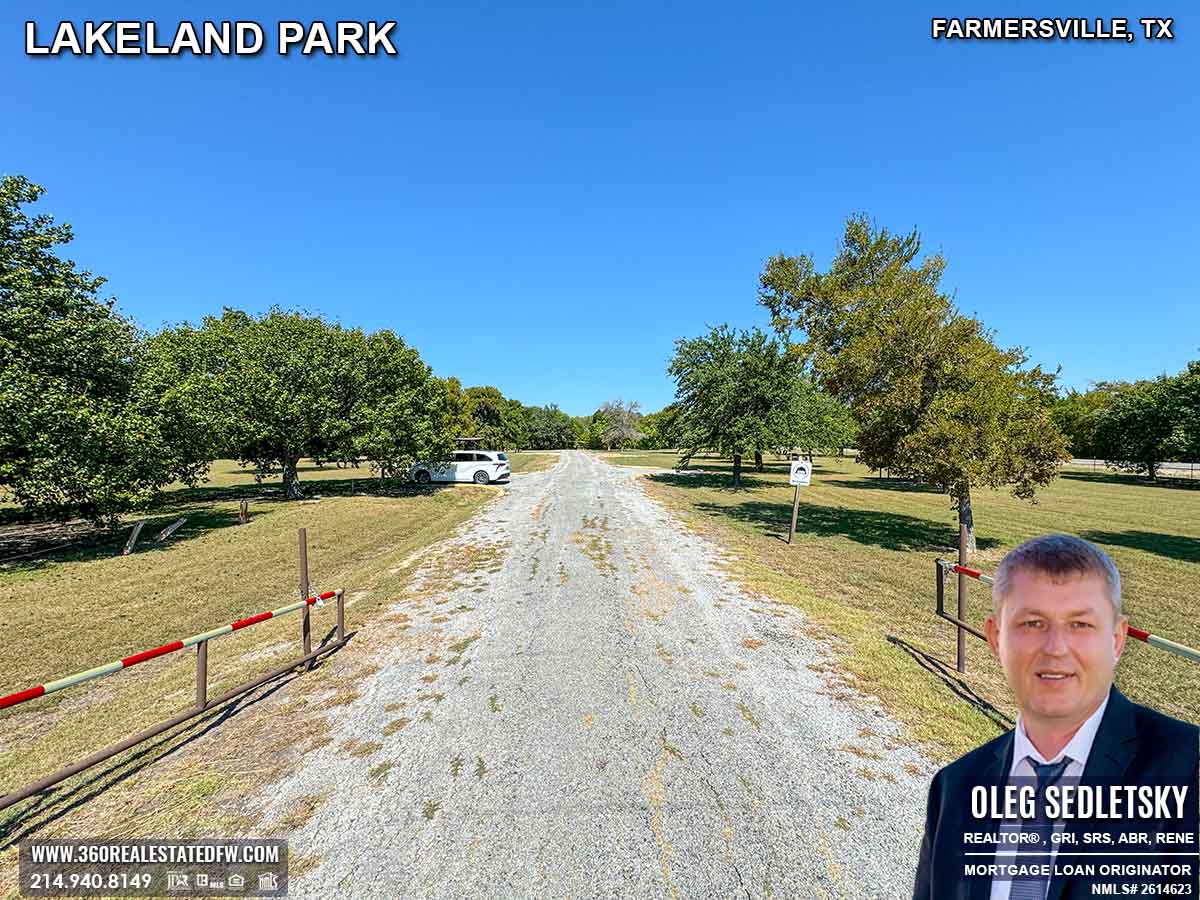
Lakeland Park Hours and Availability
This park makes it easy to plan your trip. It’s open every day from 6 a.m. until sunset, giving you the whole day to explore and enjoy the area. It’s even open year-round, so whether it’s a sunny summer day or a crisp autumn afternoon, the park is ready to welcome you. Just remember that access is controlled for safety and preservation.
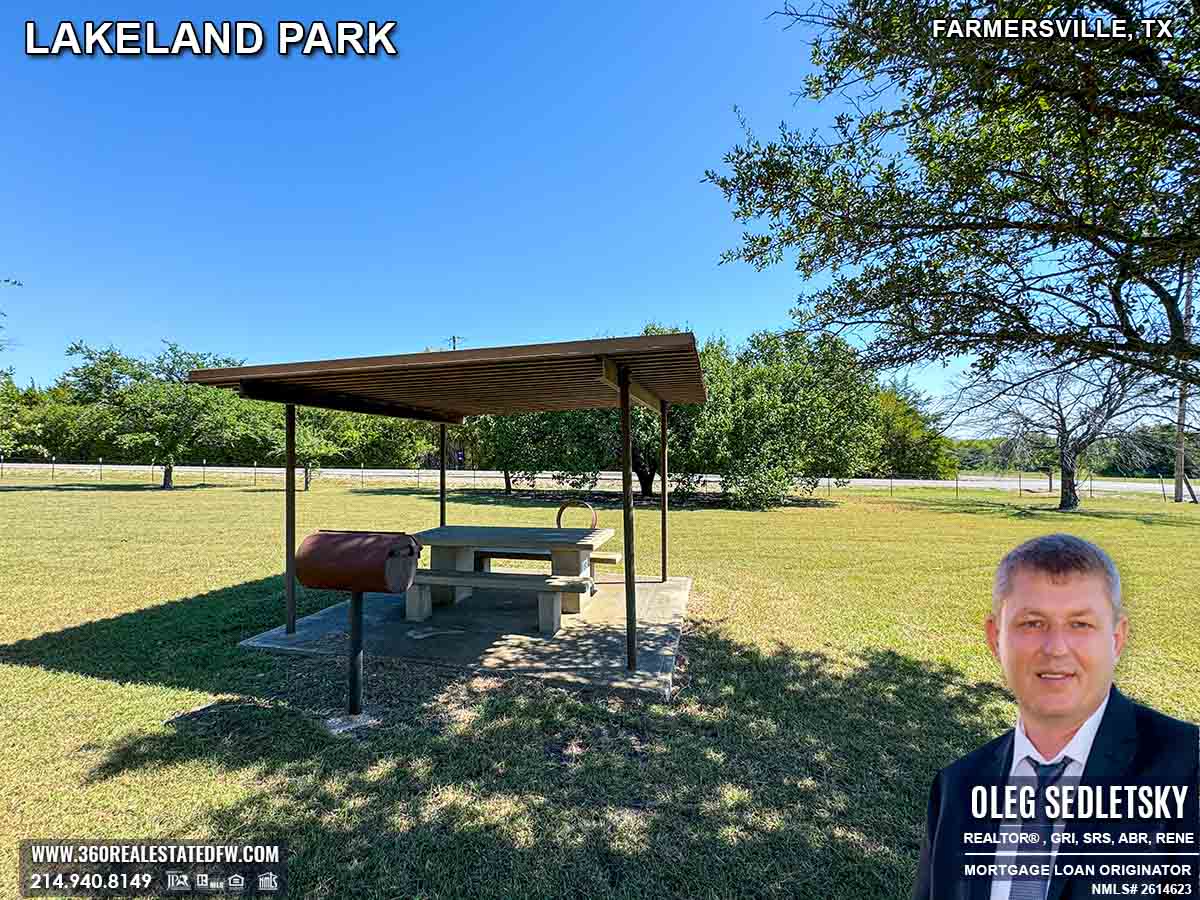
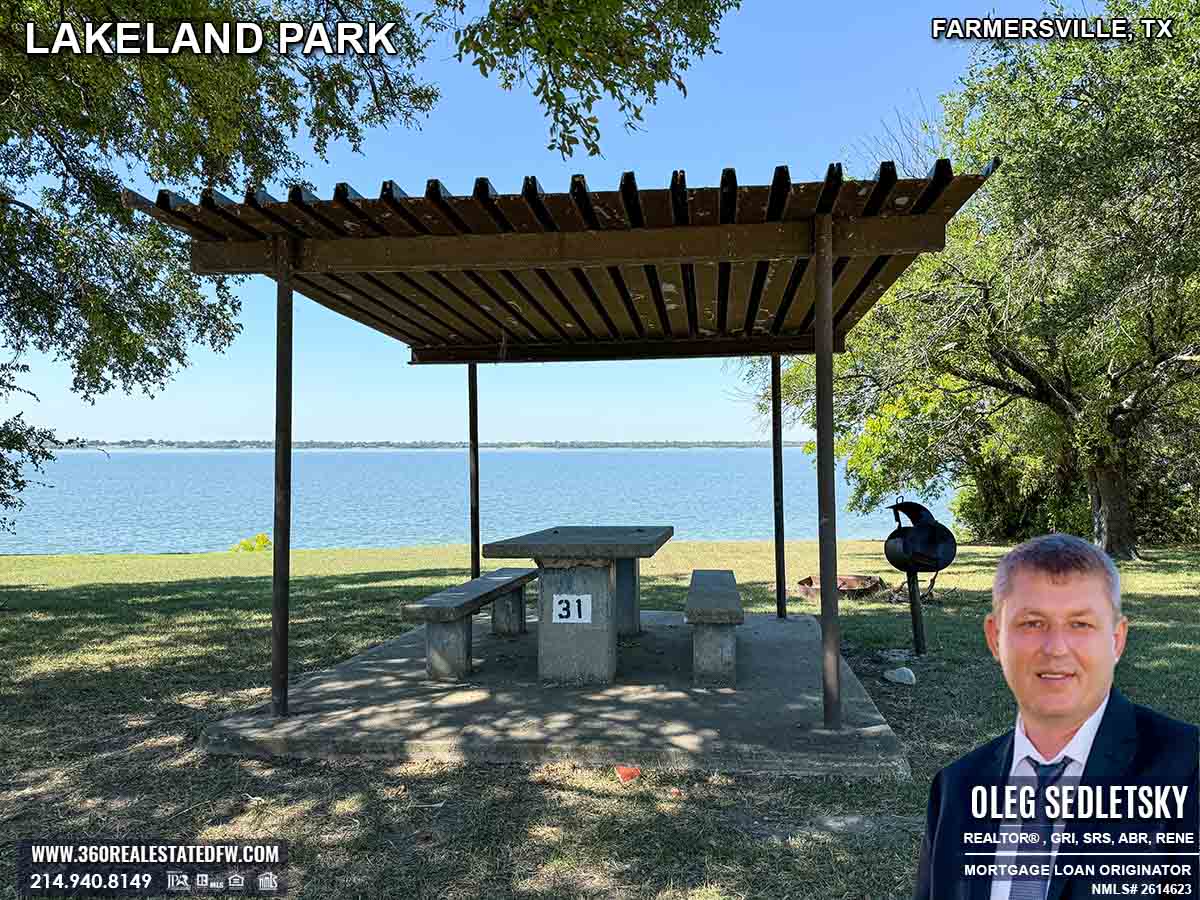
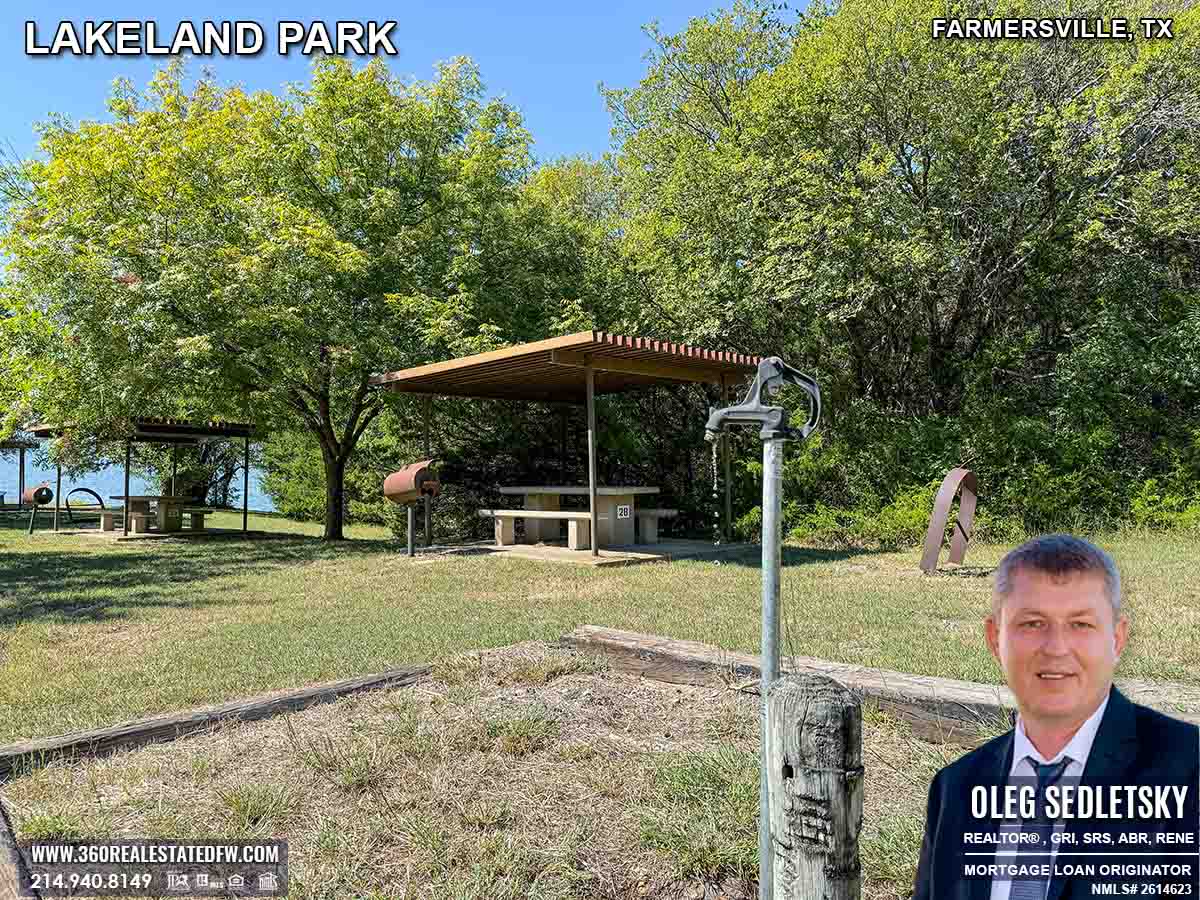
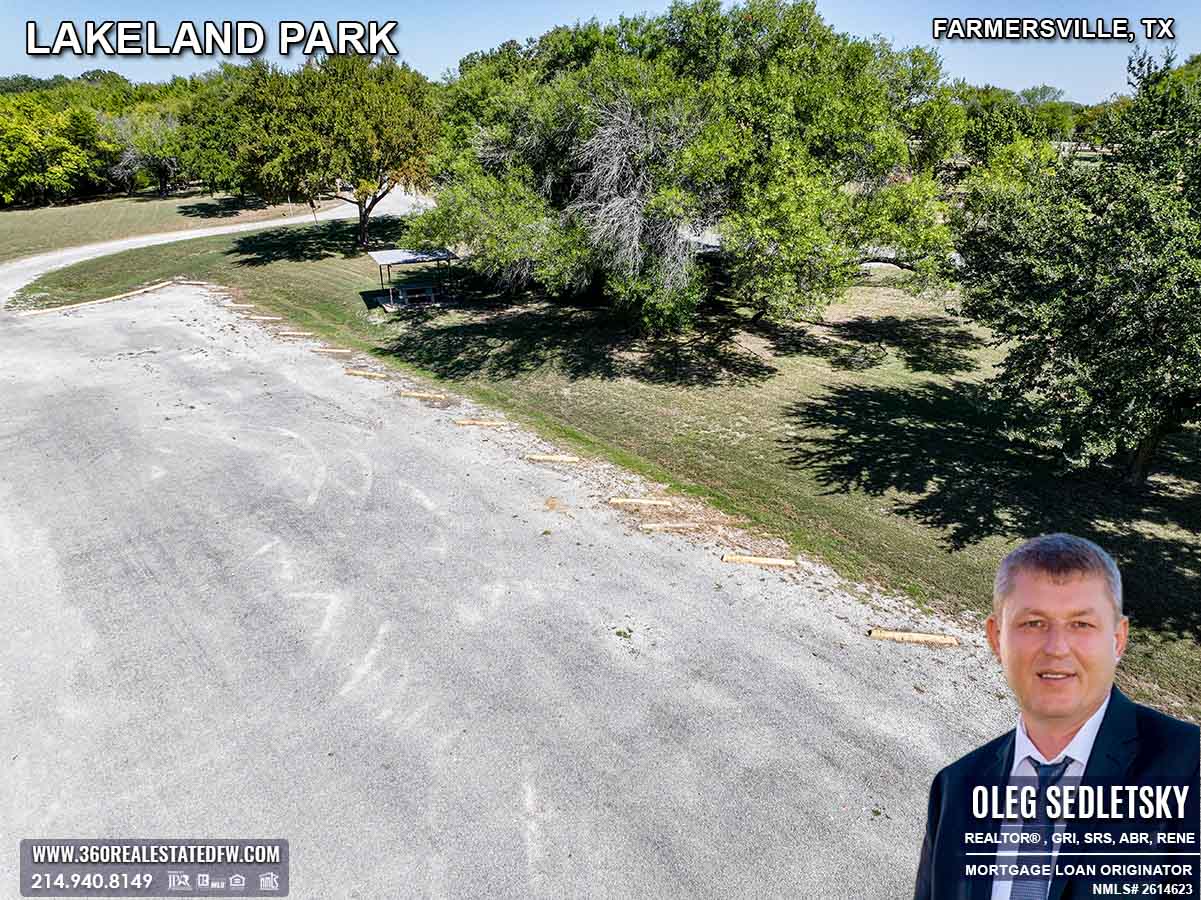
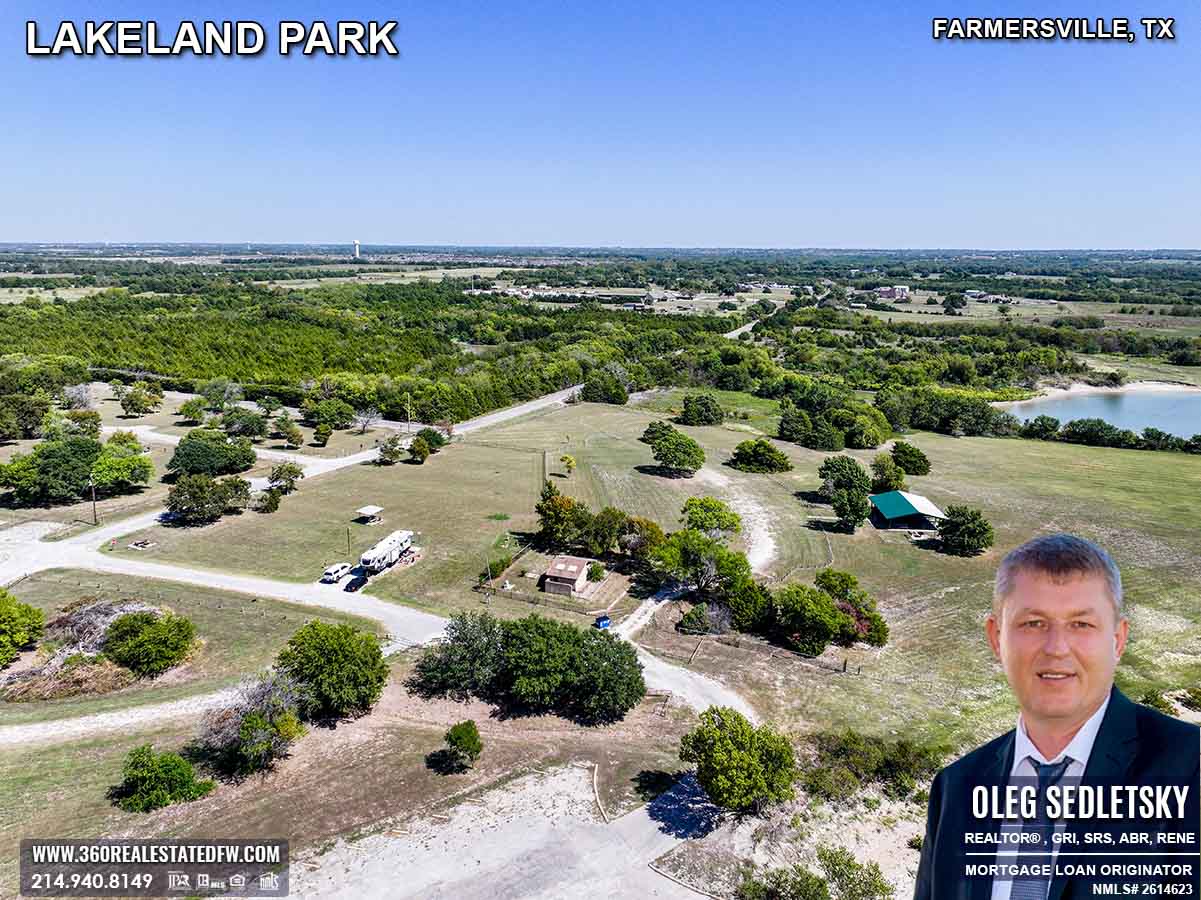
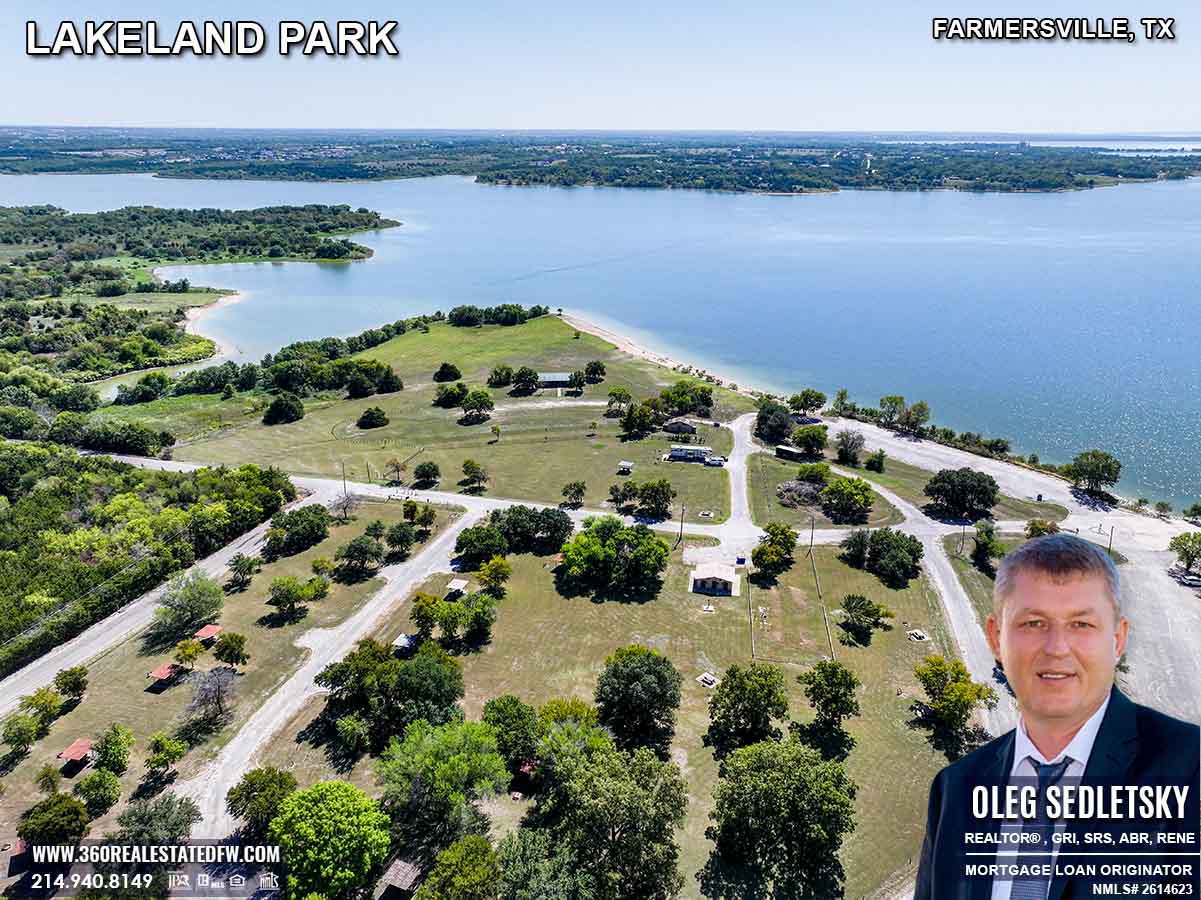
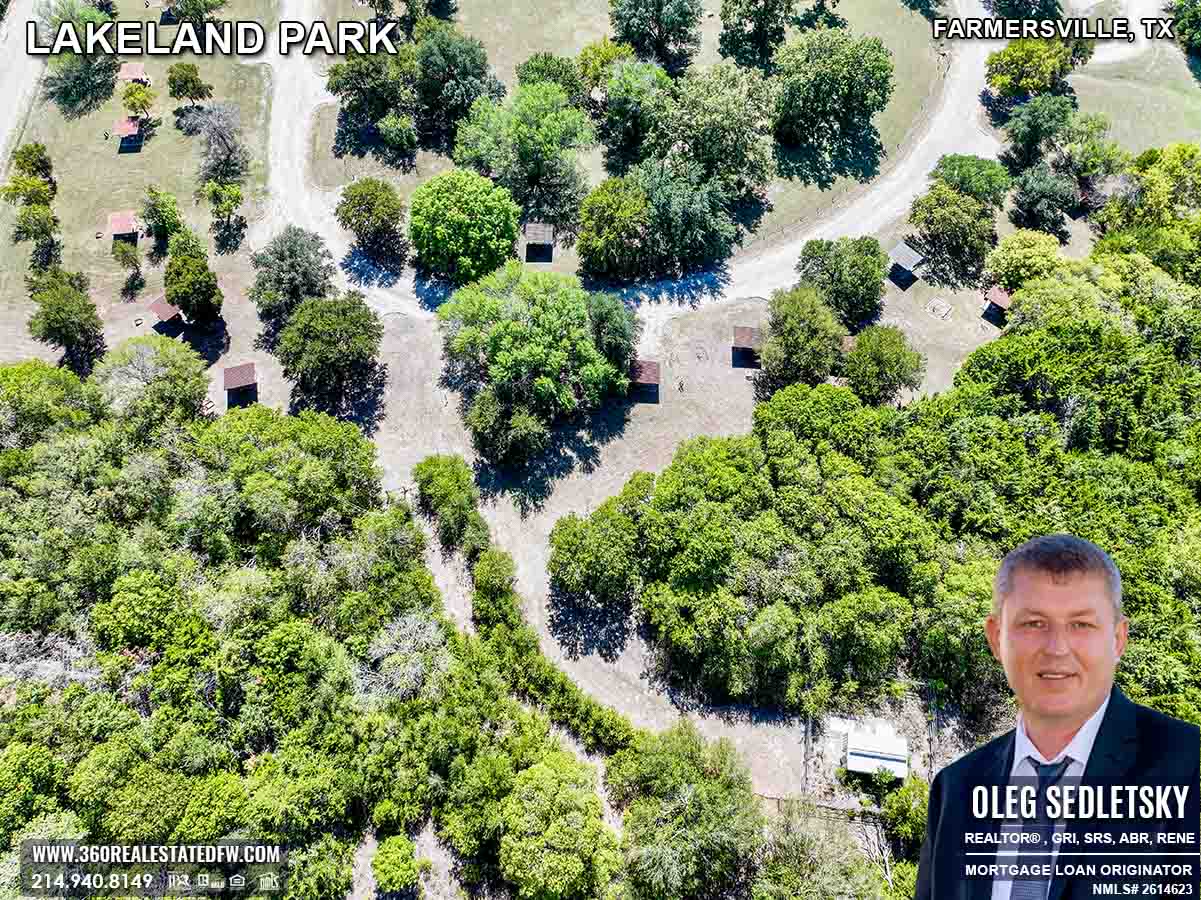
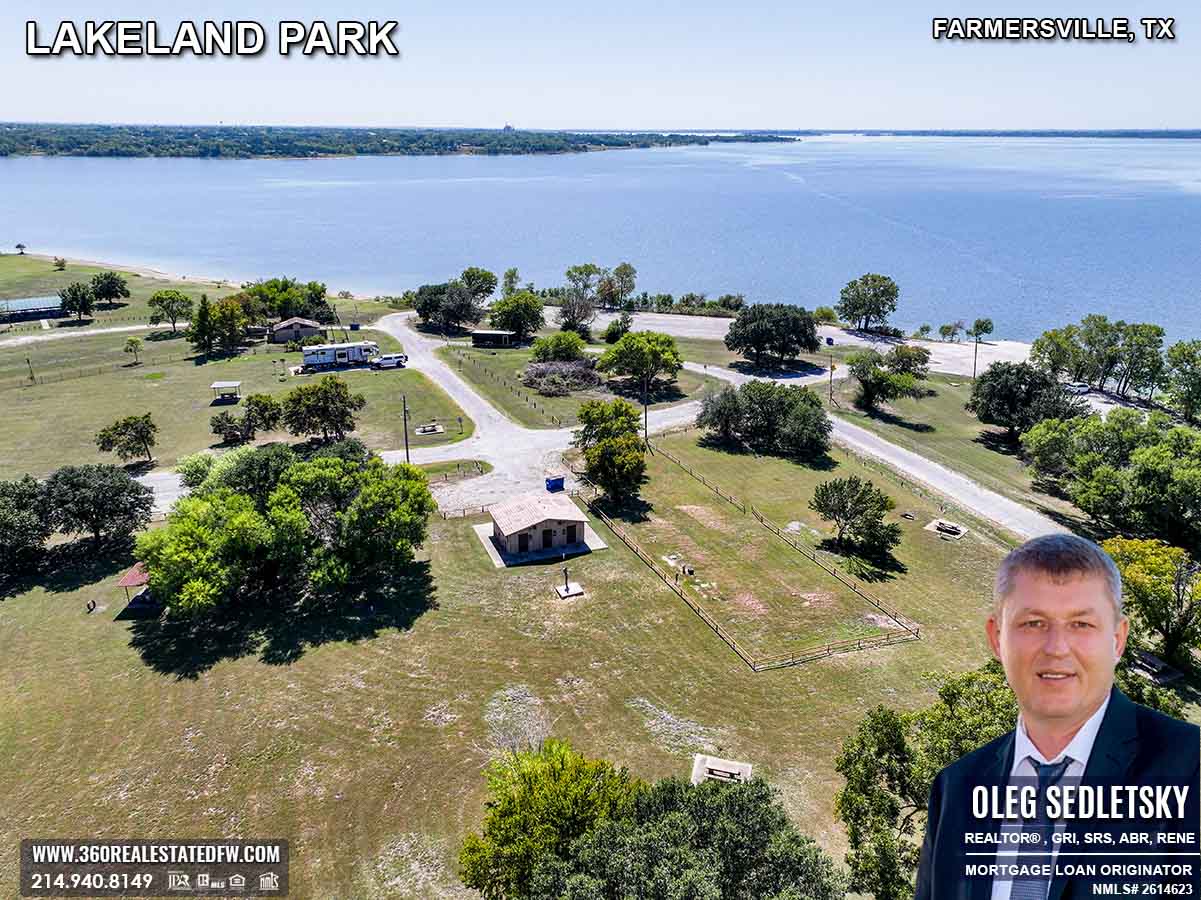
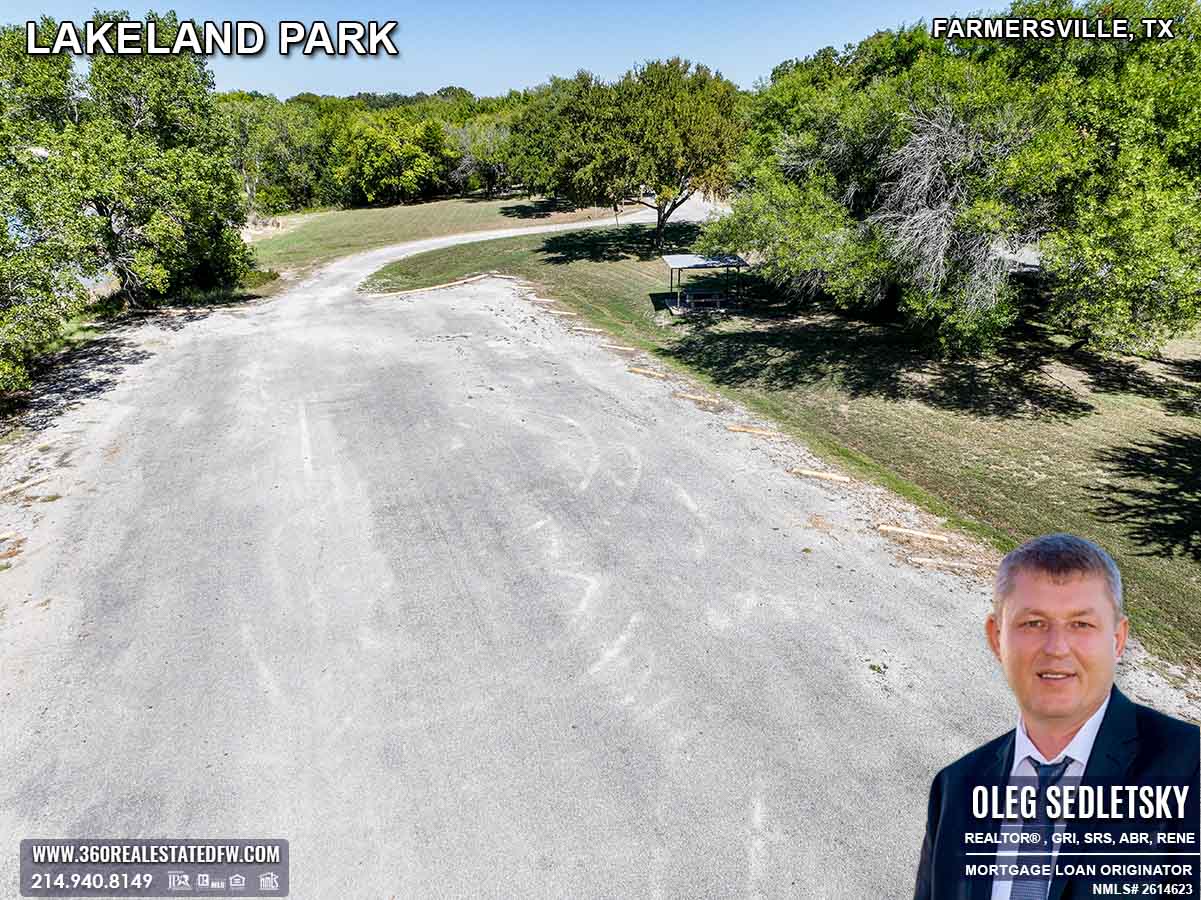
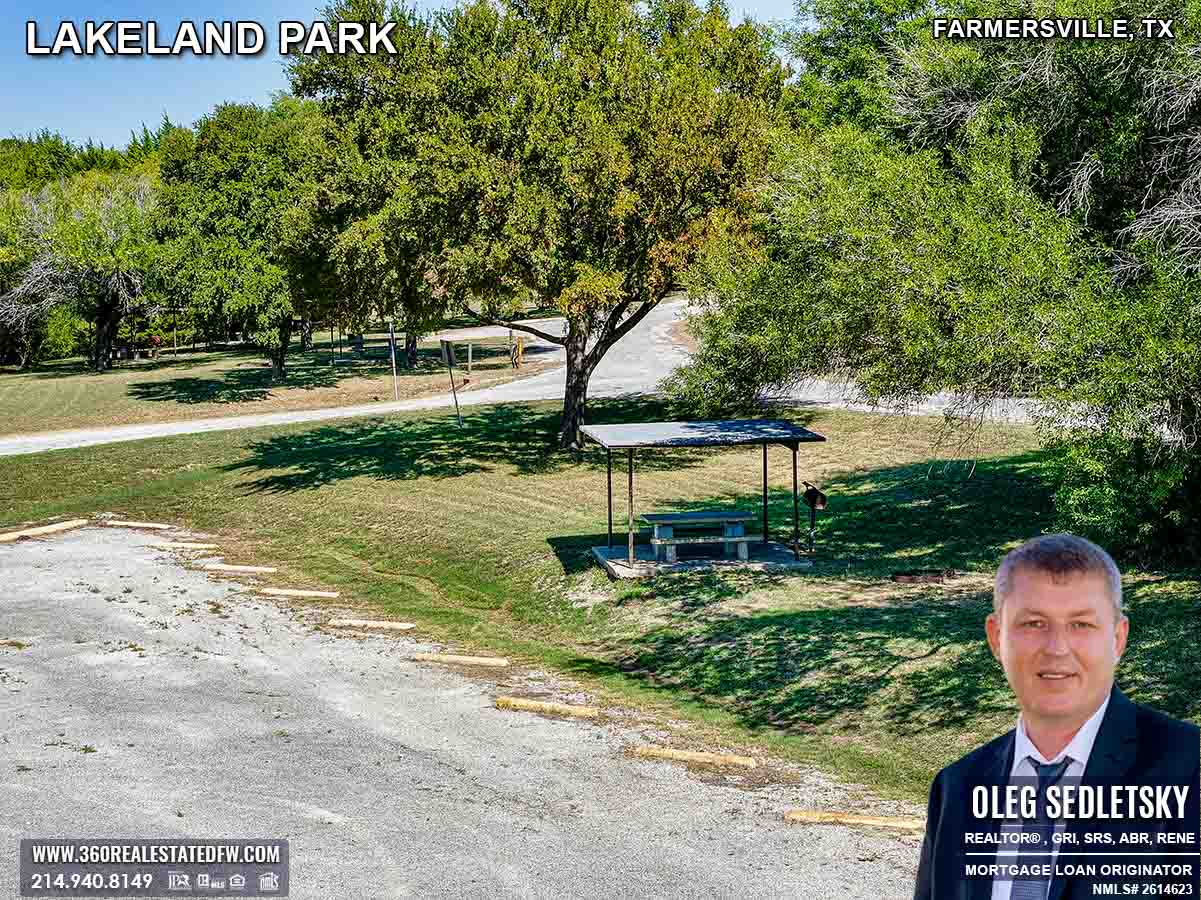
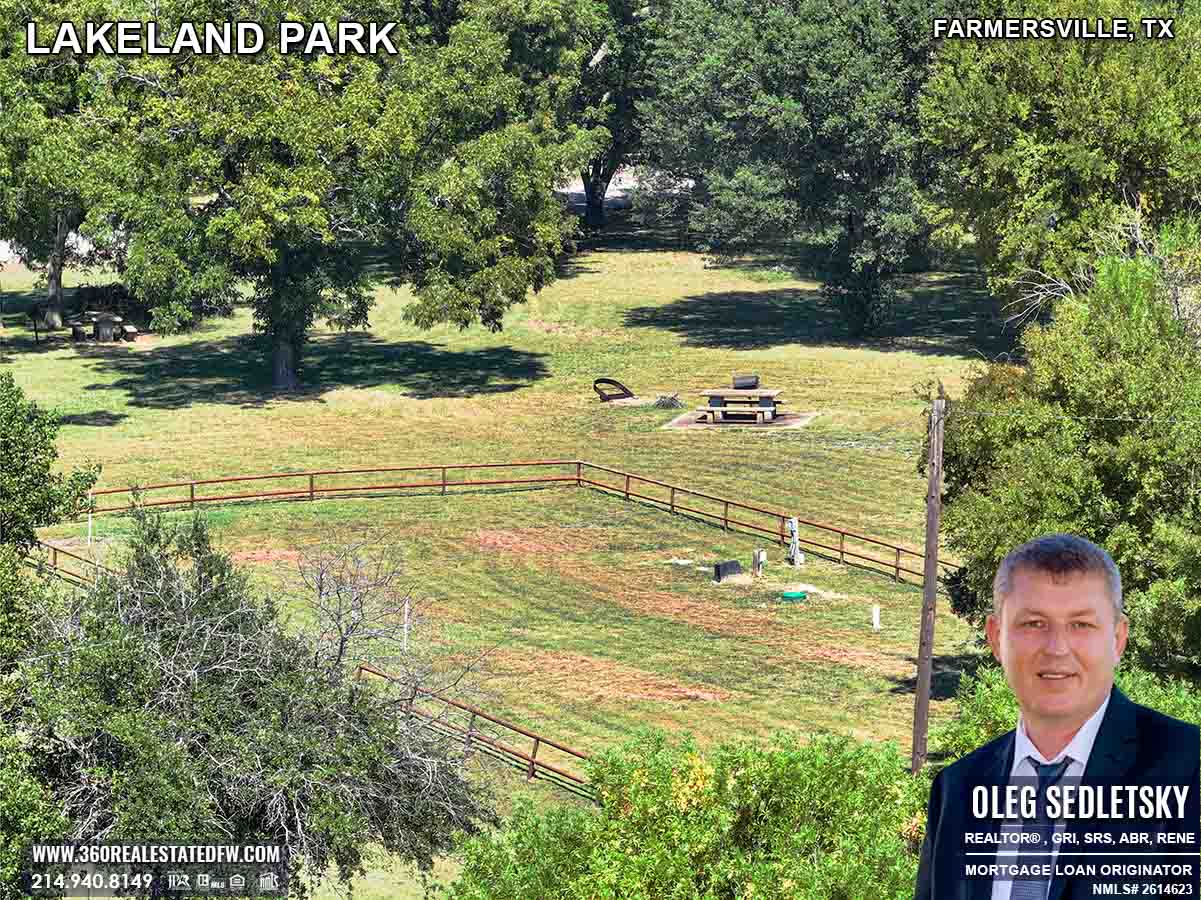
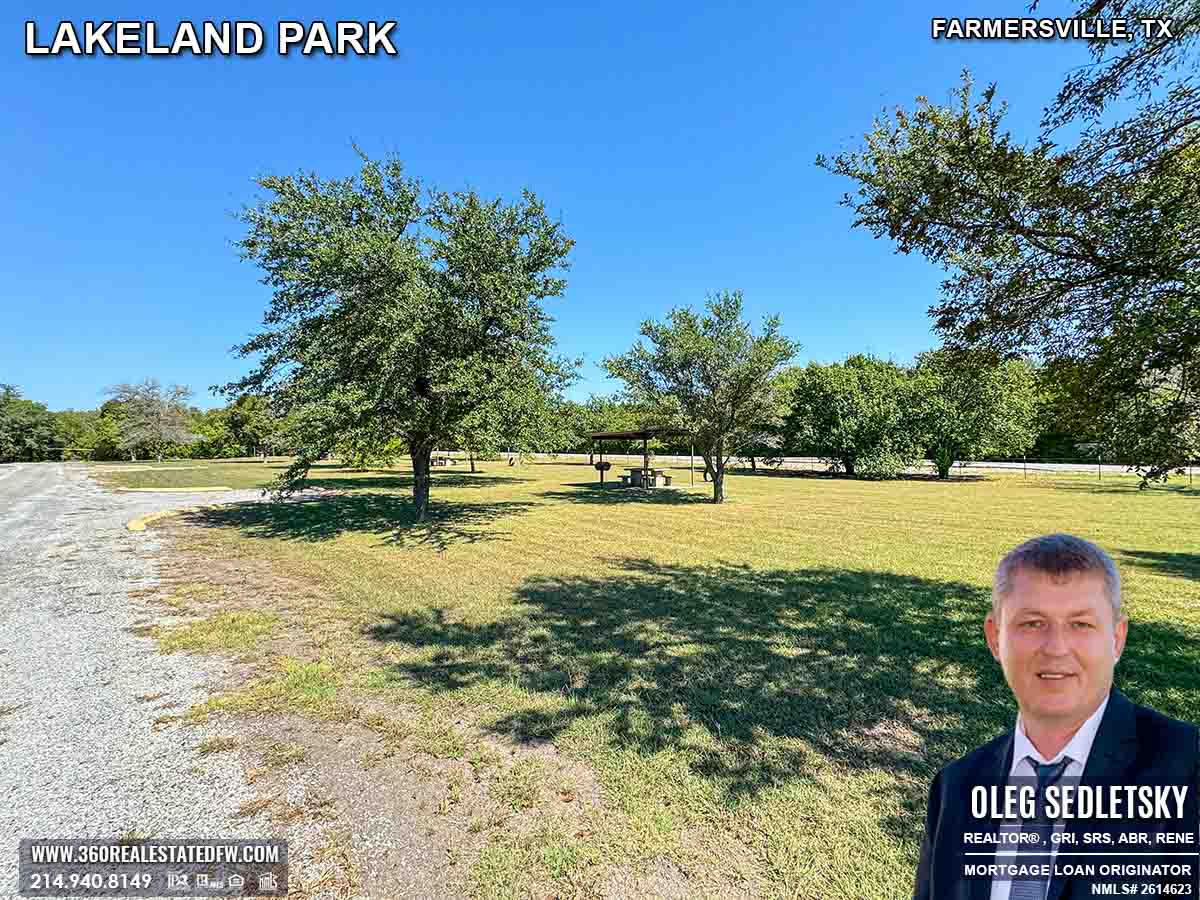
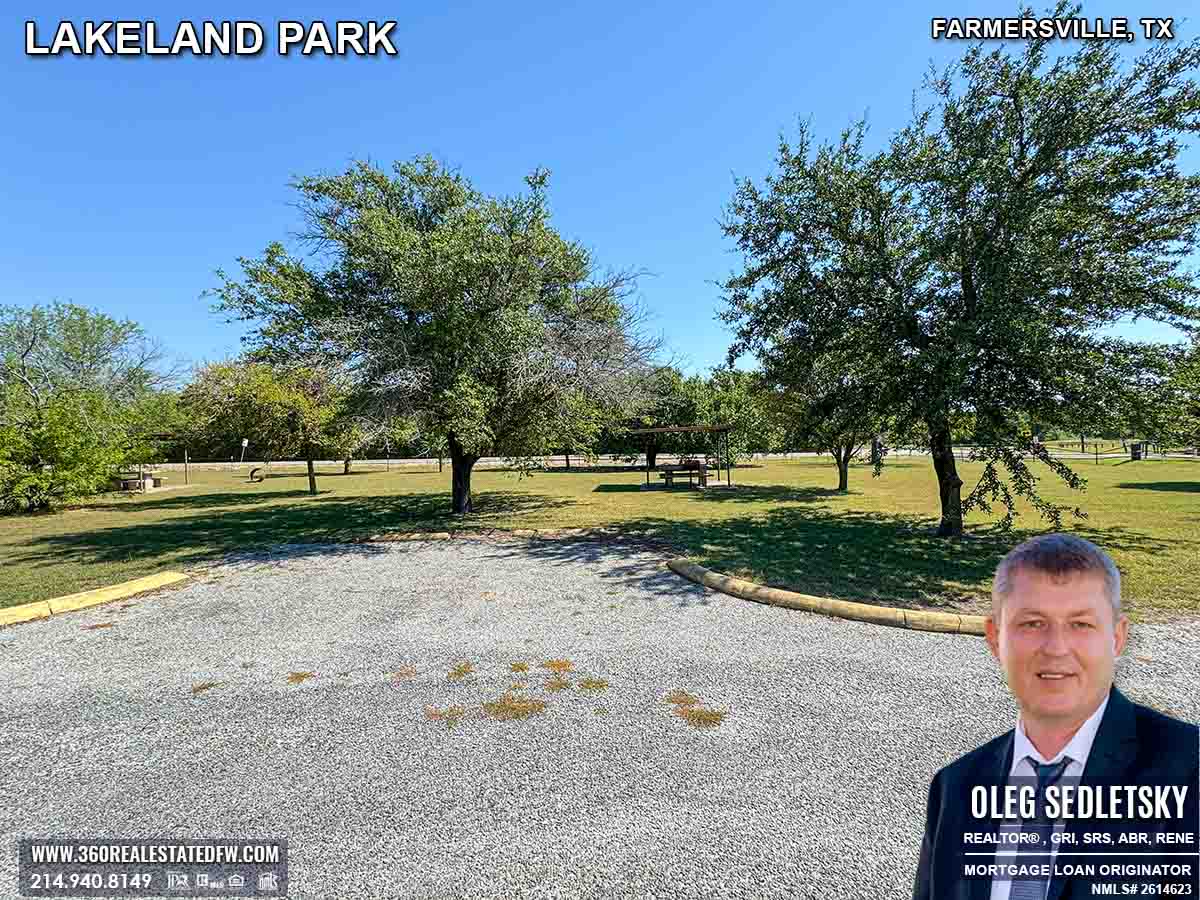
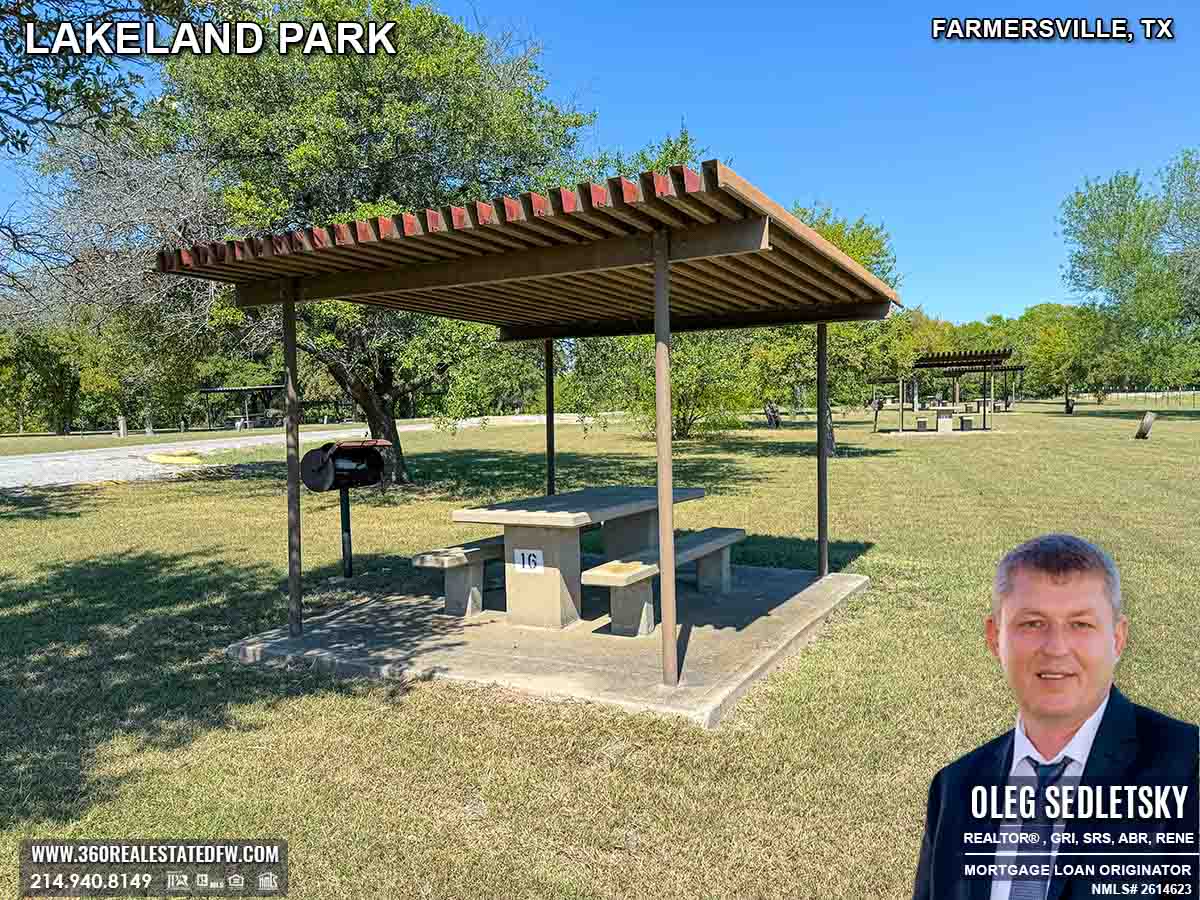
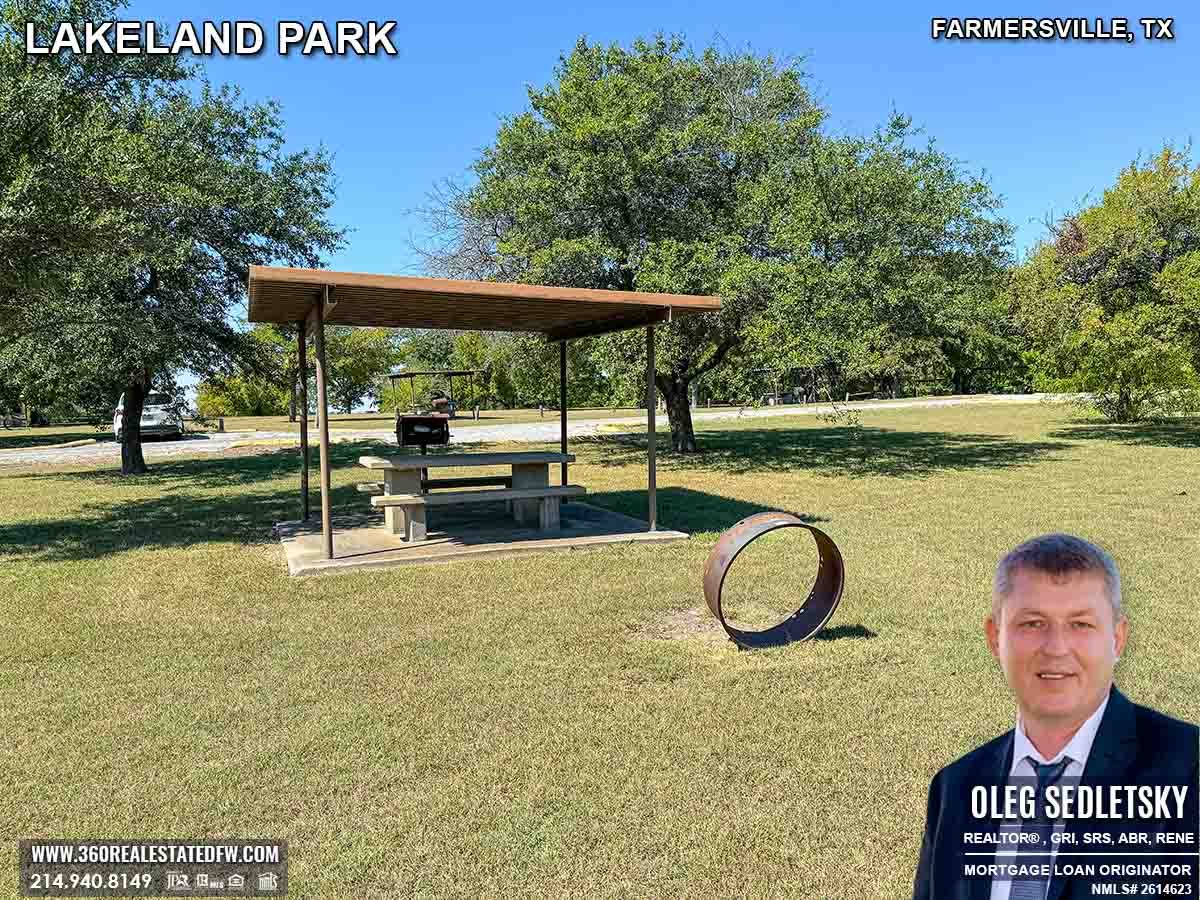
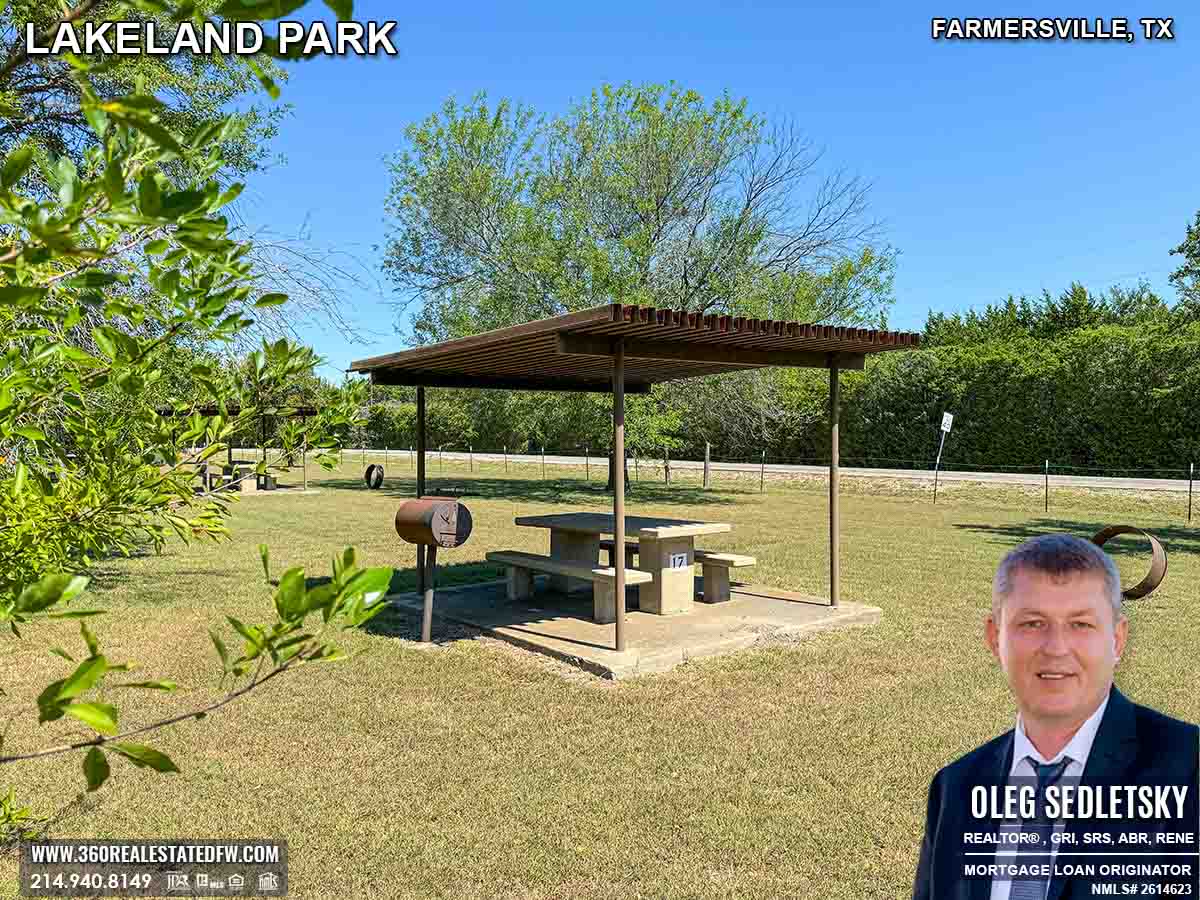
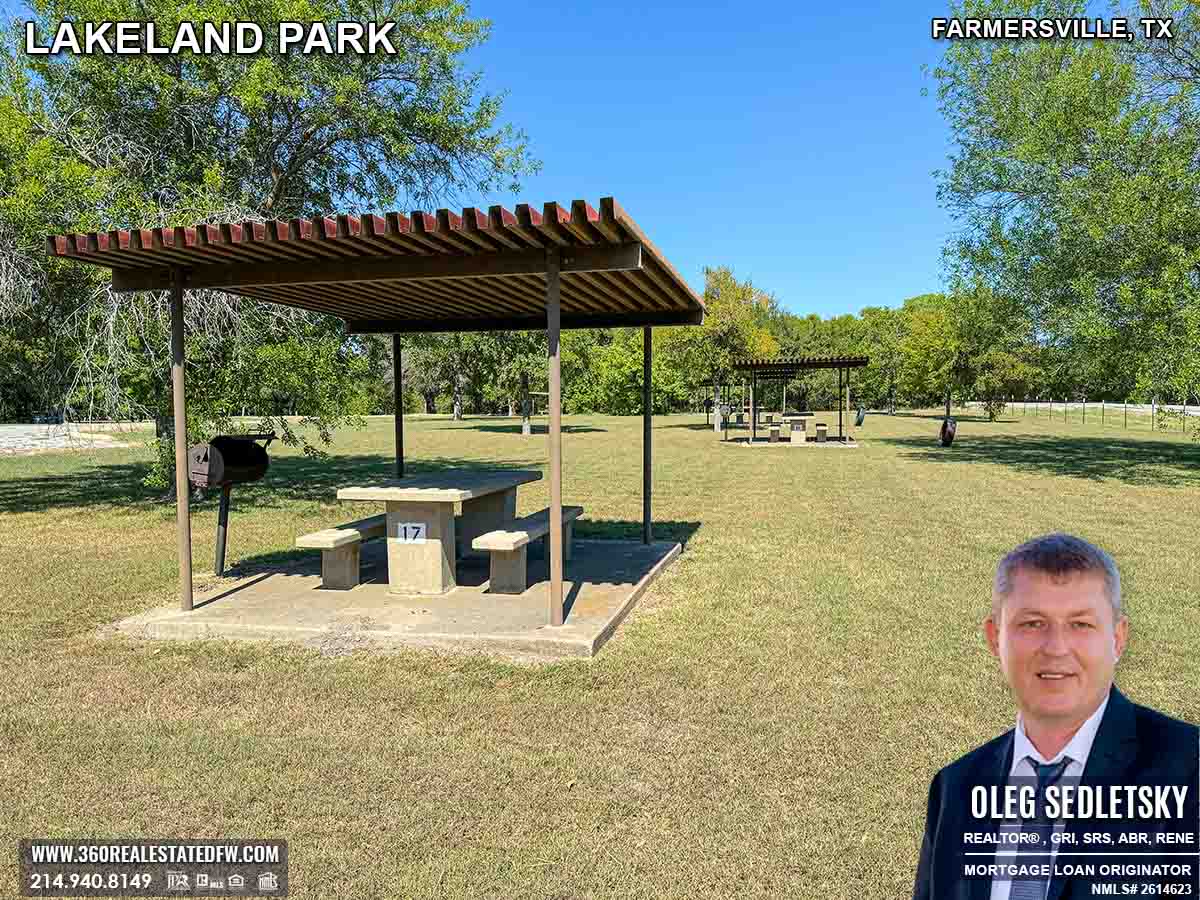
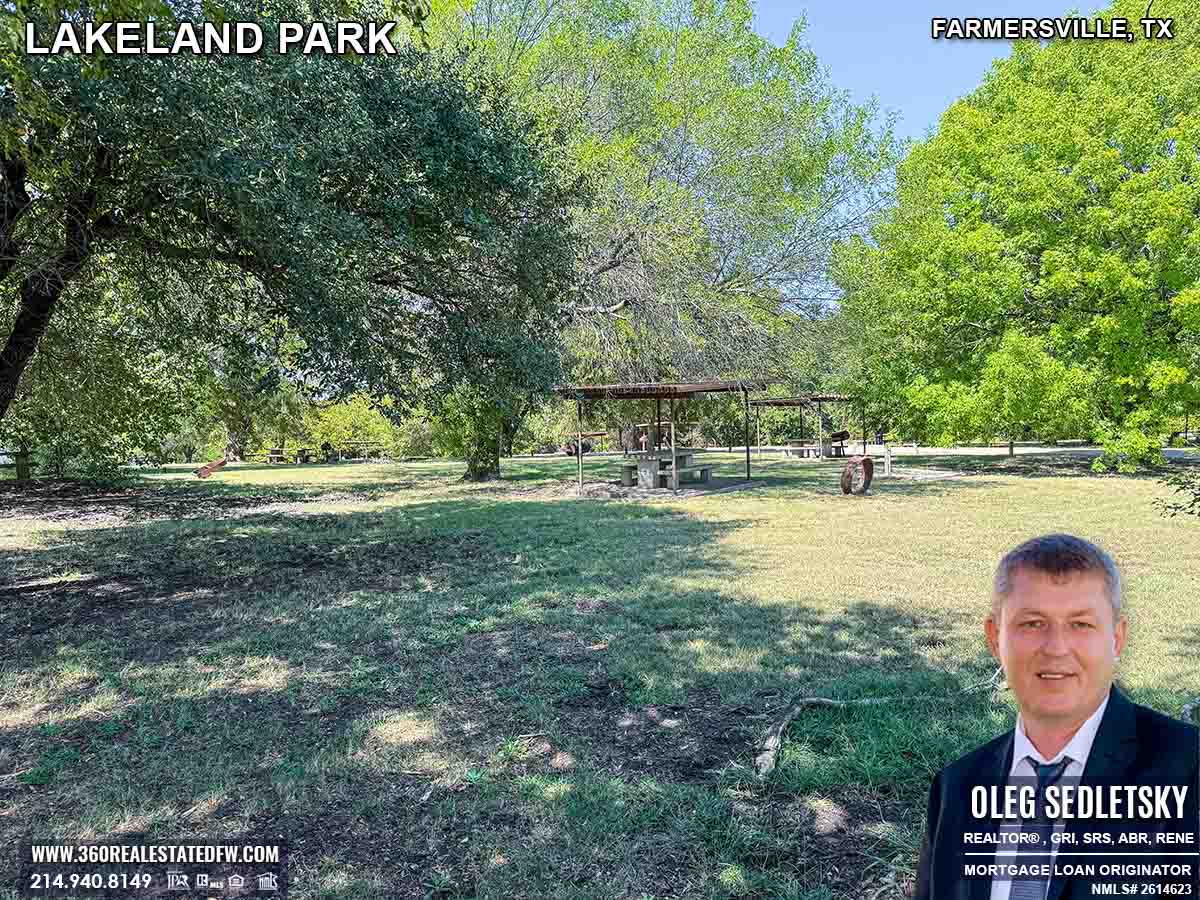
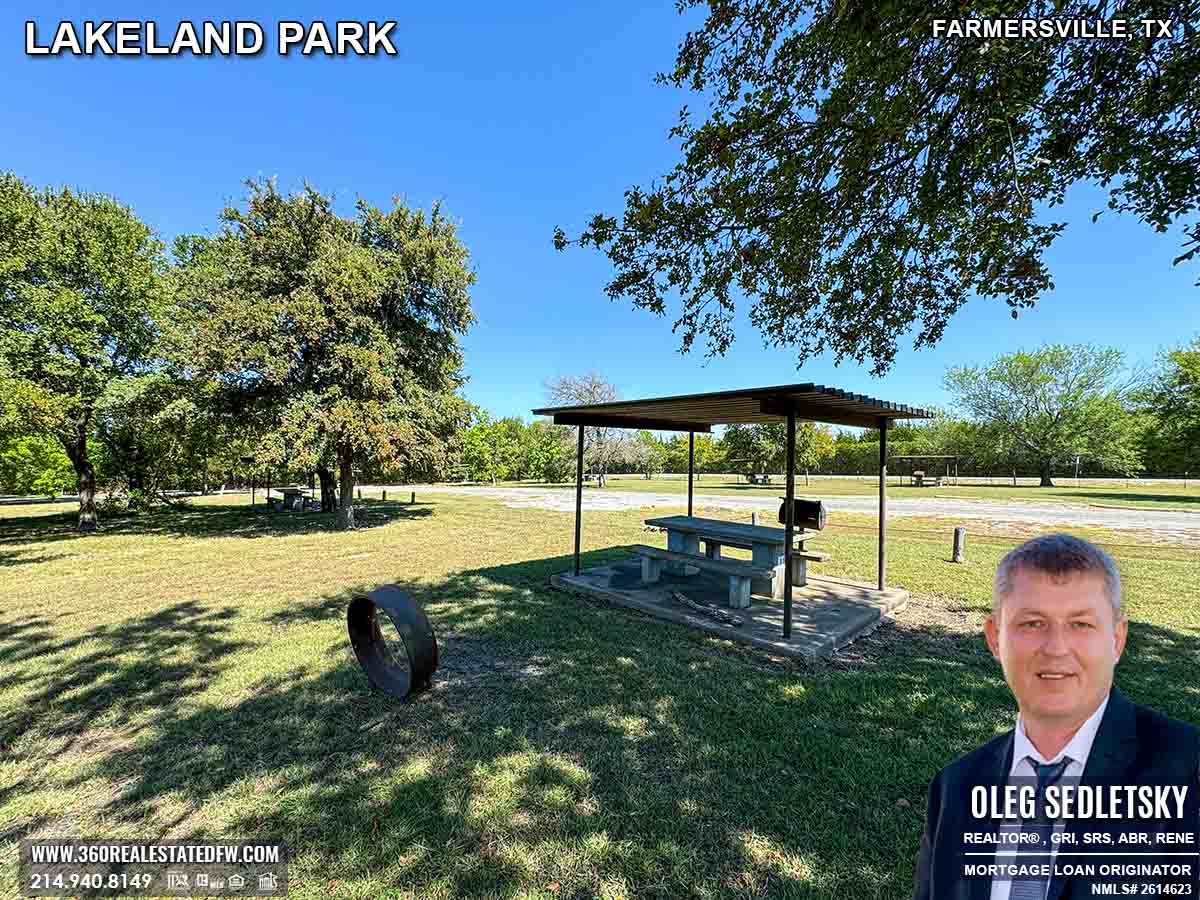
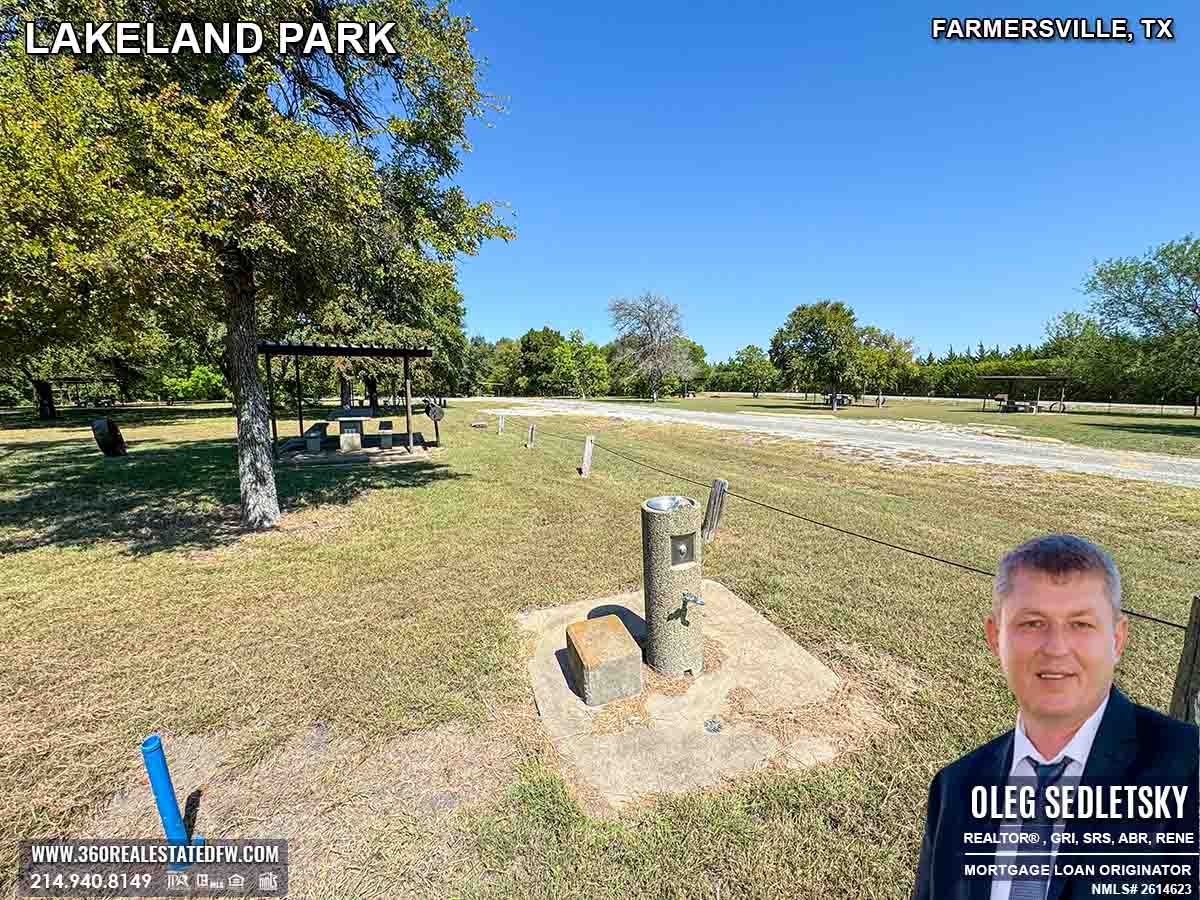
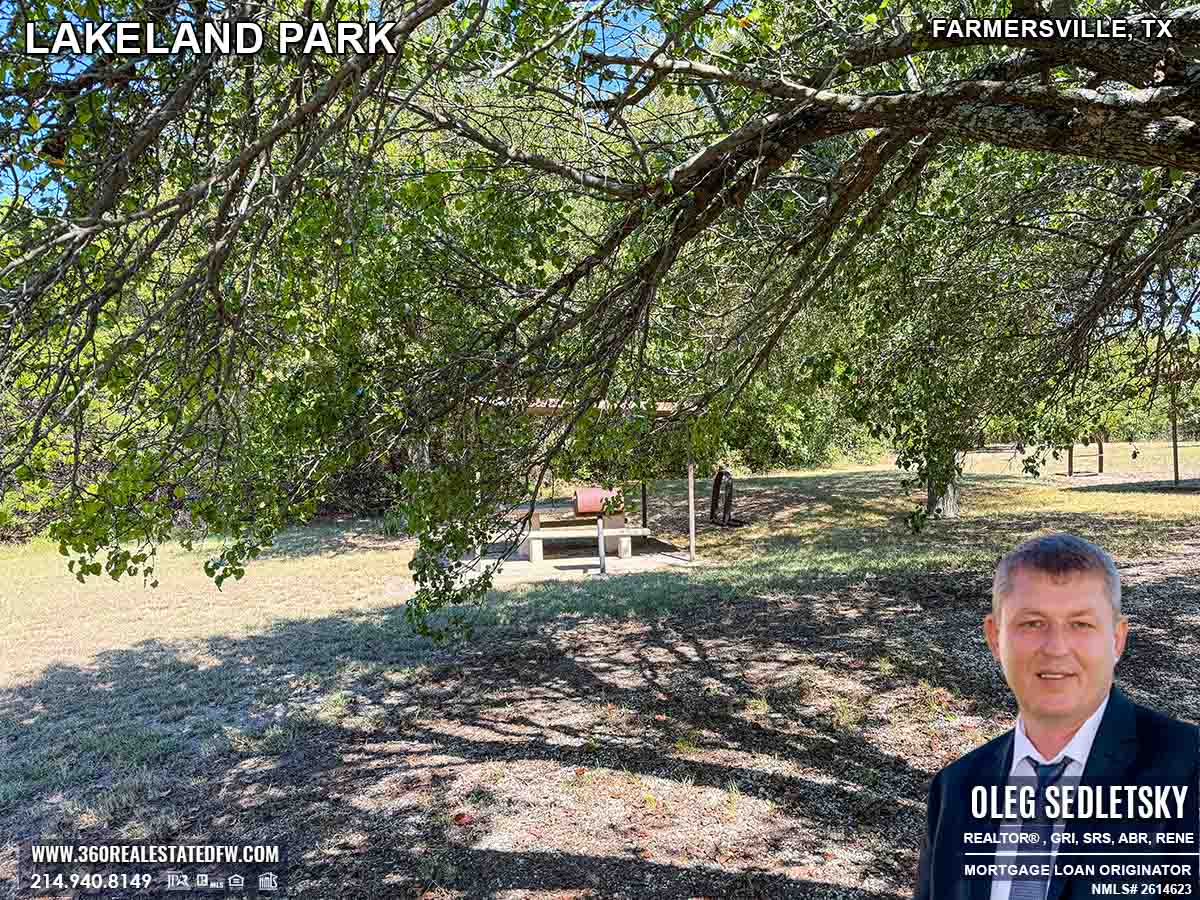
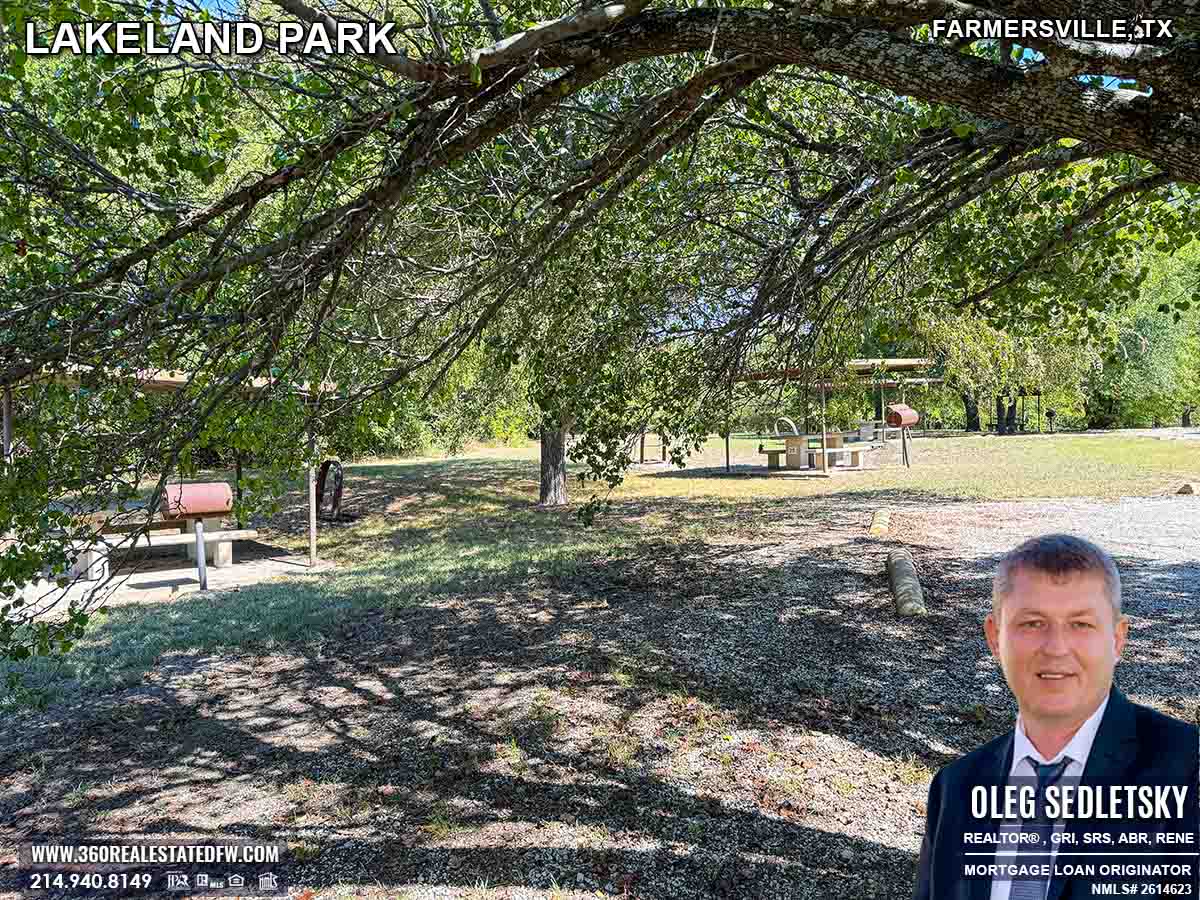
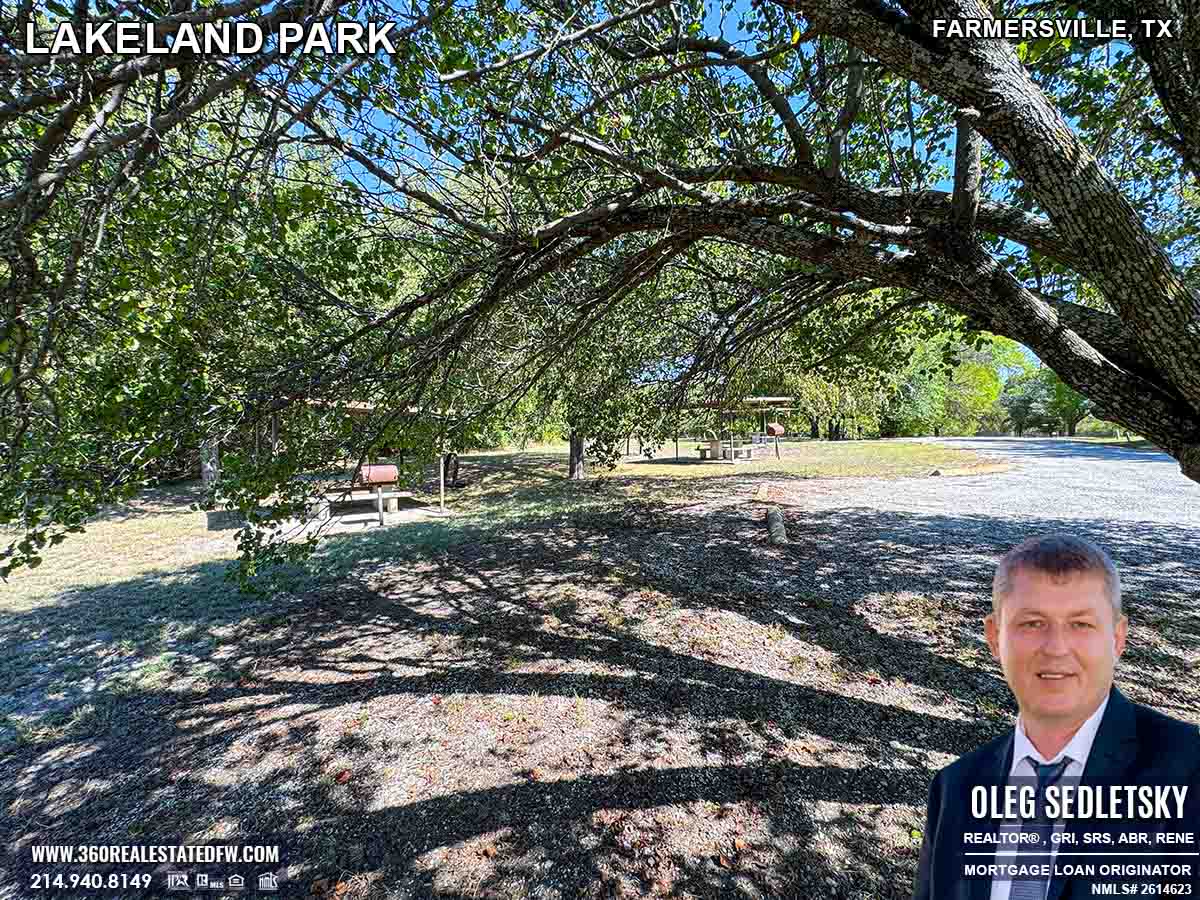
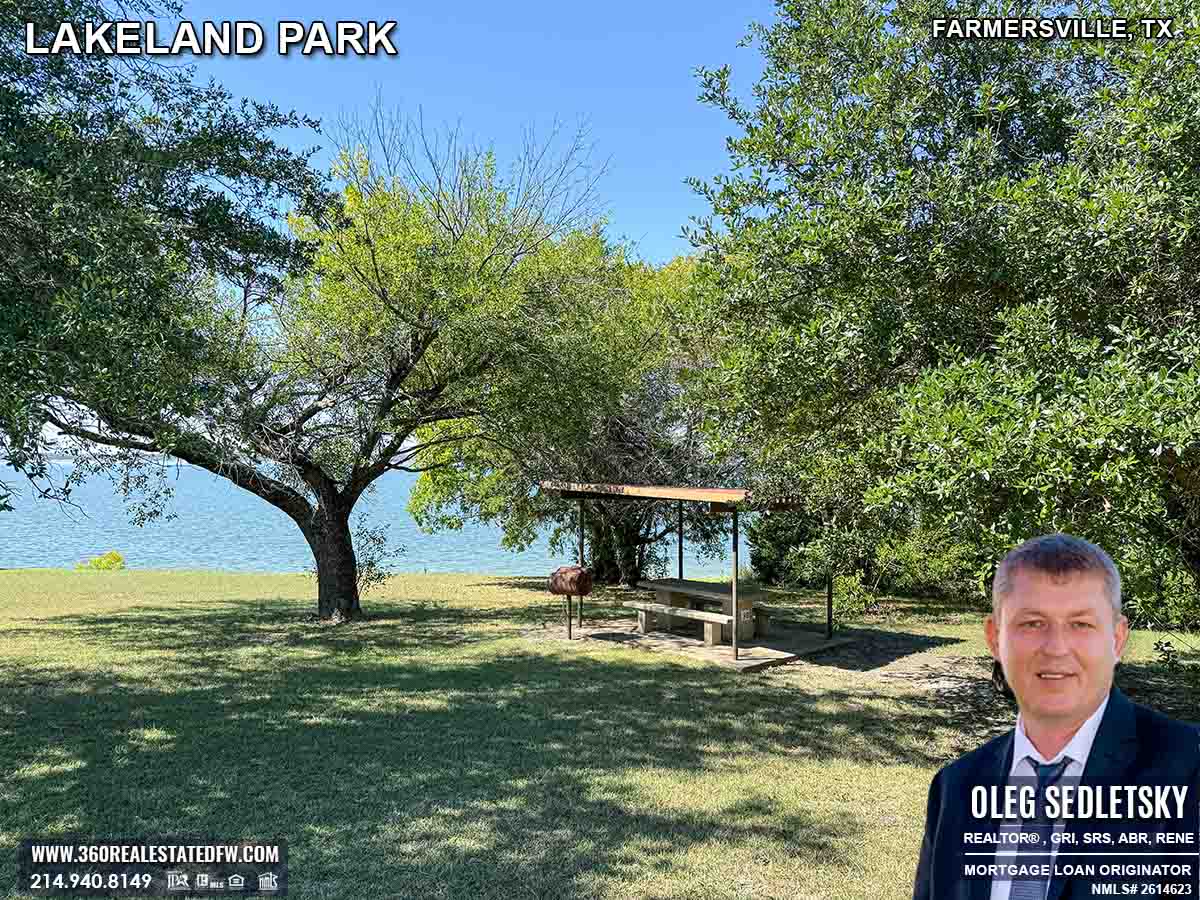
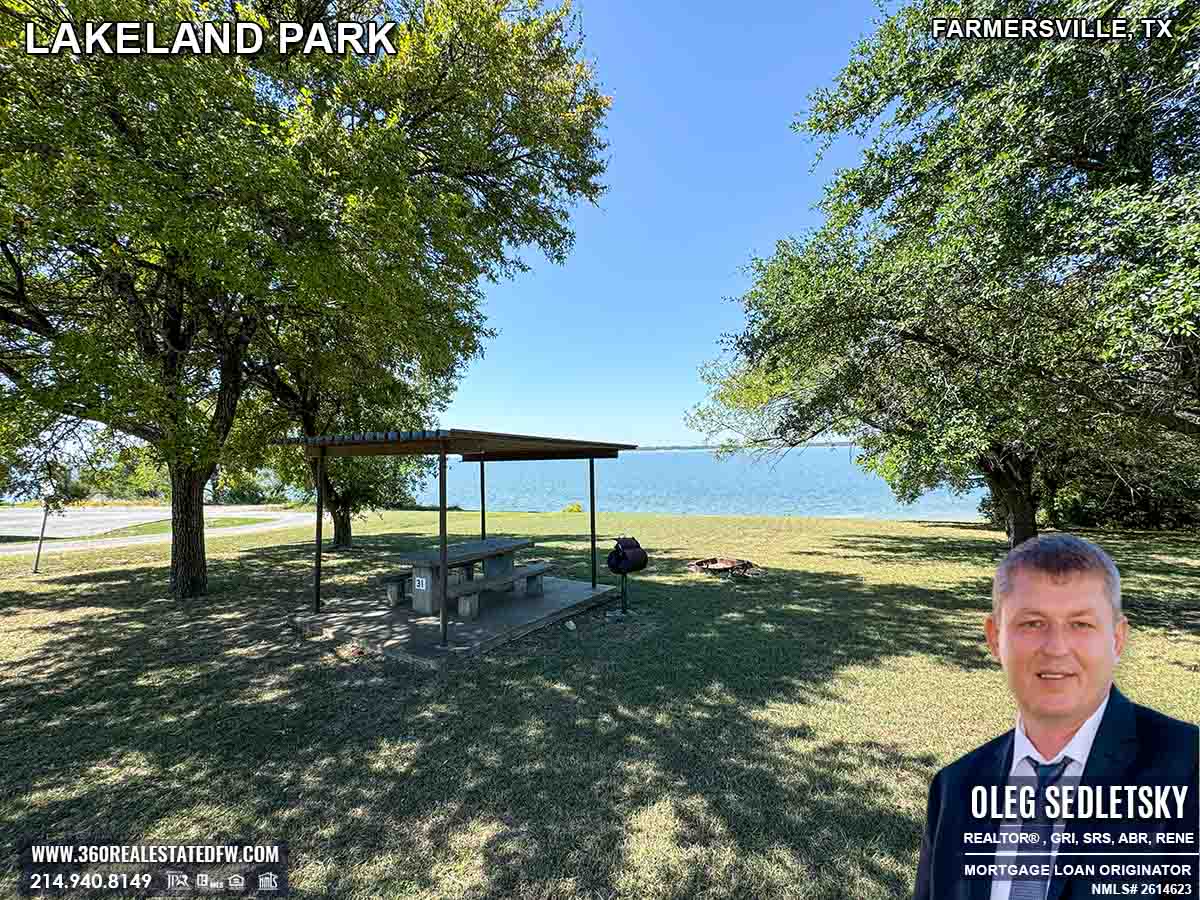
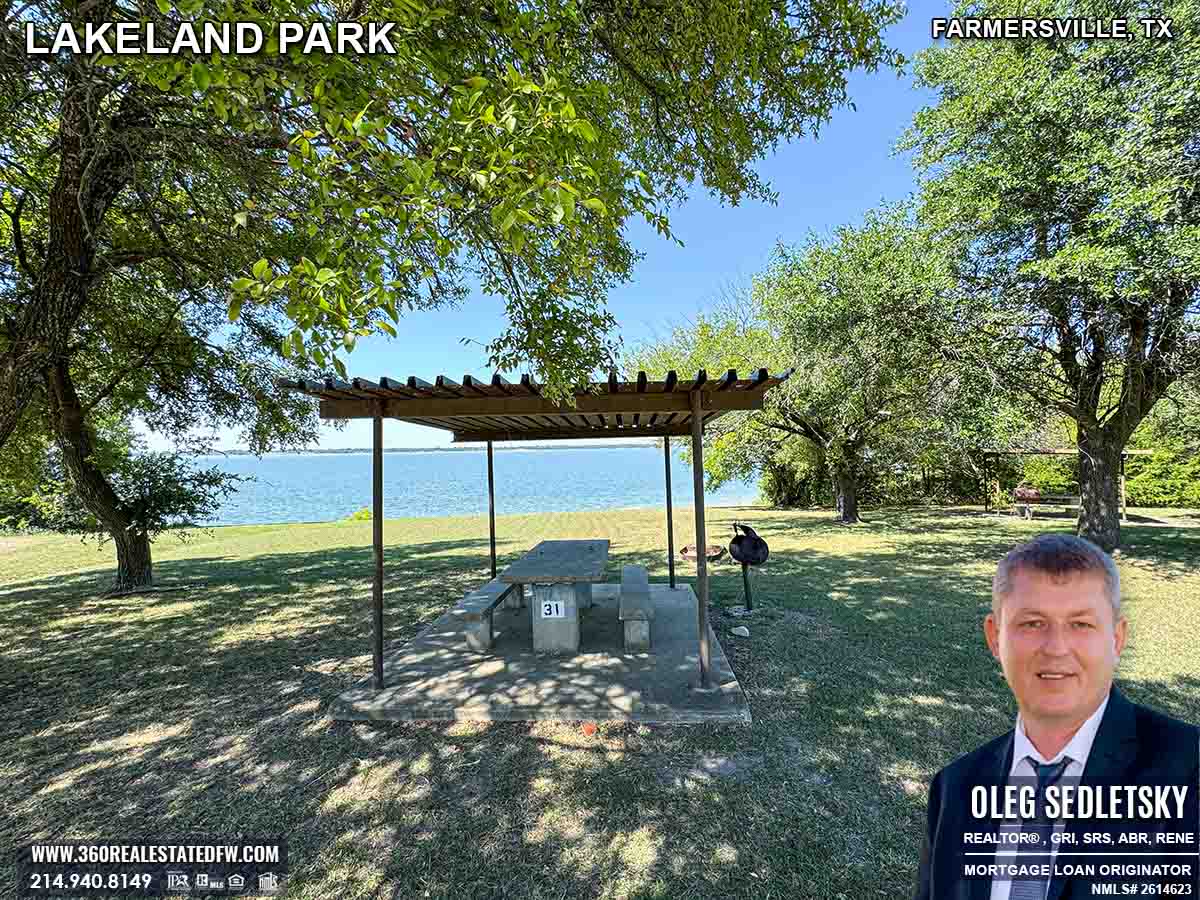
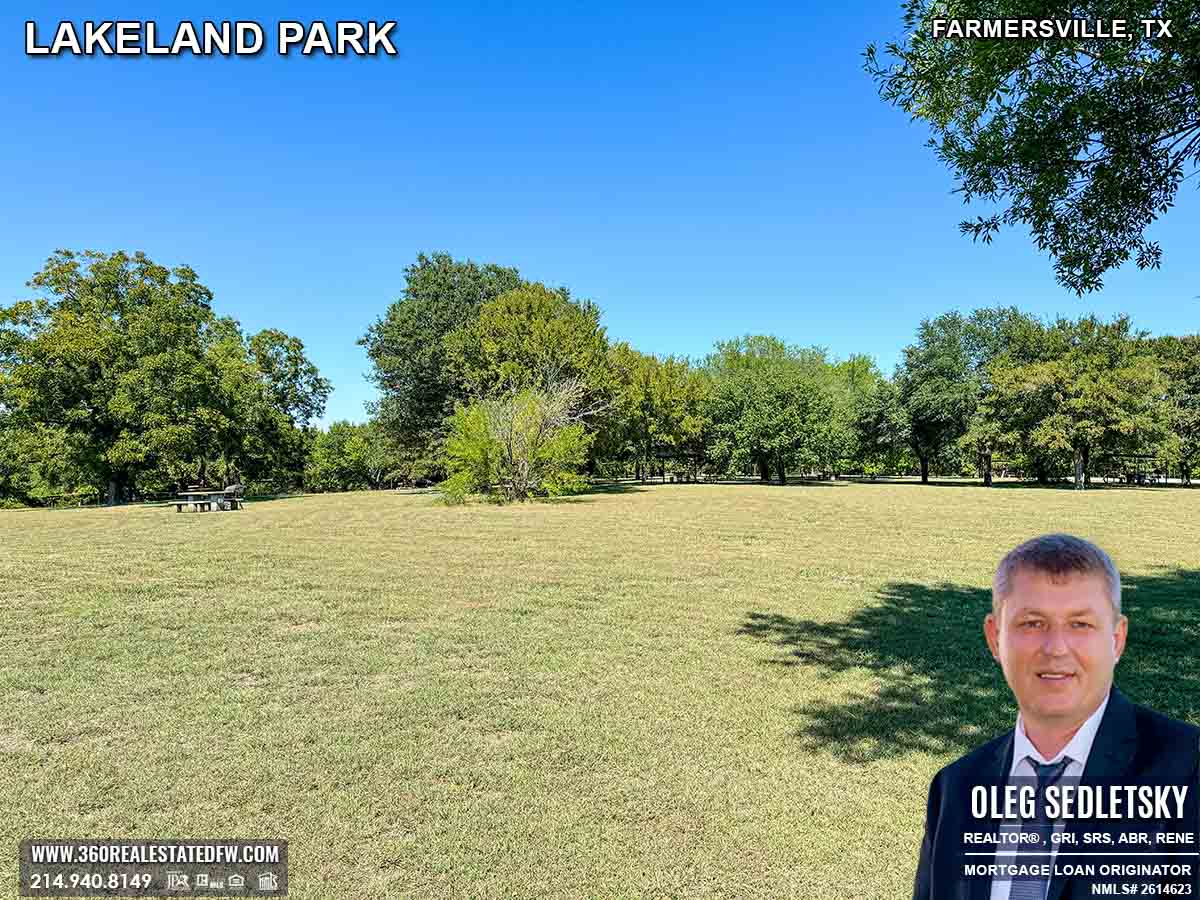
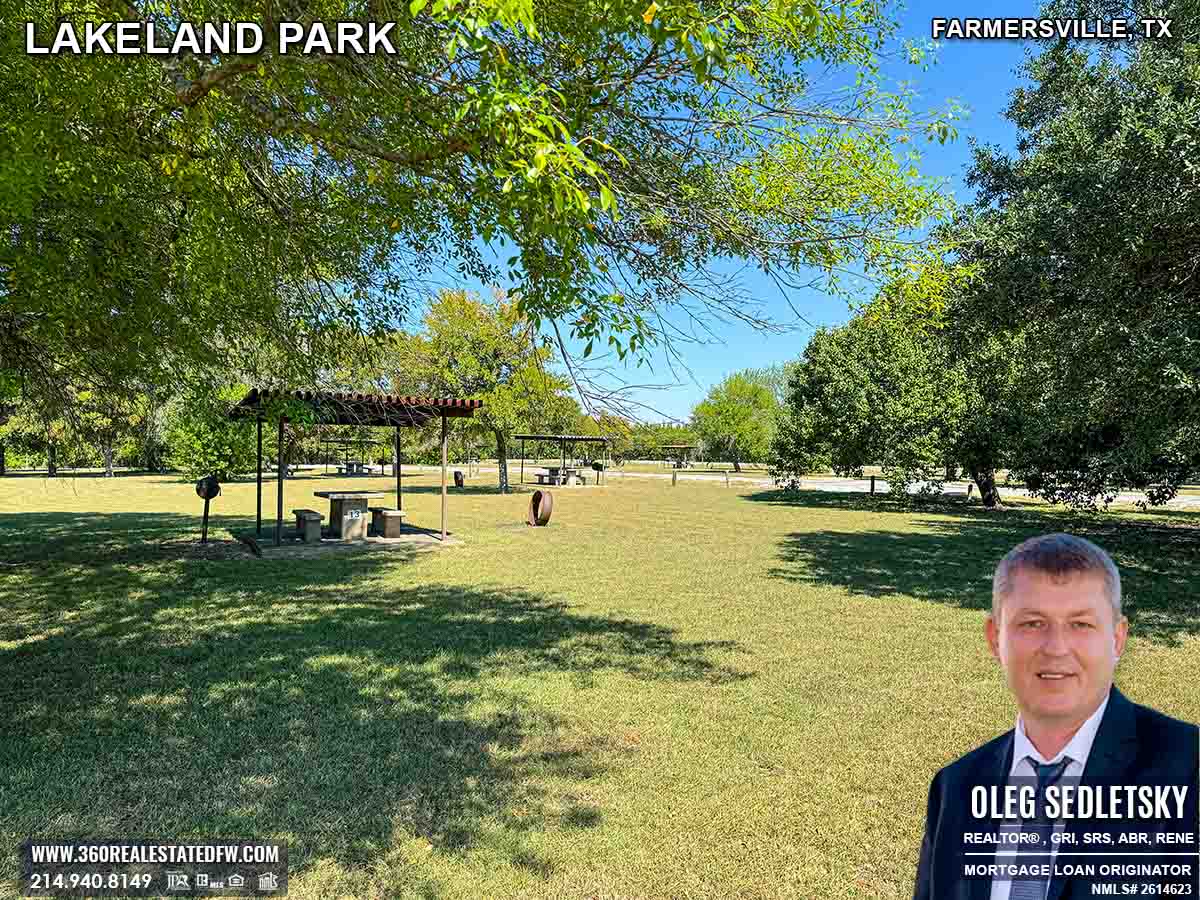
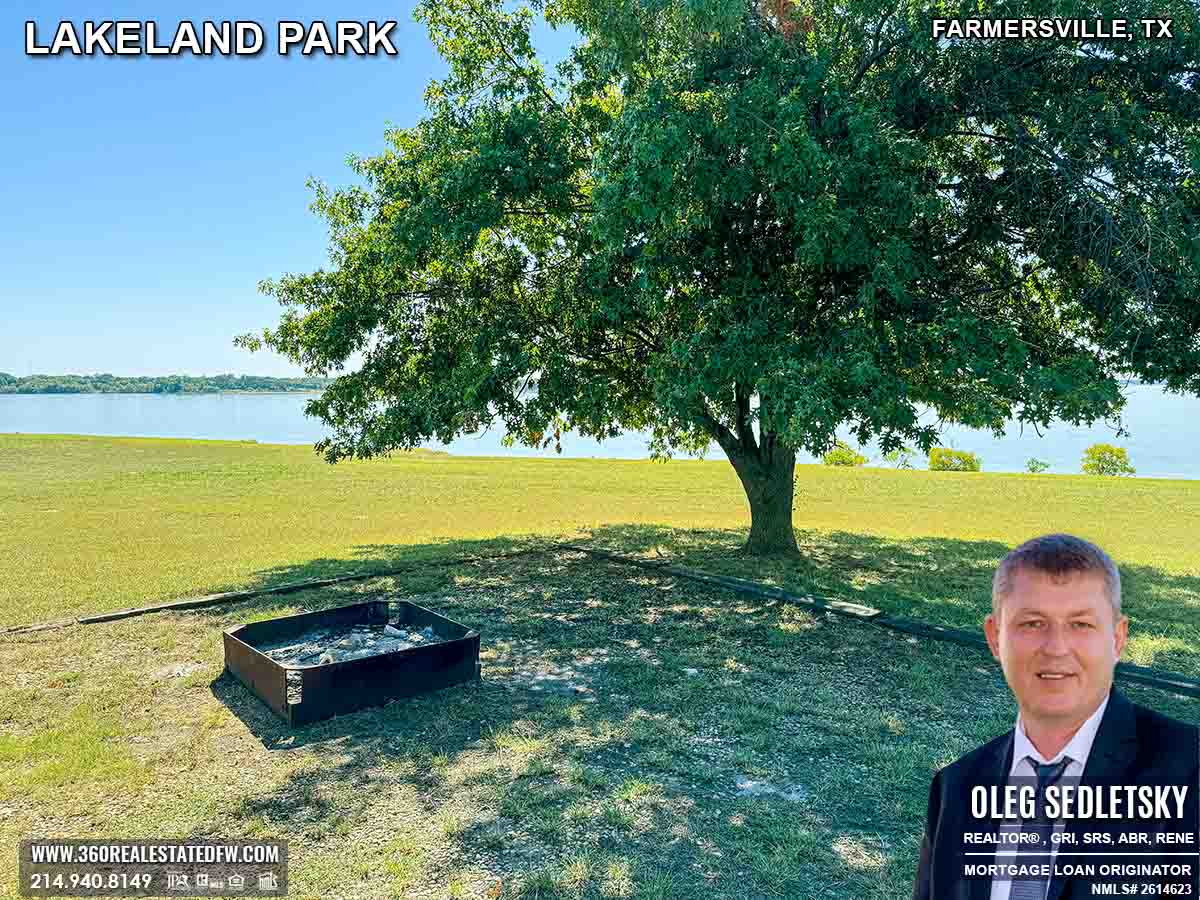
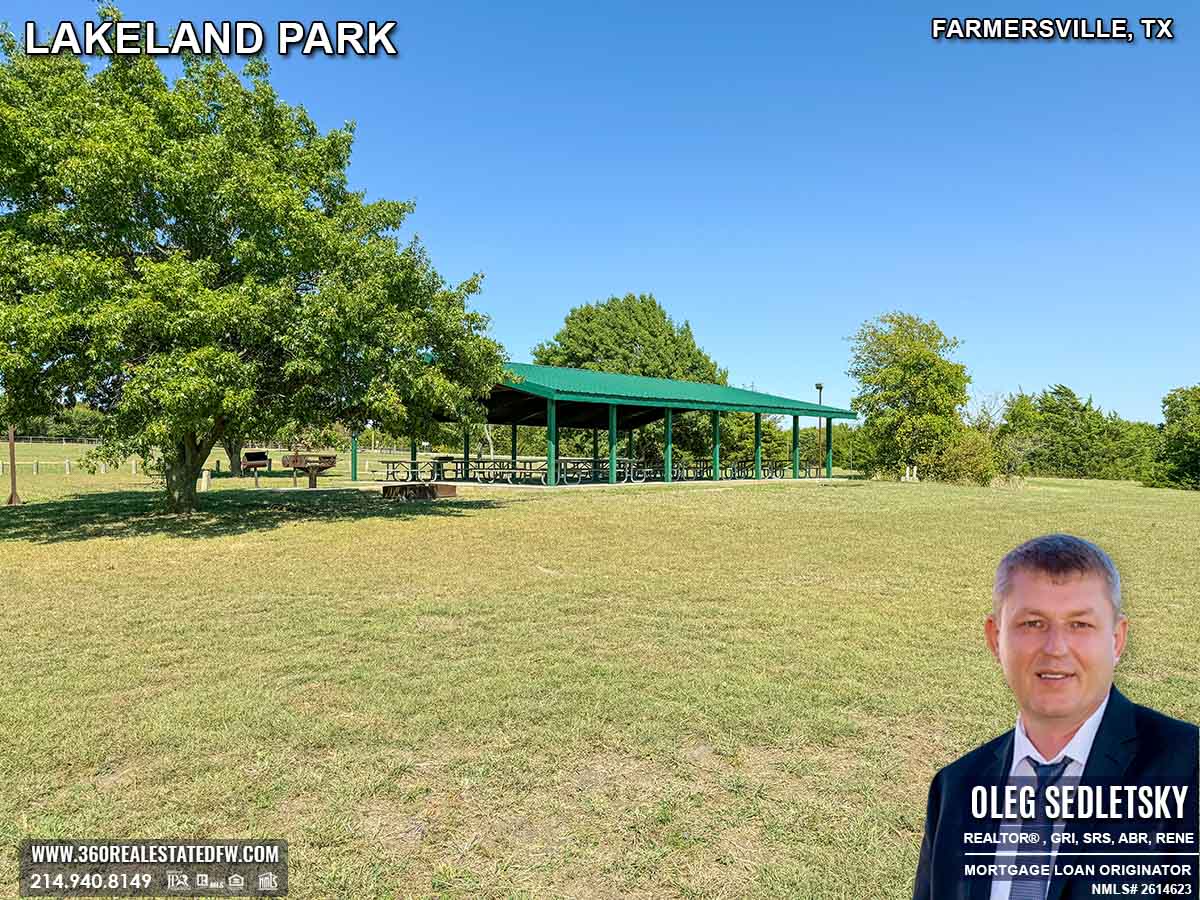
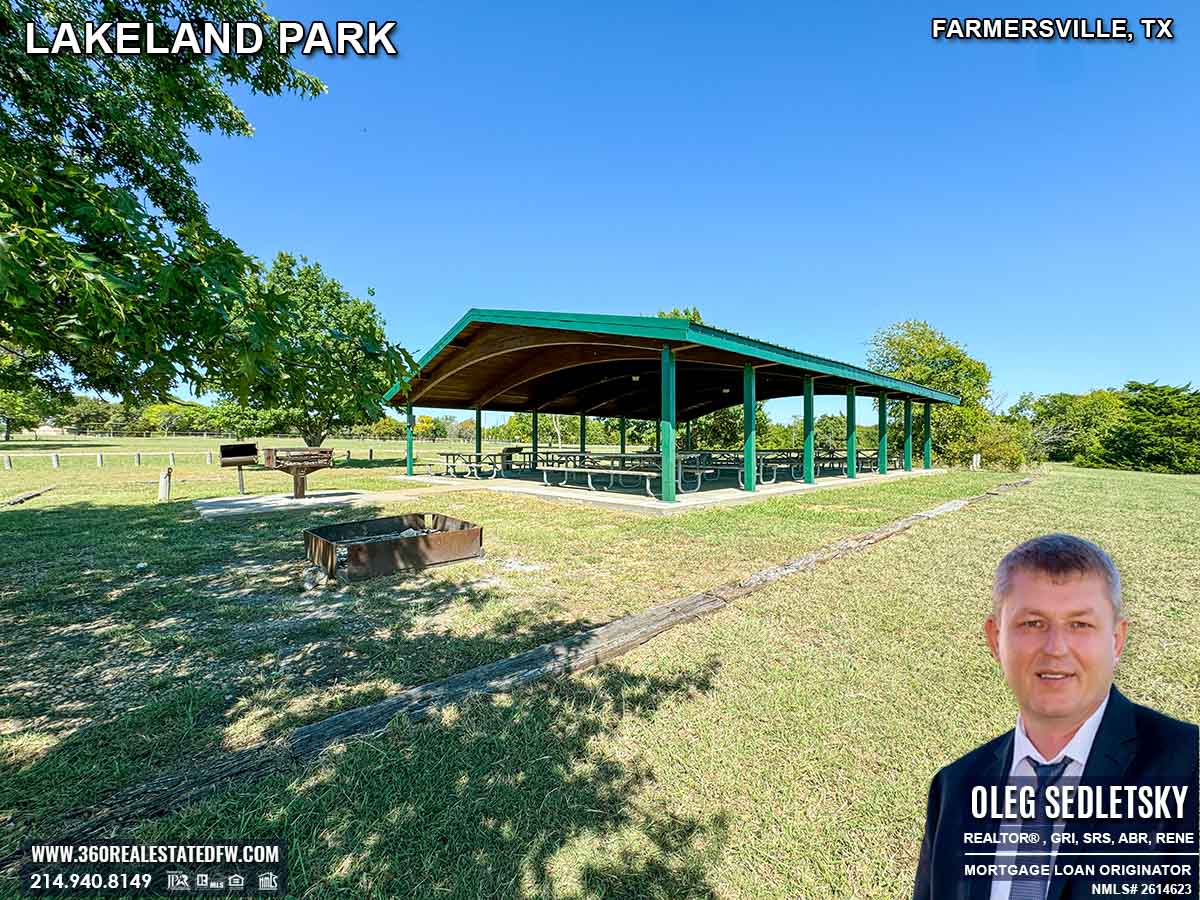
Picnic Sites in Lakeland Park
For those looking to enjoy a meal outdoors, there are 32 picnic sites scattered throughout the area. Each site comes with picnic tables, a grill, a fire pit, and nearby parking. Some sites offer lakeside views, while others are shaded by beautiful, mature trees. Whether you want sun or shade, there’s a spot for you.
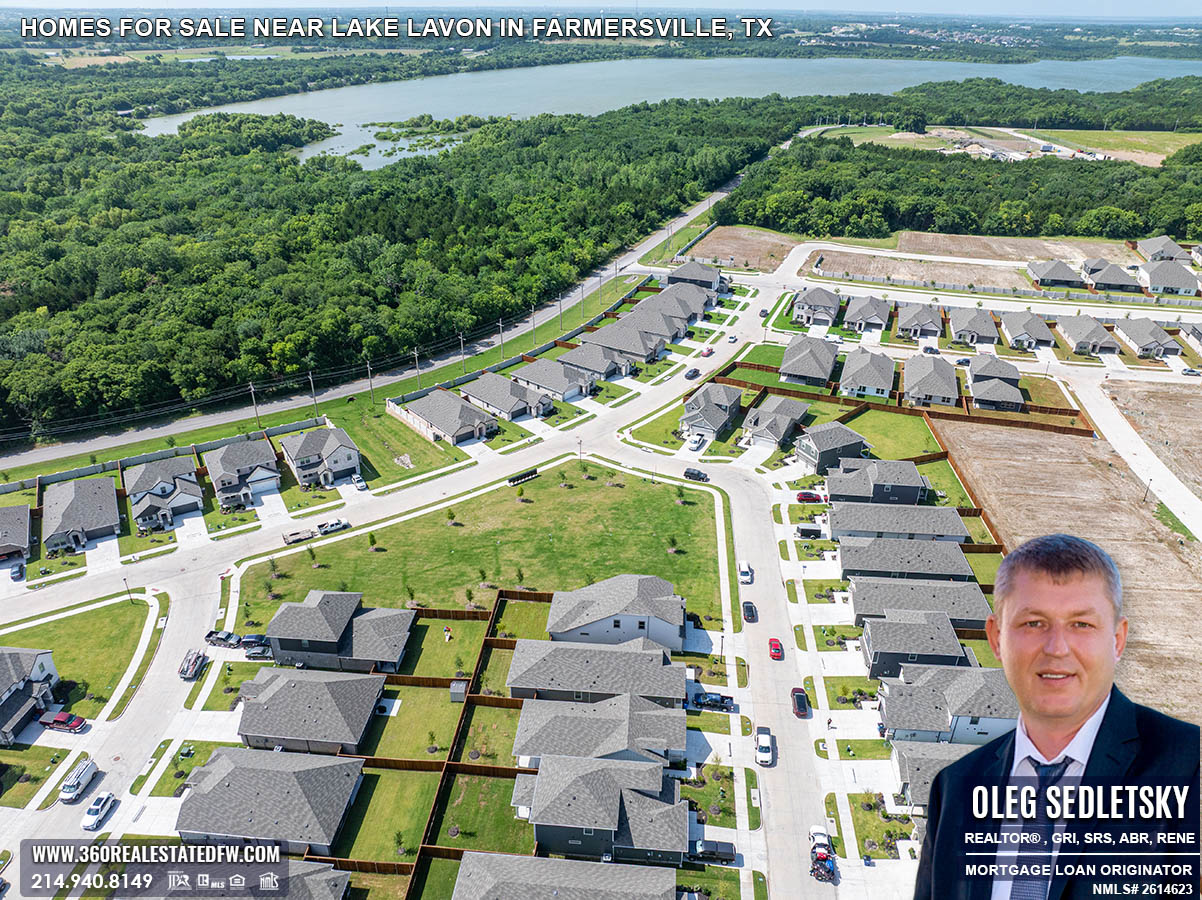
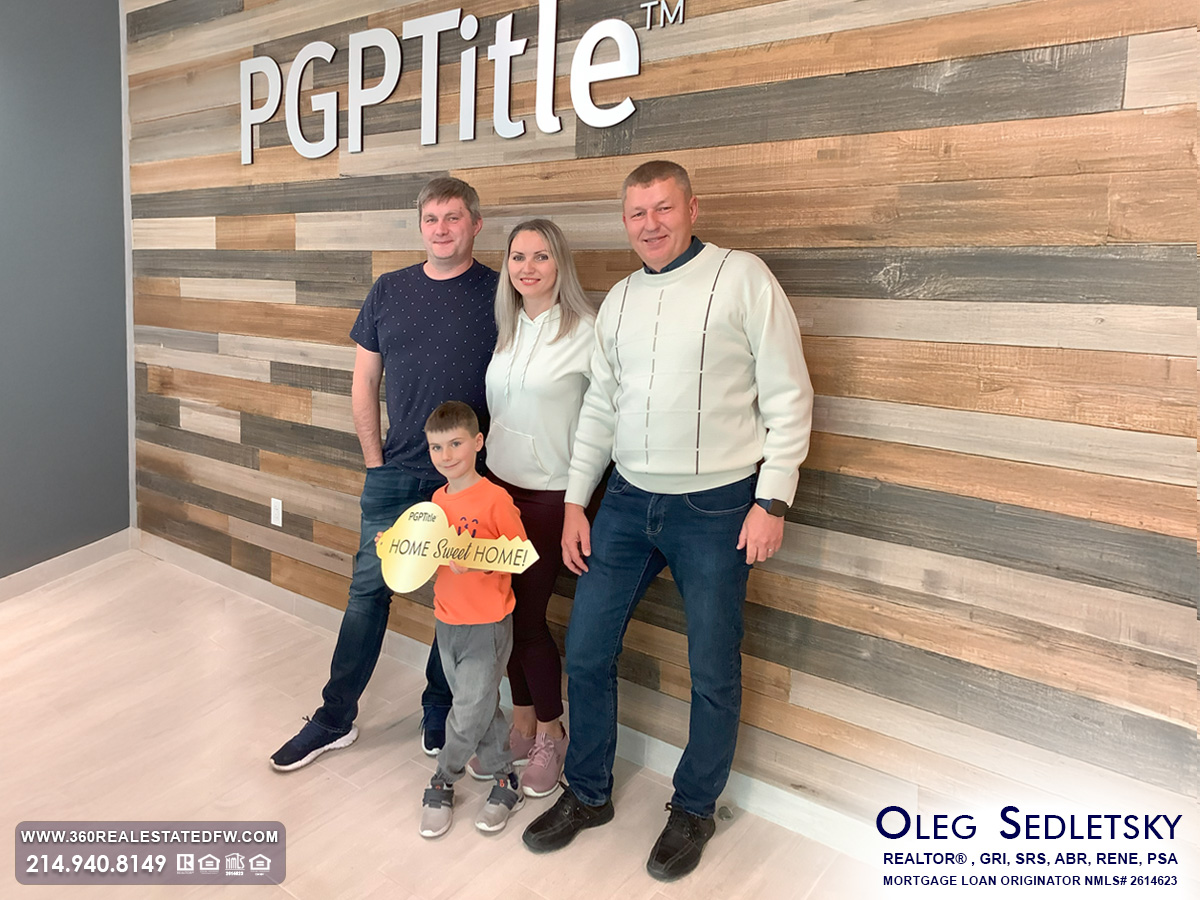
Looking for a New Home Close to the Lakeland Park? Absolutely!
If you’ve fallen in love with the area and want to make it your permanent escape, you’re in luck. There are move-in-ready homes as well as newly constructed properties available nearby. Reach out to me, and I’d be happy to help you find your perfect home with easy access to this amazing park.
Unlock Exceptional Service!
Assistance with all your real estate needs in the Dallas-Fort Worth area is just a click or call away. Reach out at 214-940-8149 or connect through the links below.
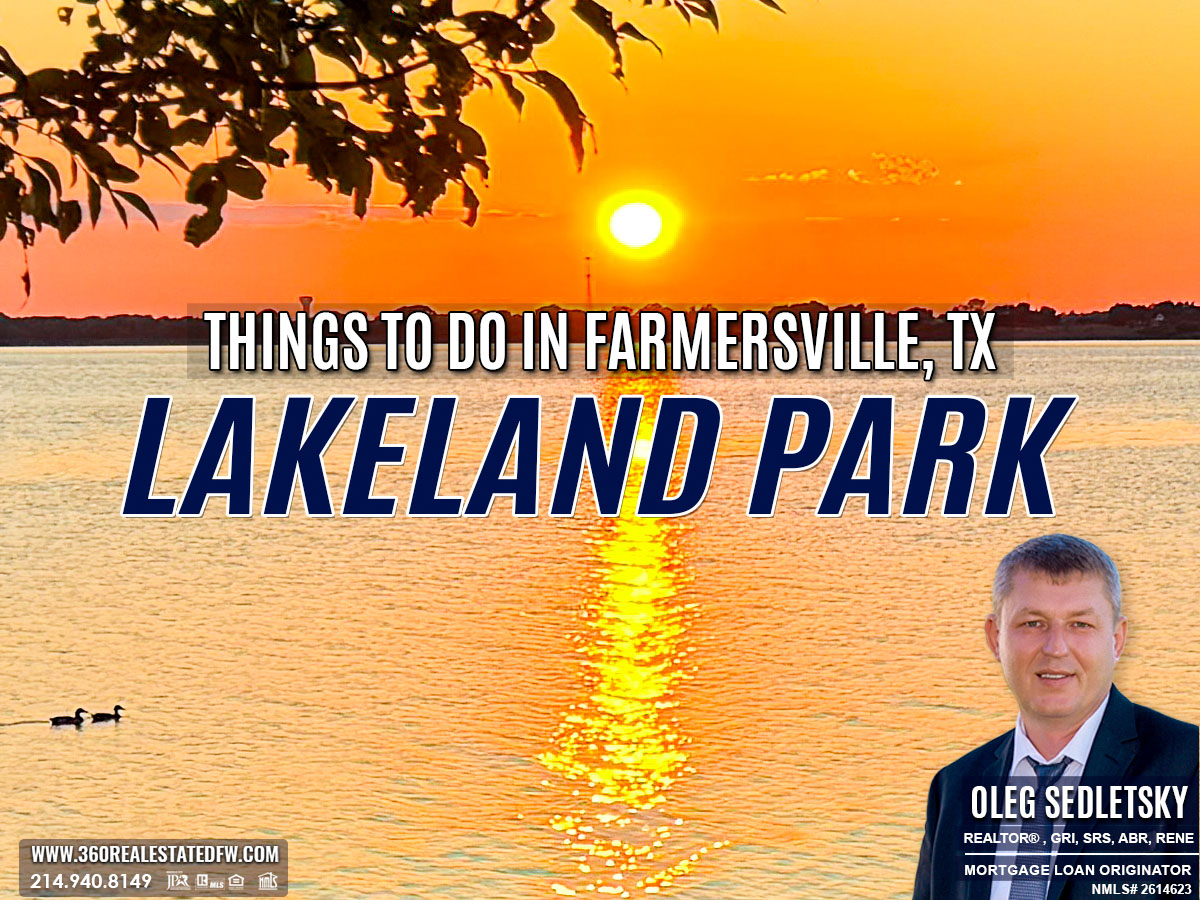
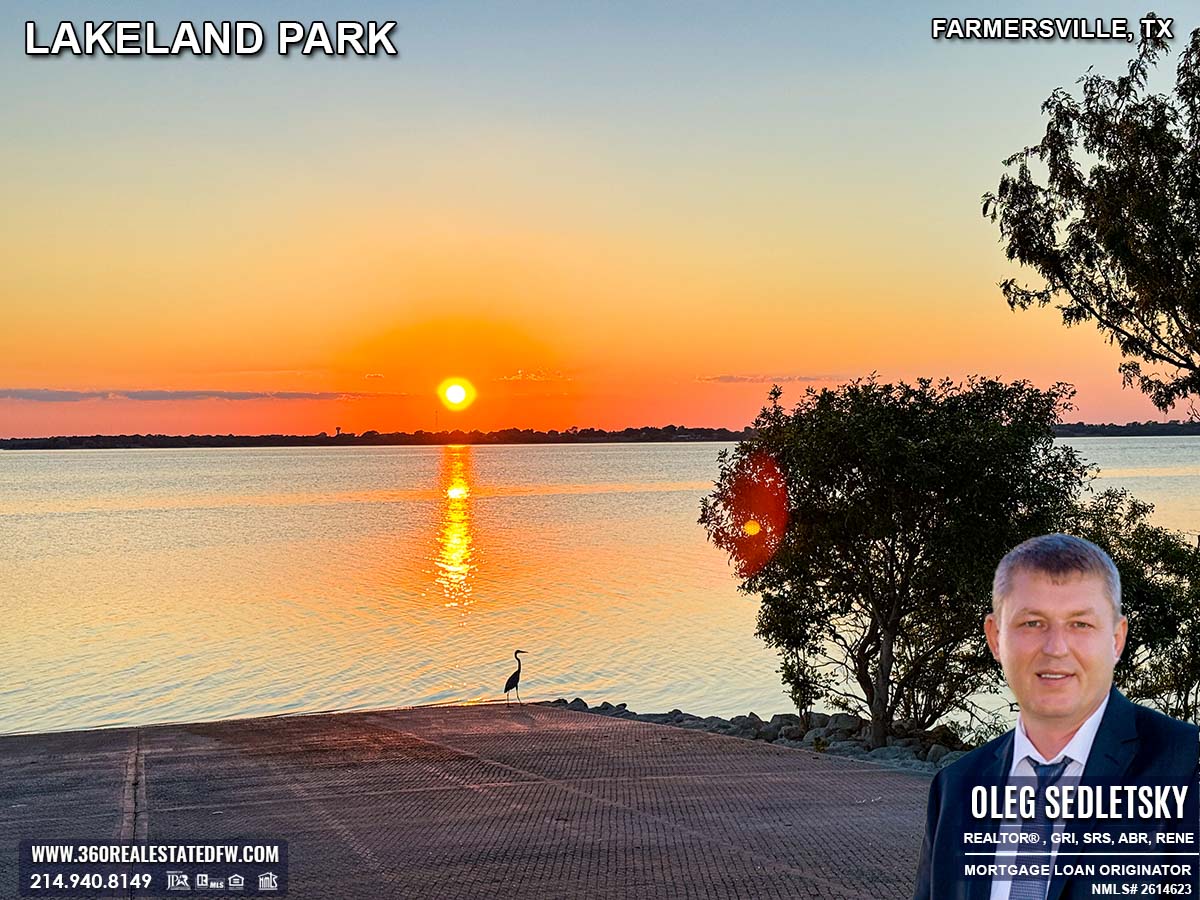
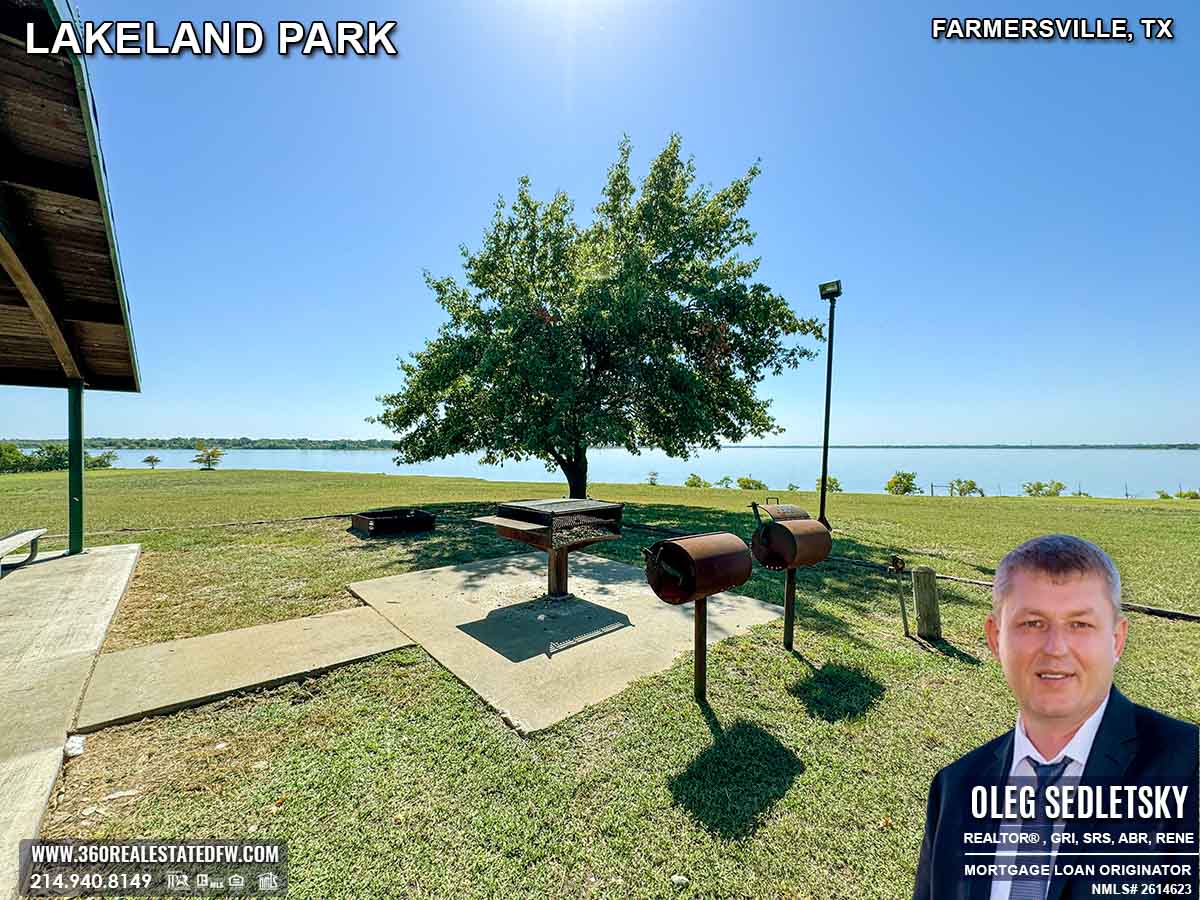
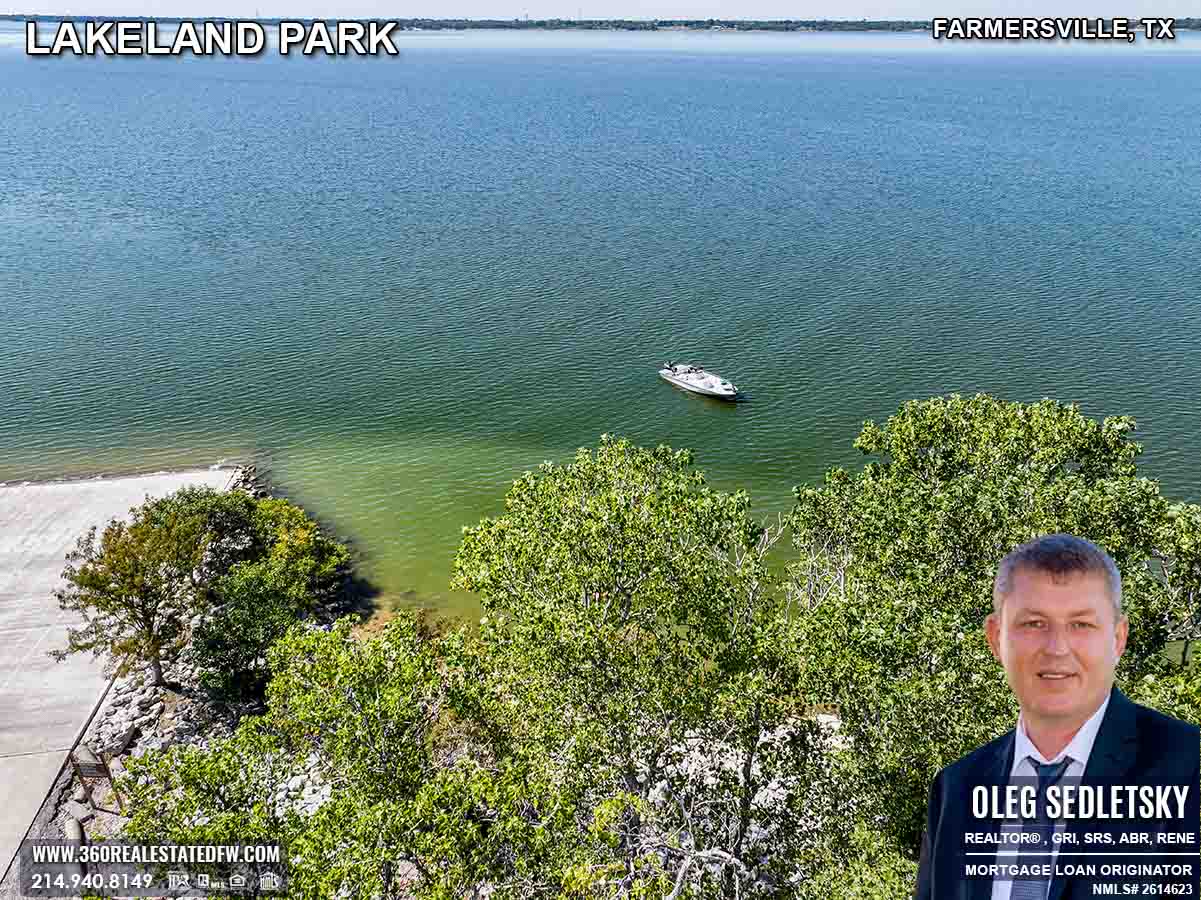
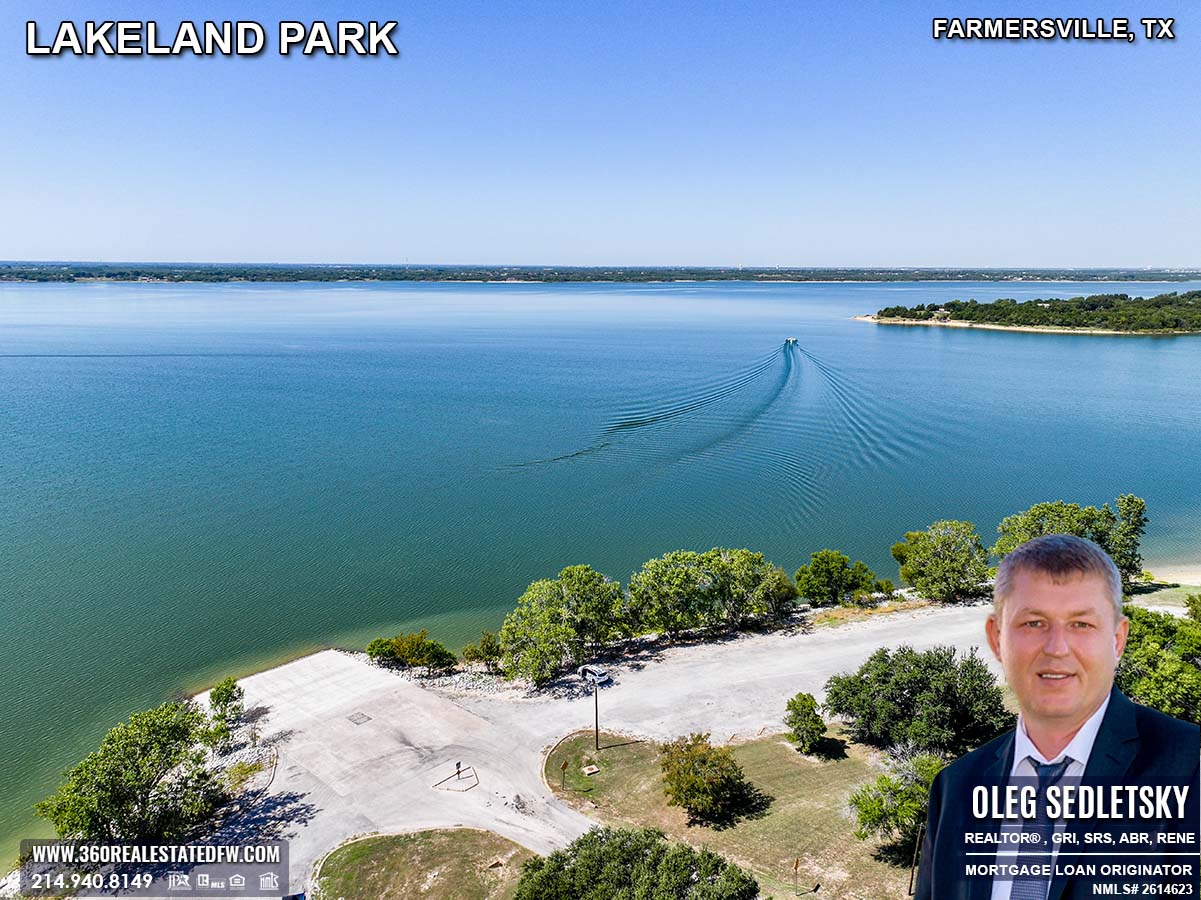
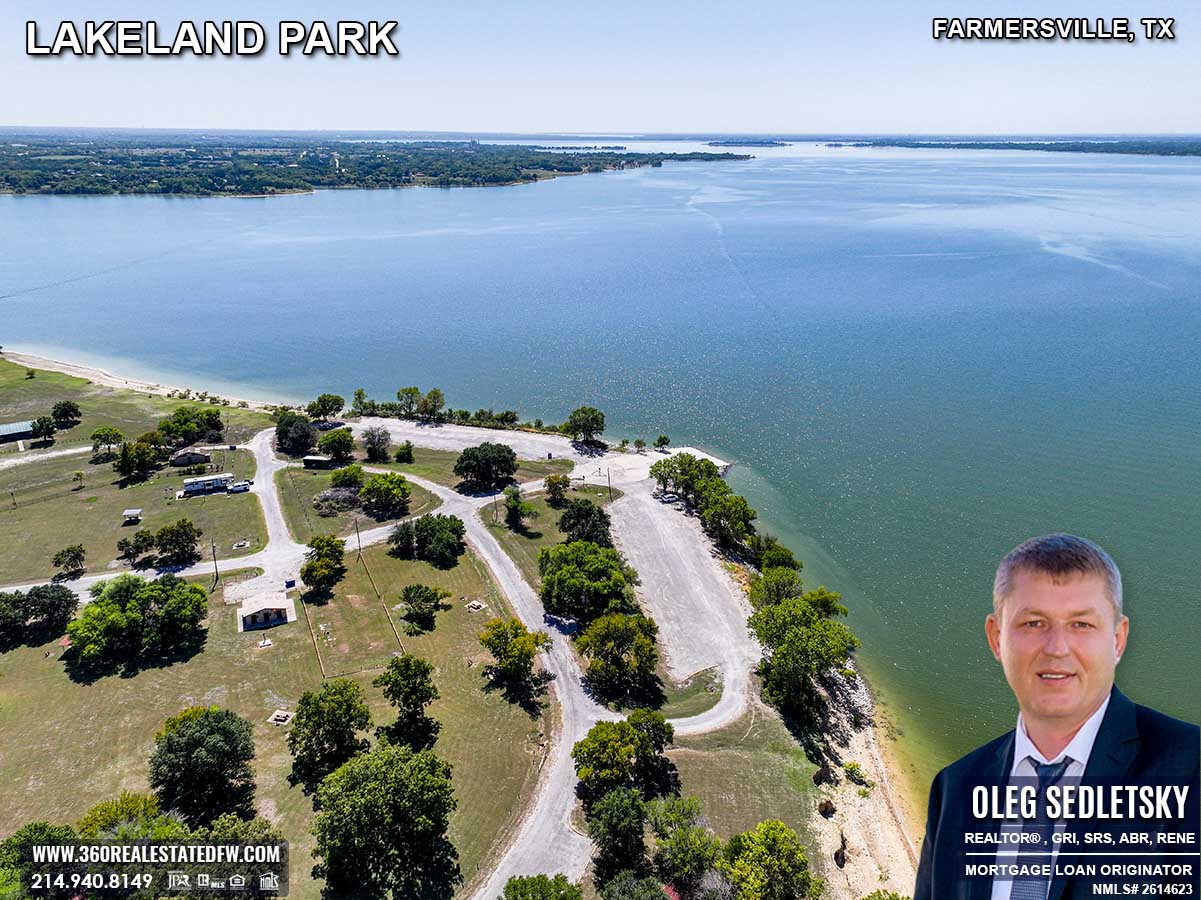
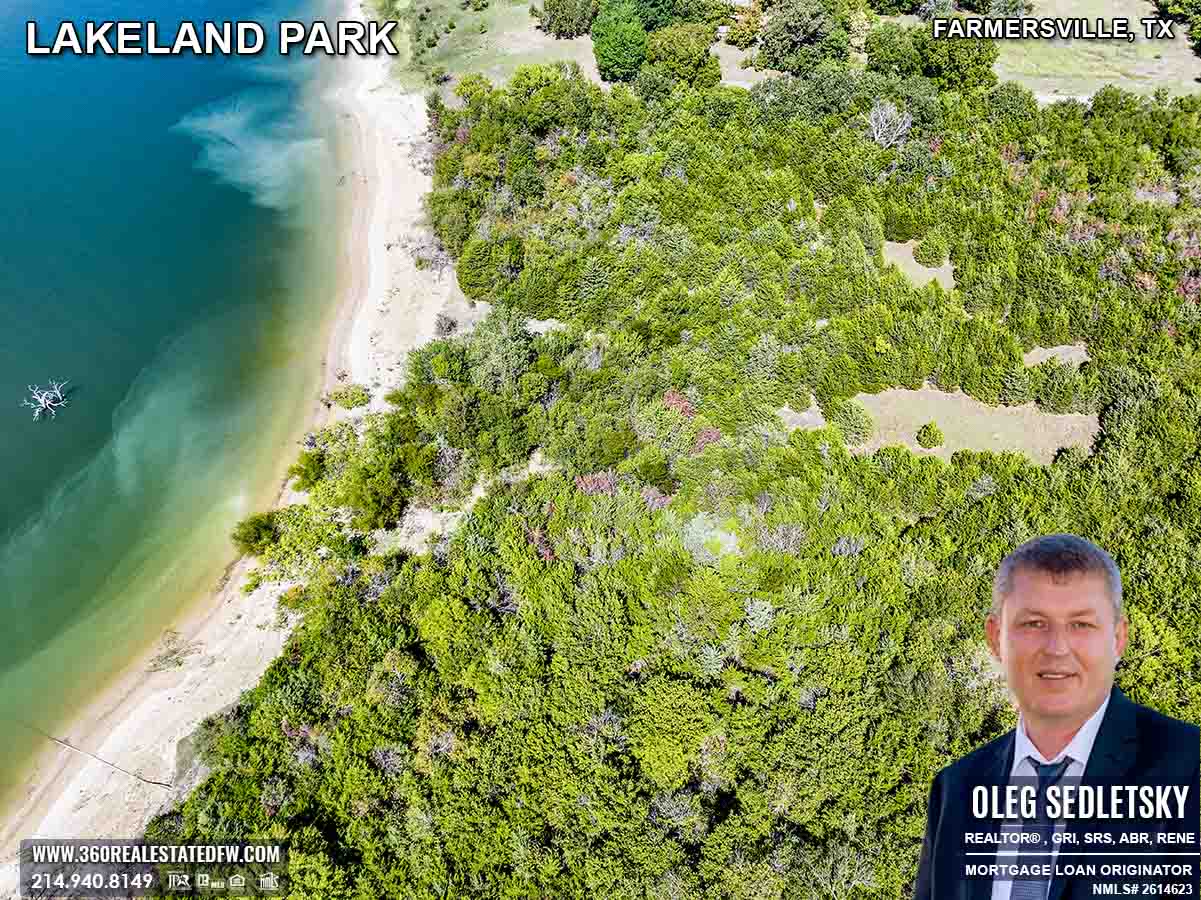
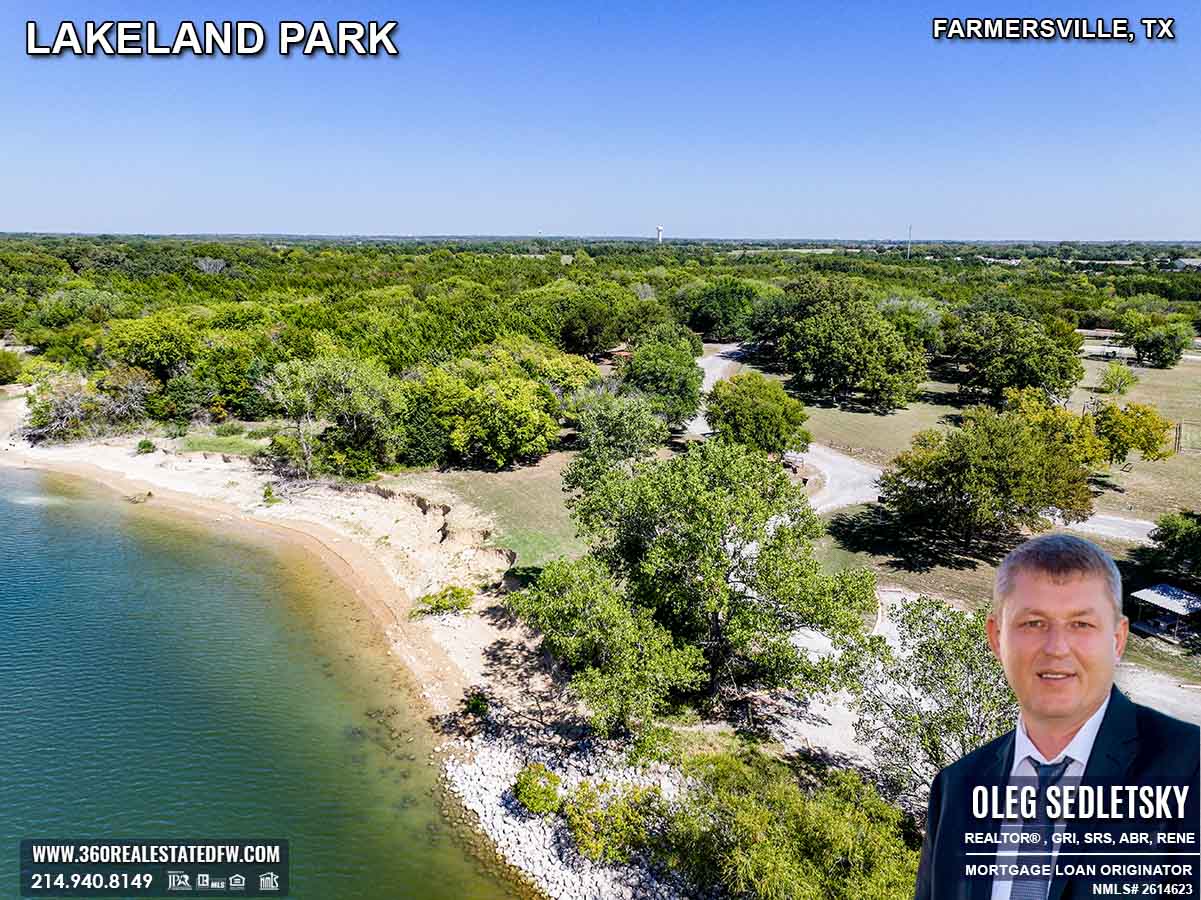
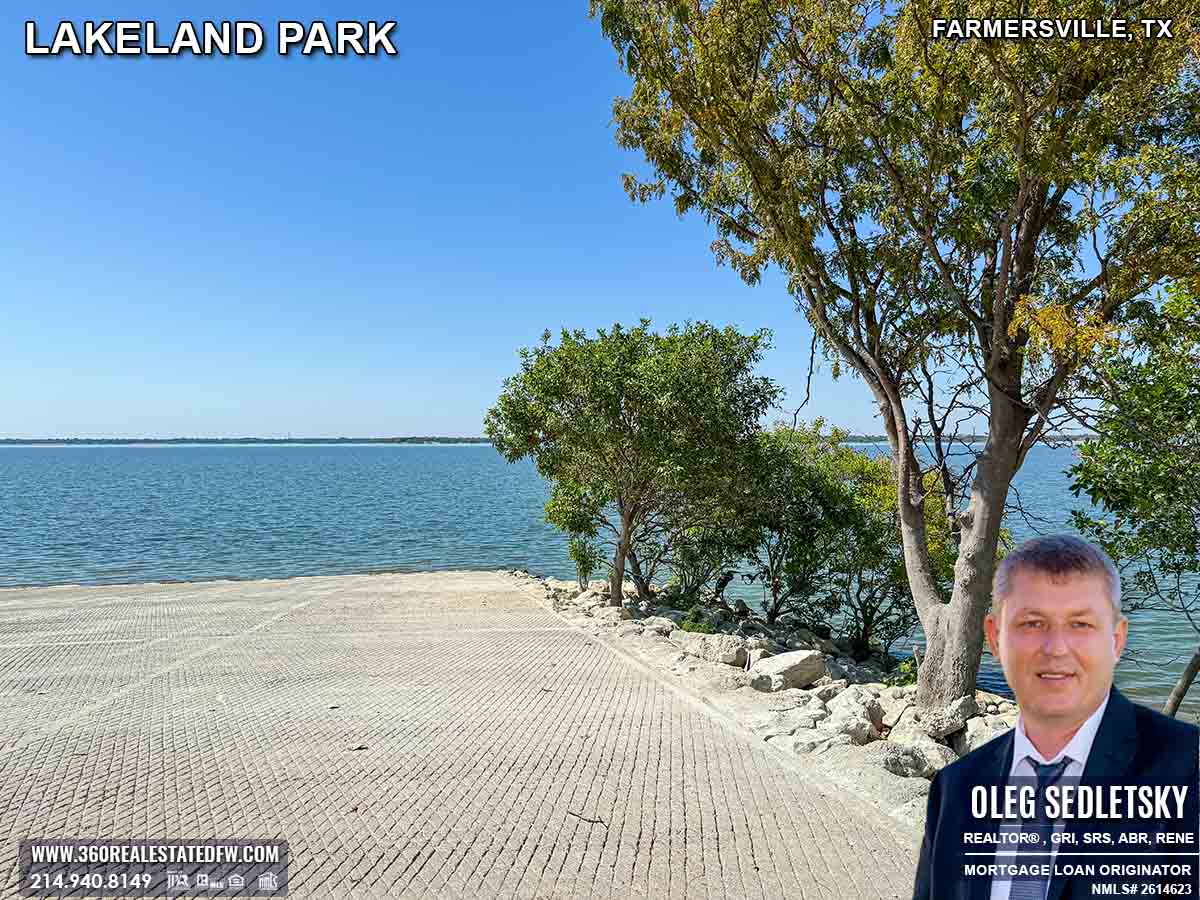
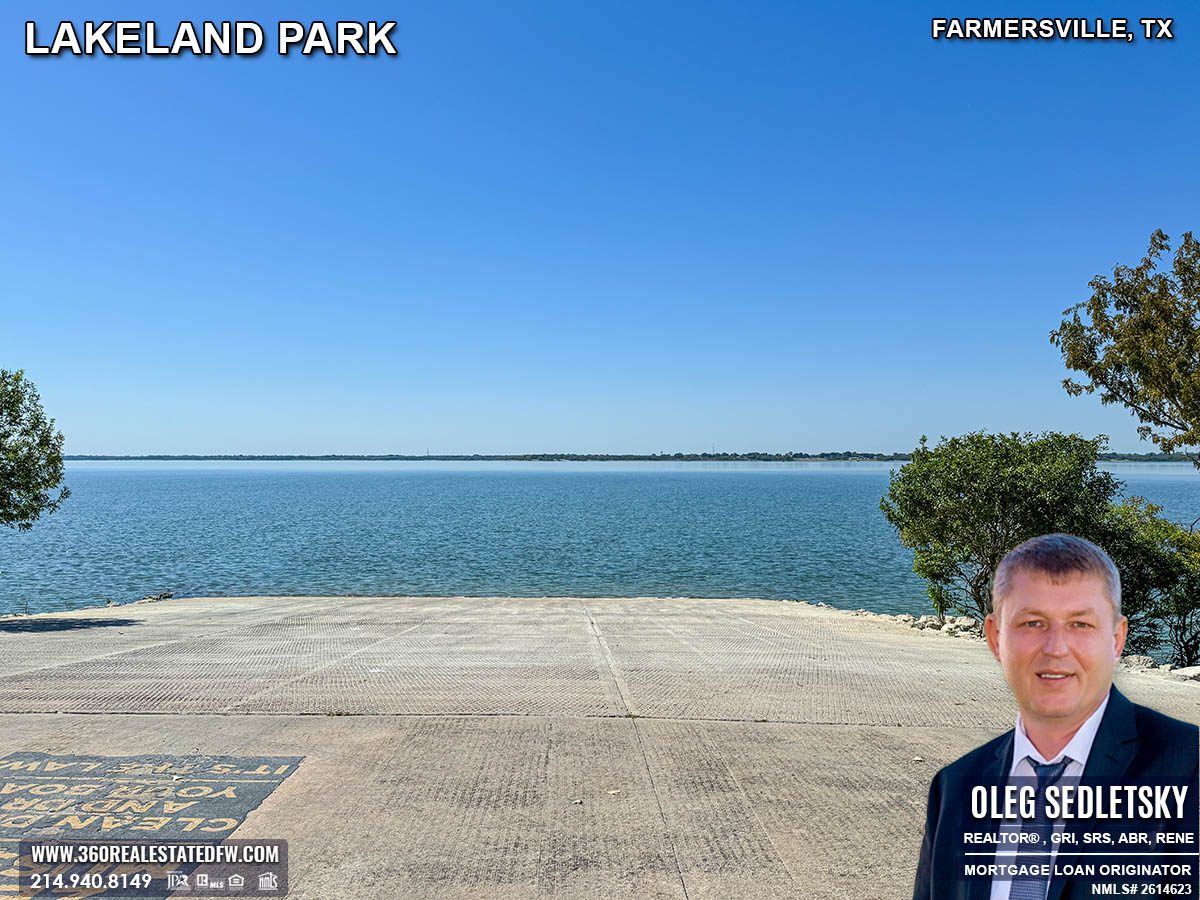
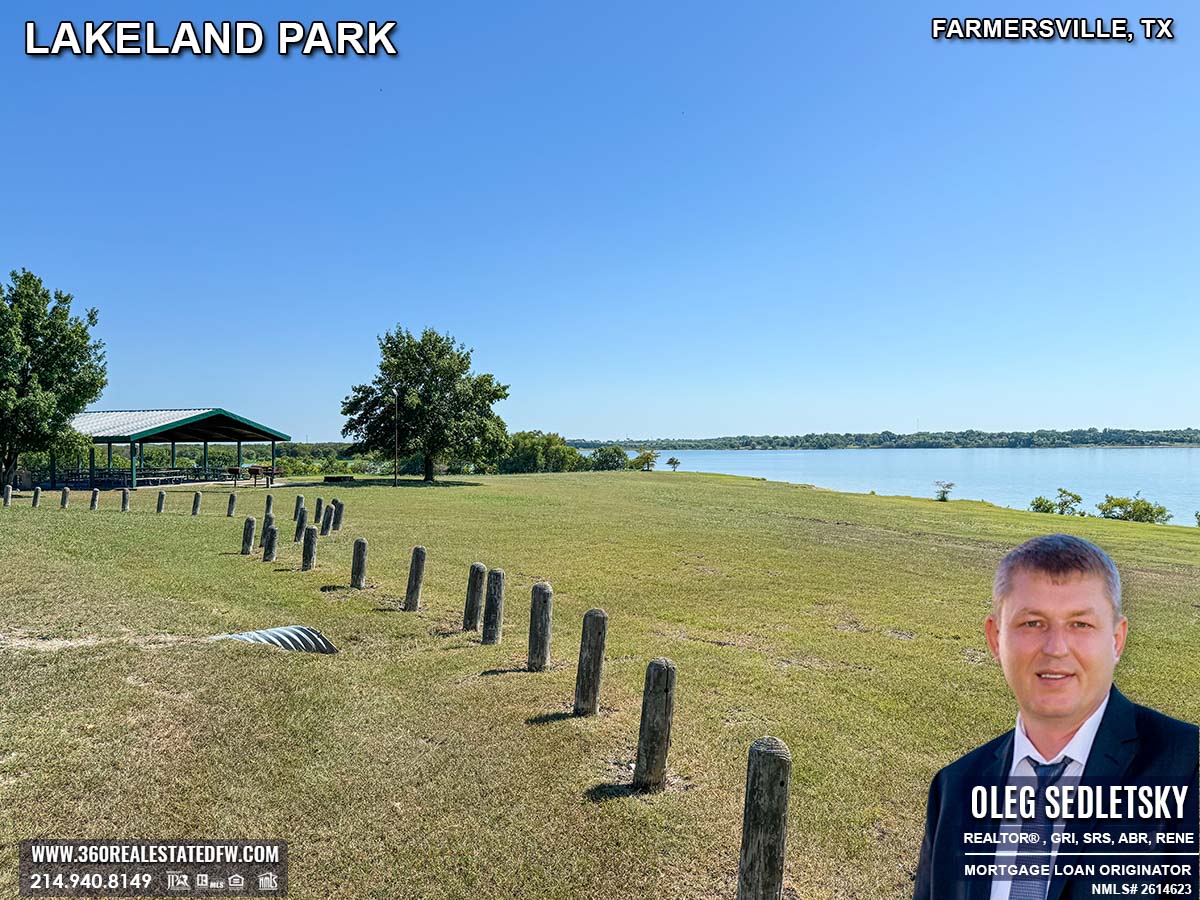
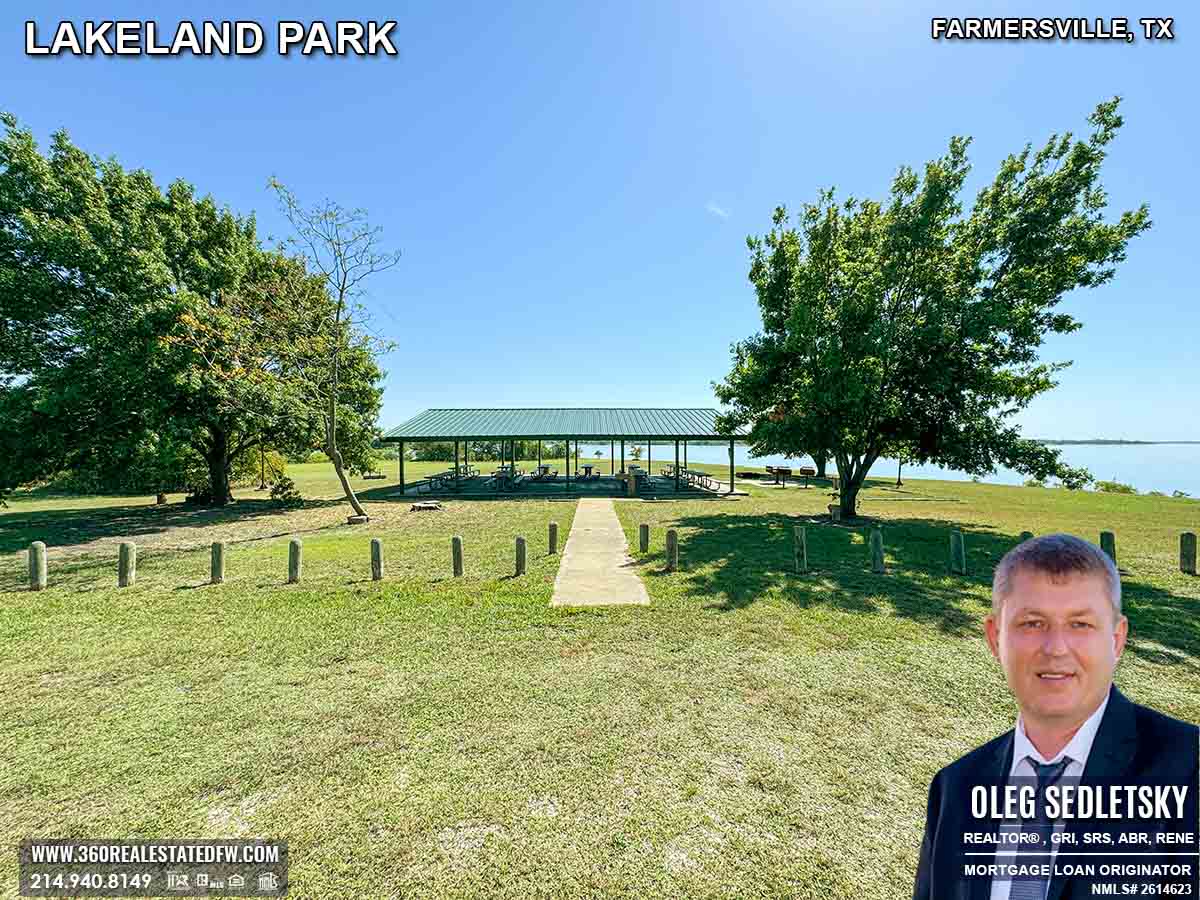
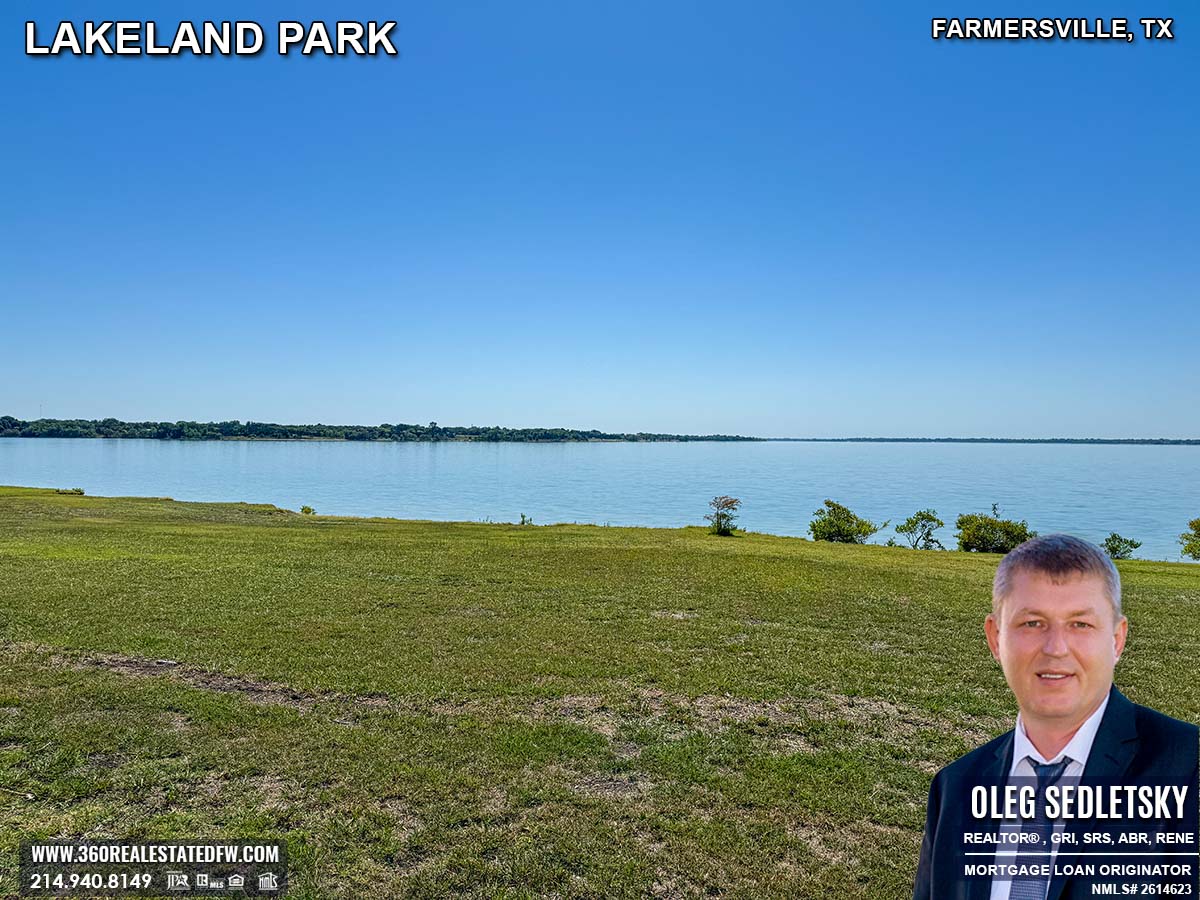
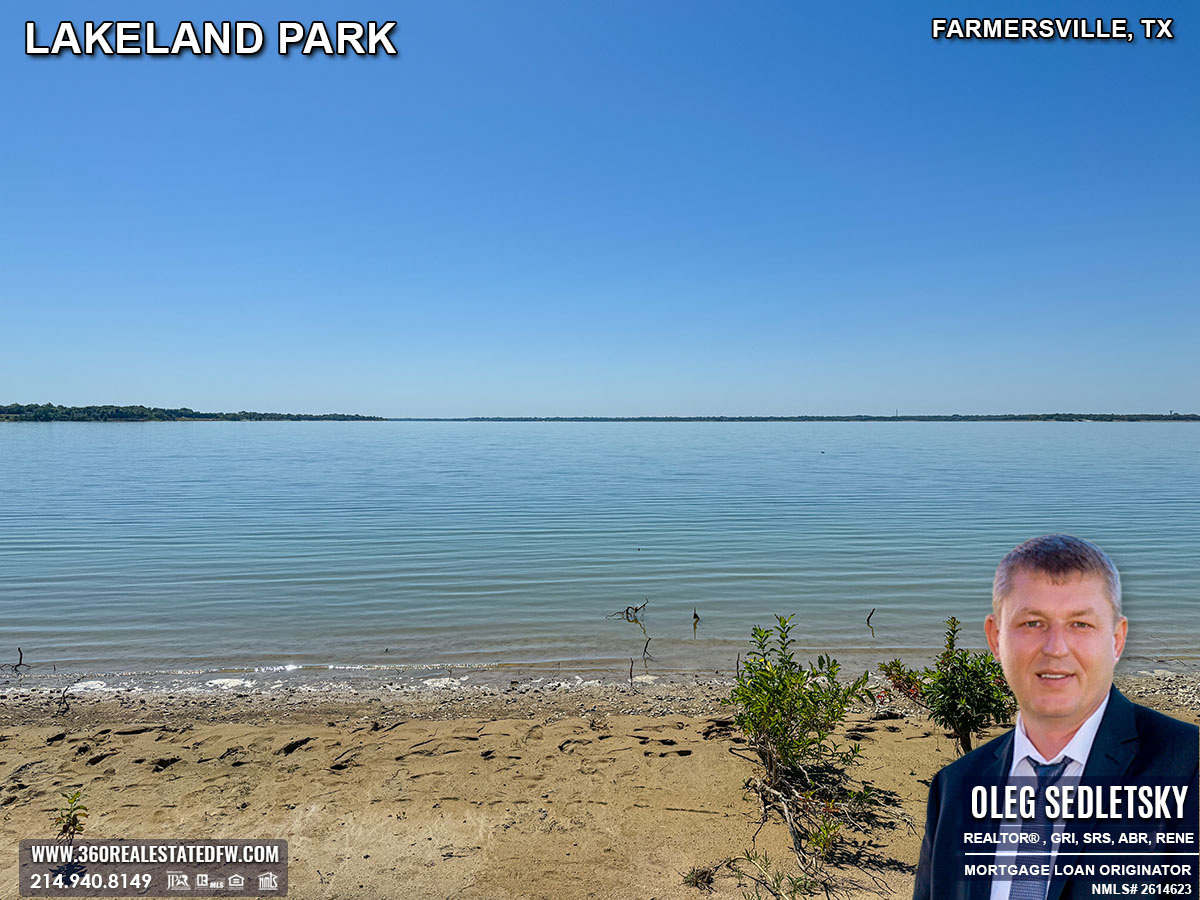
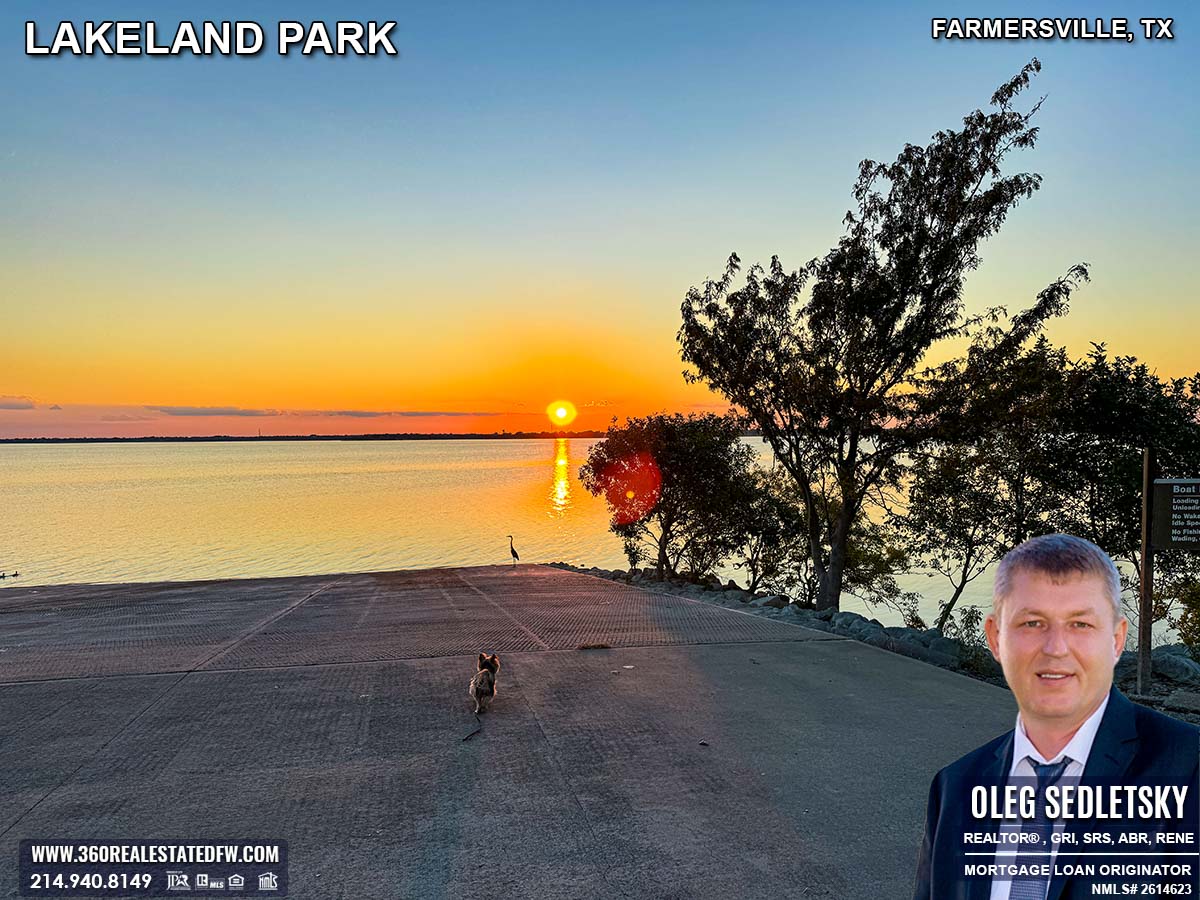
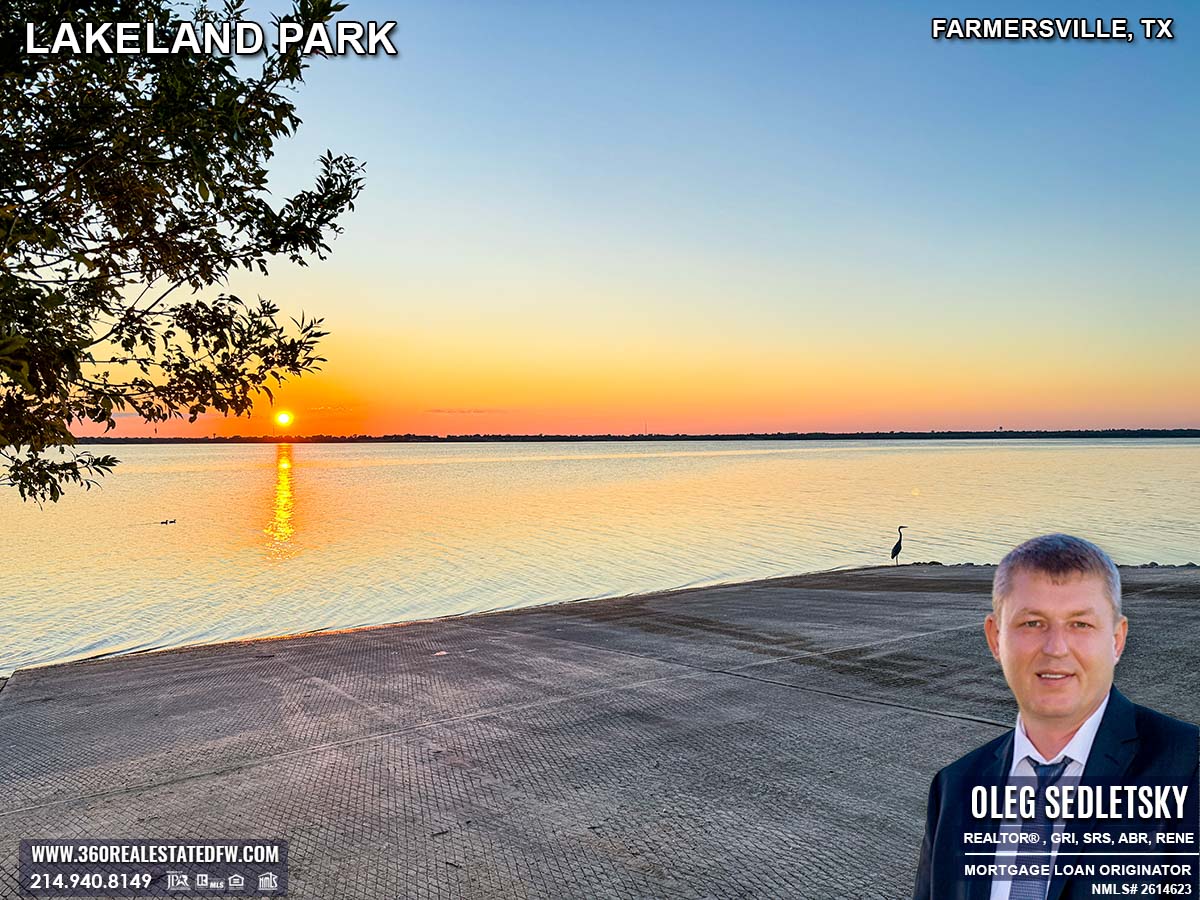
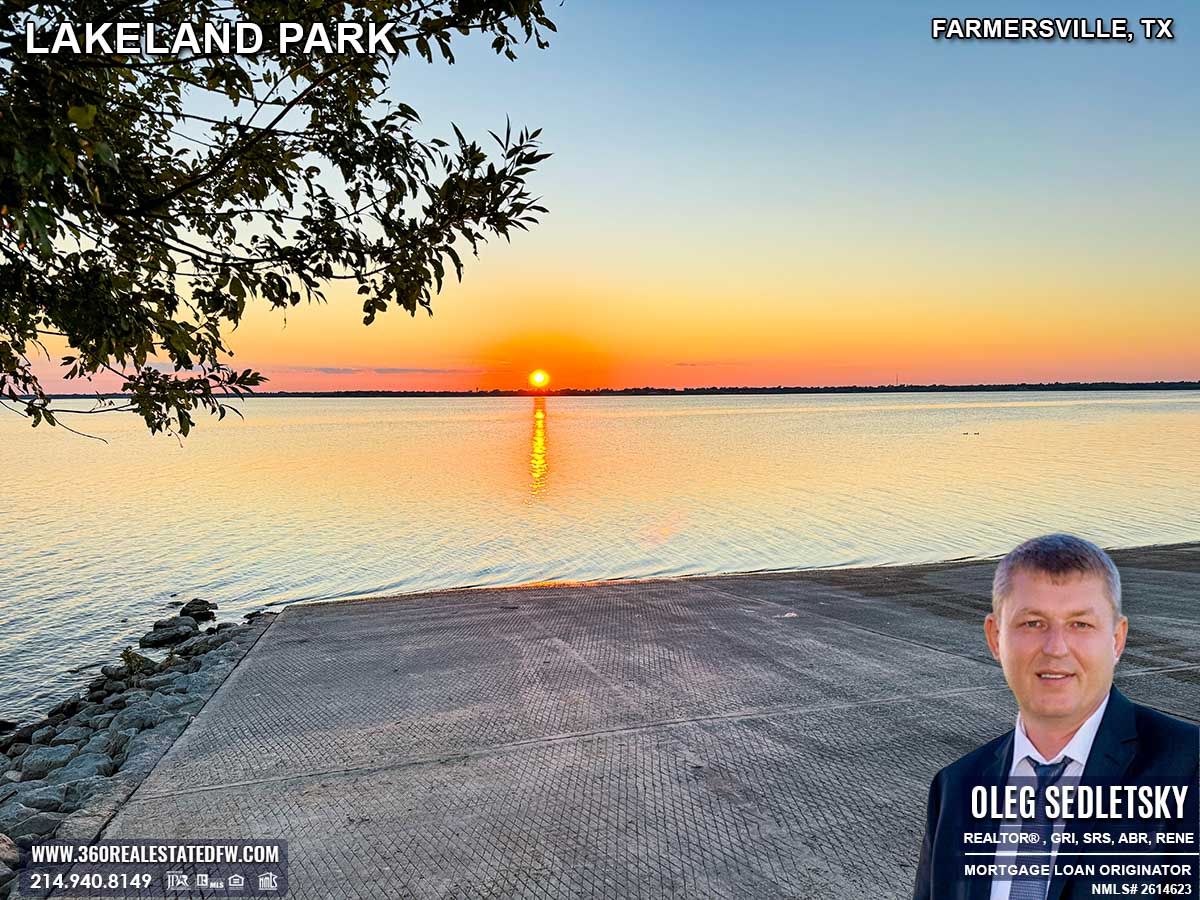
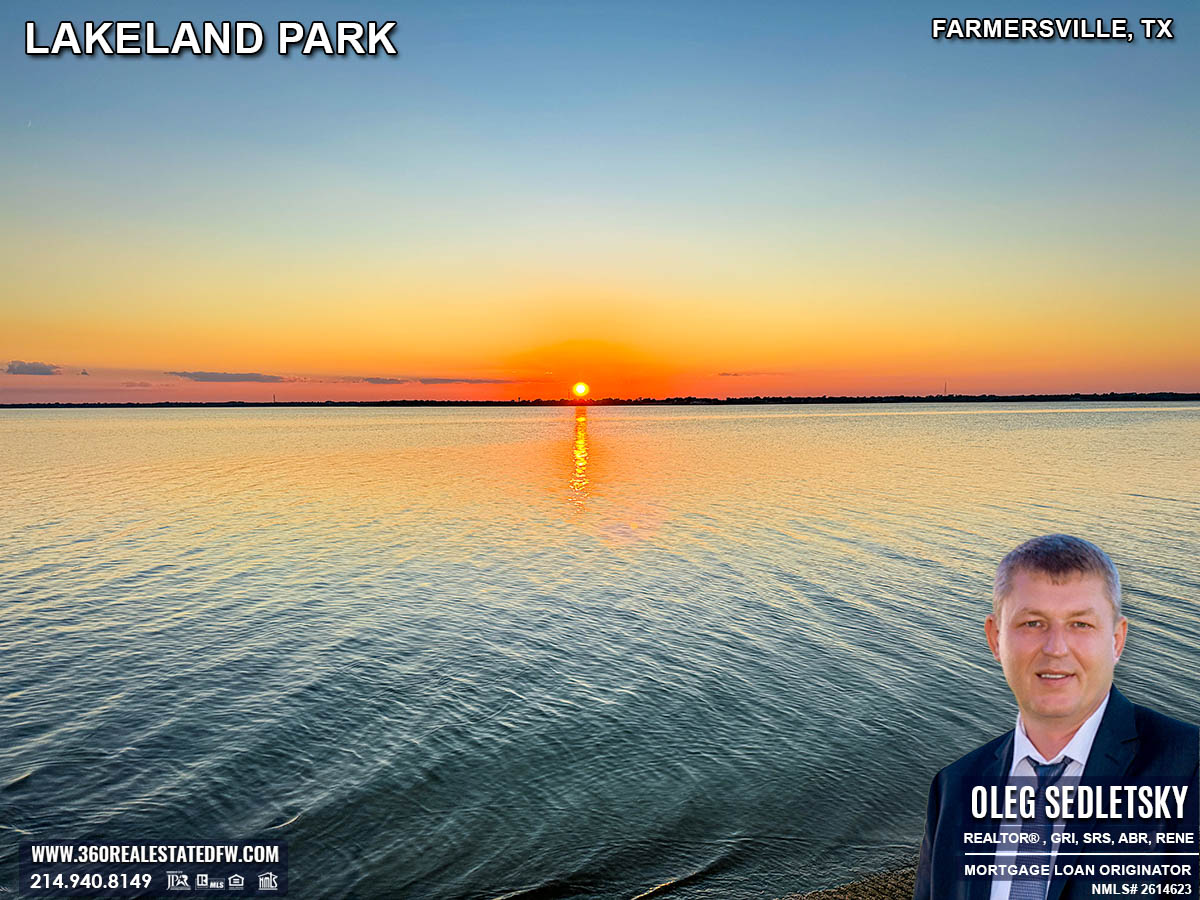
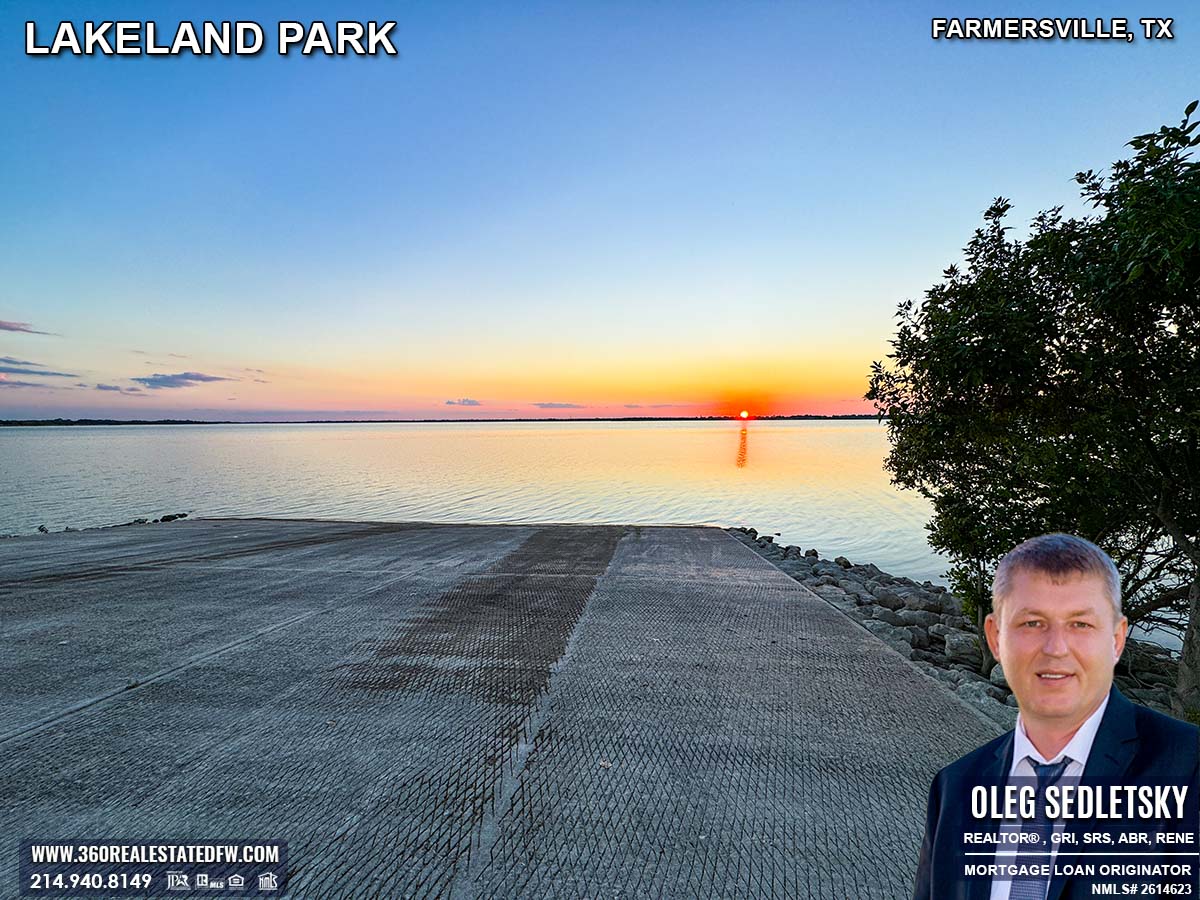
UNIQUE FEATURE ALERT! Stunning Sunsets on the Shoreline
Ask anyone who’s been here, and they’ll tell you the sunsets steal the show! Facing west, the shoreline provides a front-row seat to the sky’s evening masterpiece. Whether you’re settling in for a serene fishing session or snapping photos with your loved ones, the view paints a perfect end to the day. Don’t miss this golden hour magic when you visit!


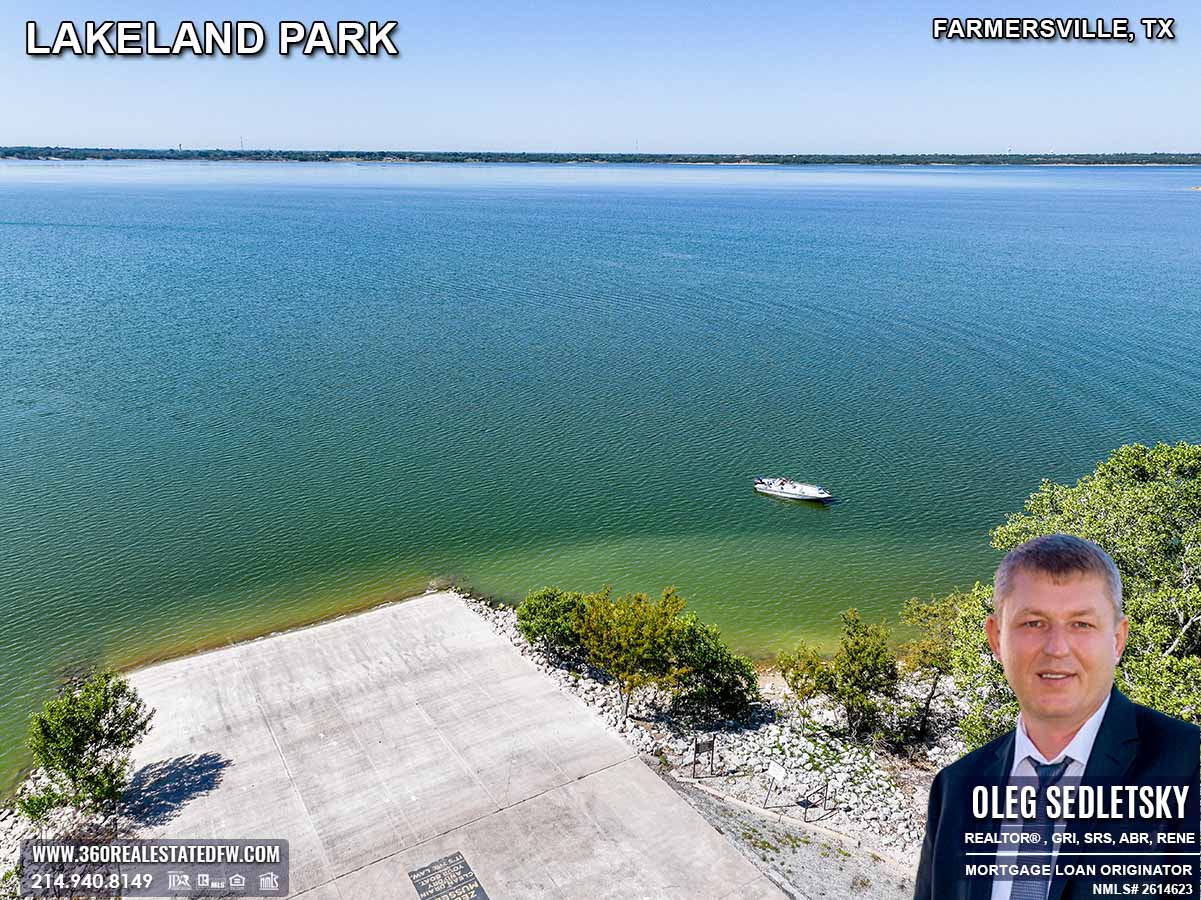
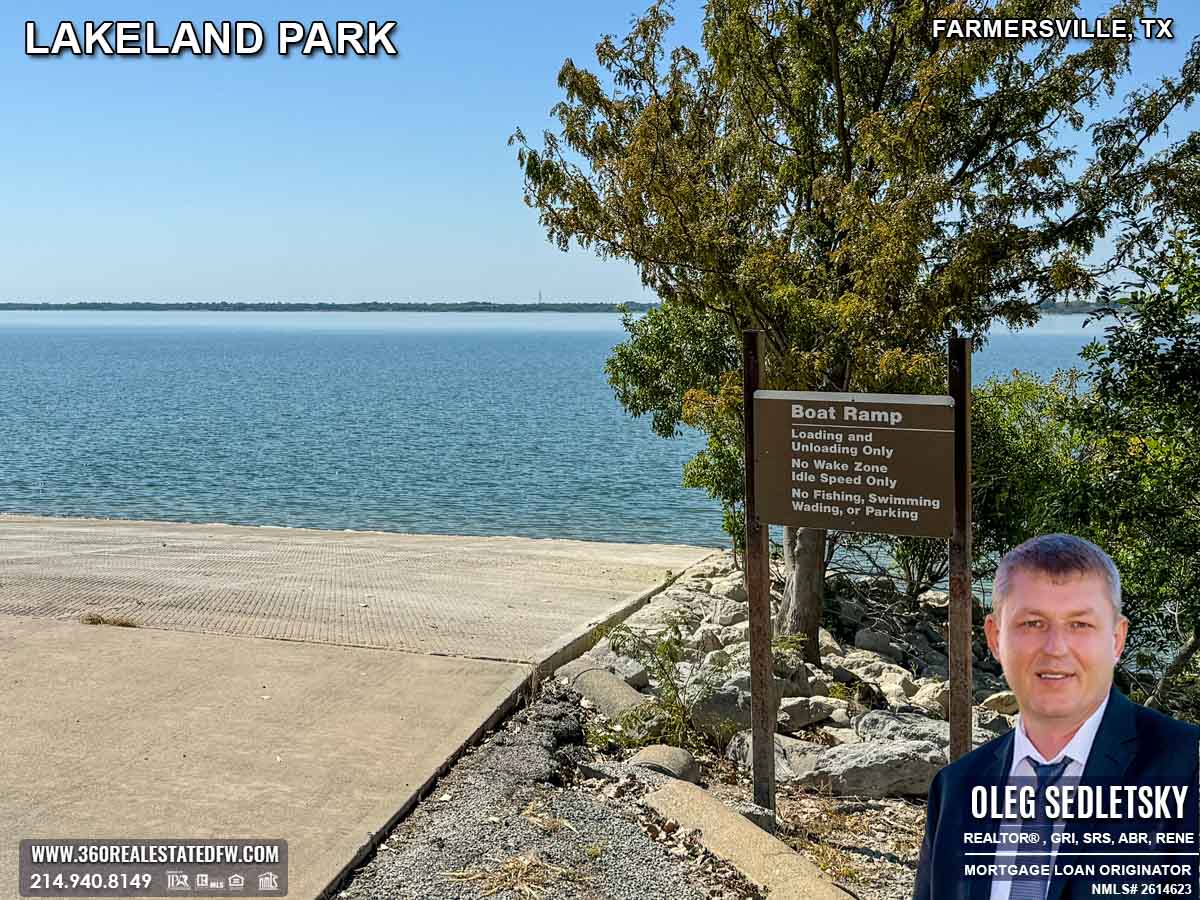
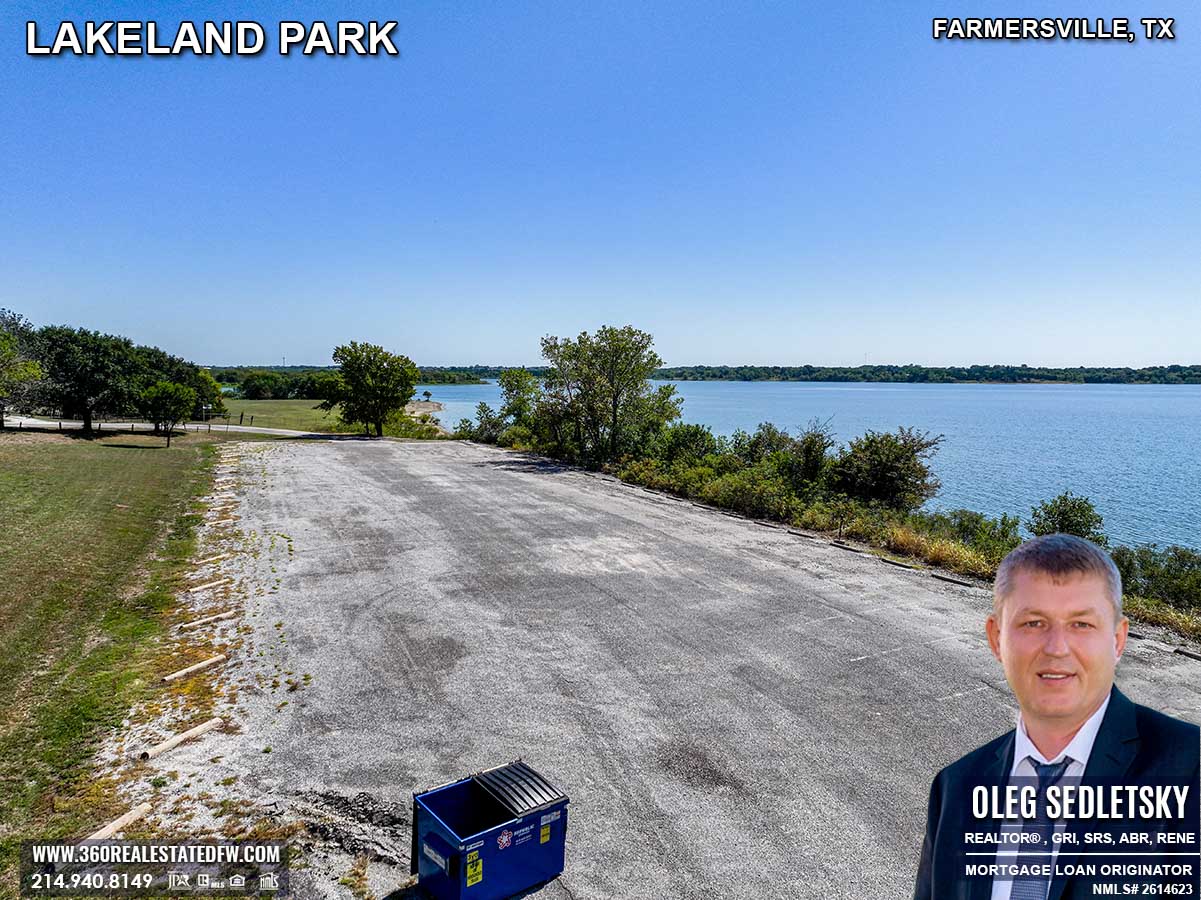
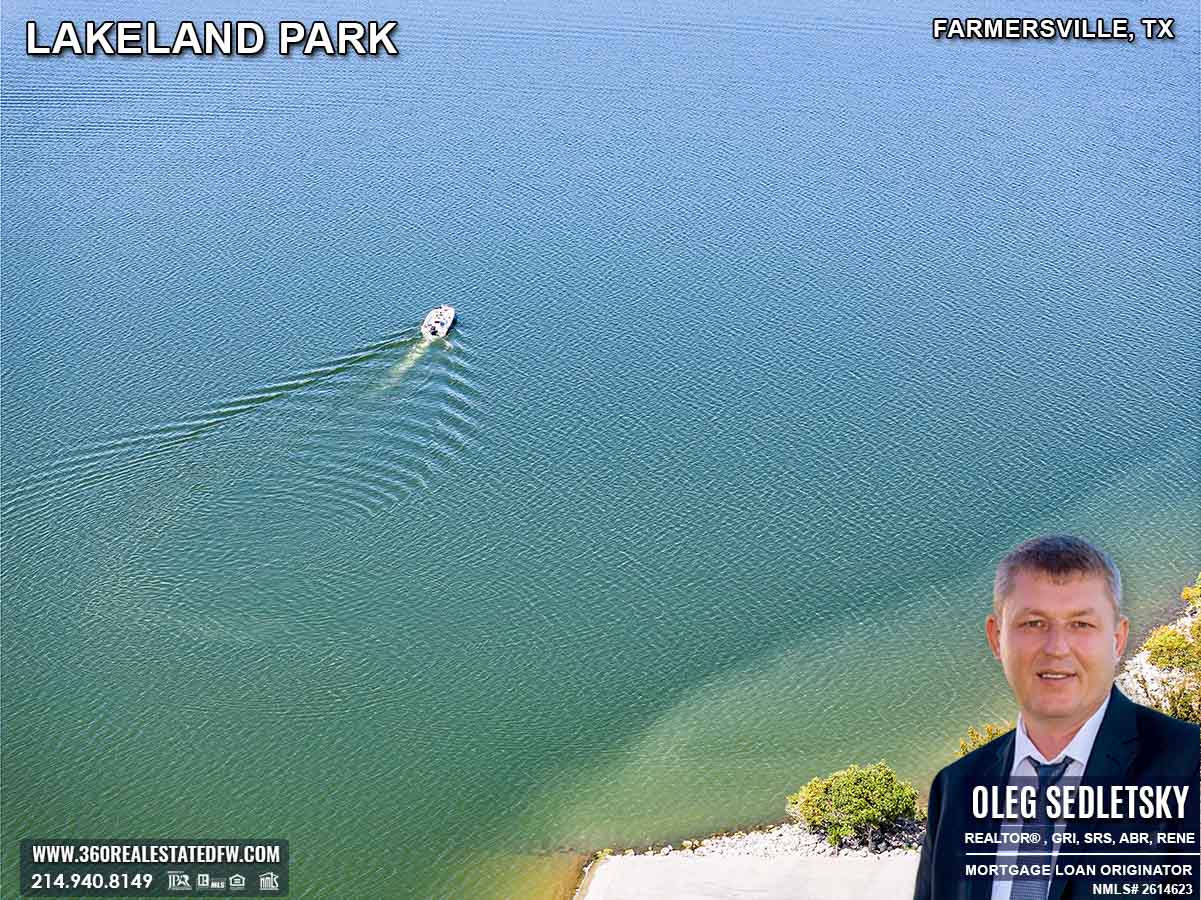
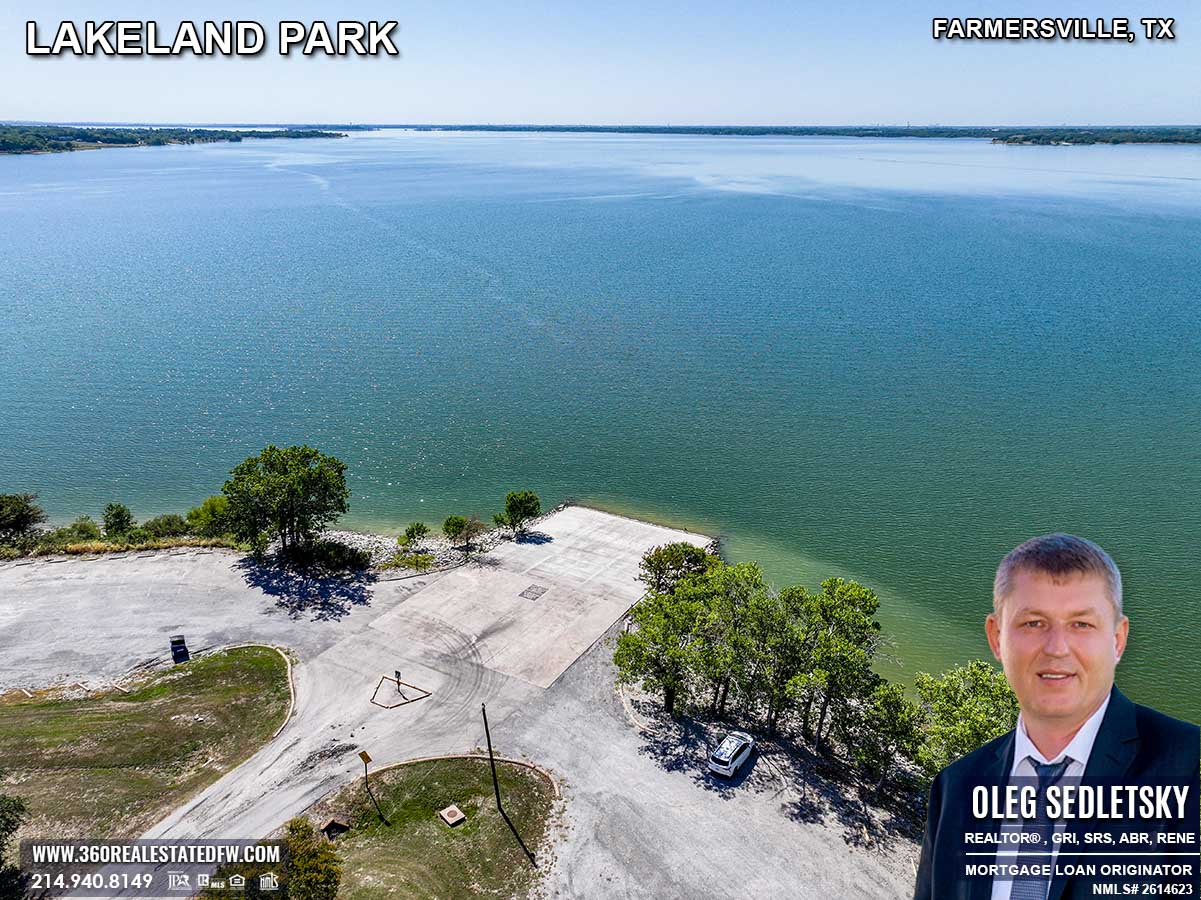
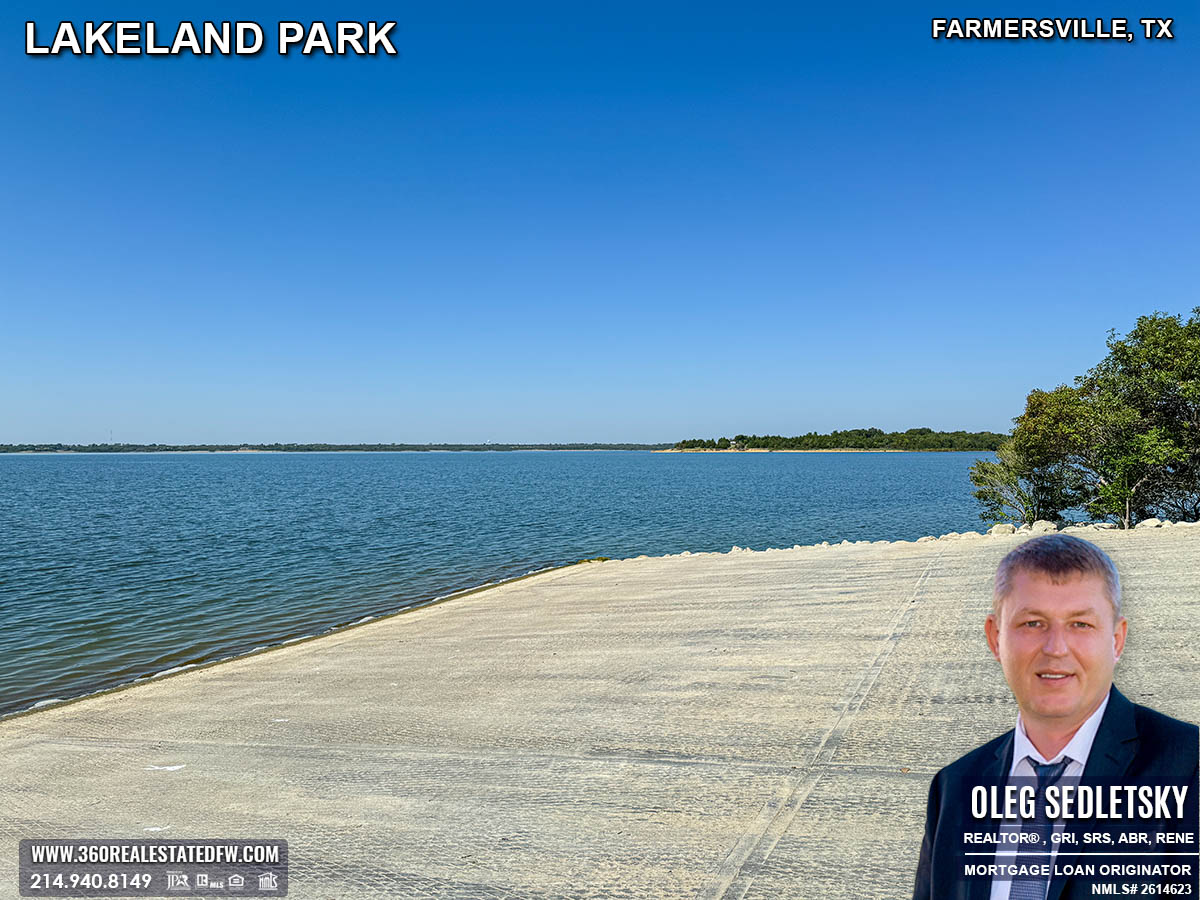
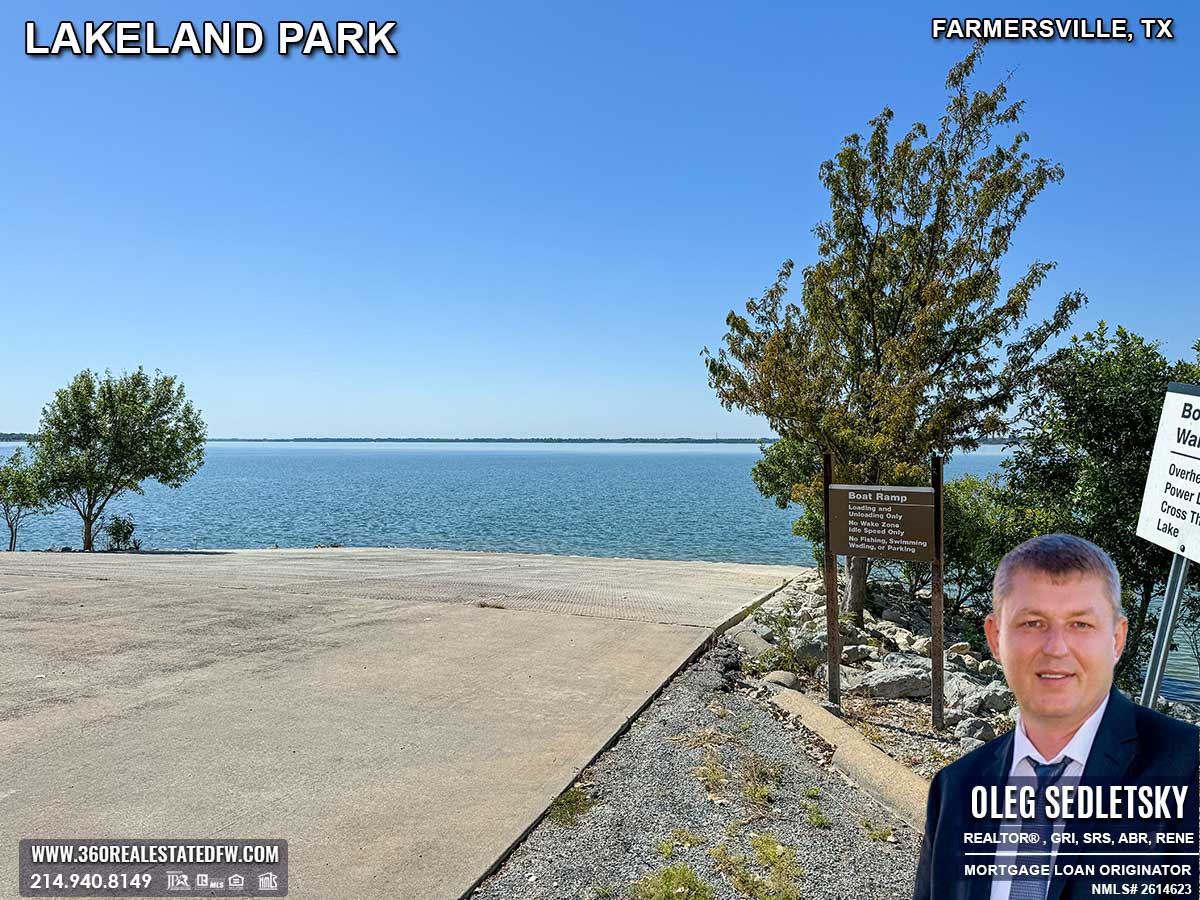
Free Boat Ramp Access
If you’re a boat owner, you’re in for a treat. The park’s 4-lane boat ramp is open year-round and, better yet, it’s completely free to use. Load up your boat and get ready to explore the lake’s sparkling waters. Whether you’re fishing, sightseeing, or relaxing on the lake, this ramp makes launching a breeze.
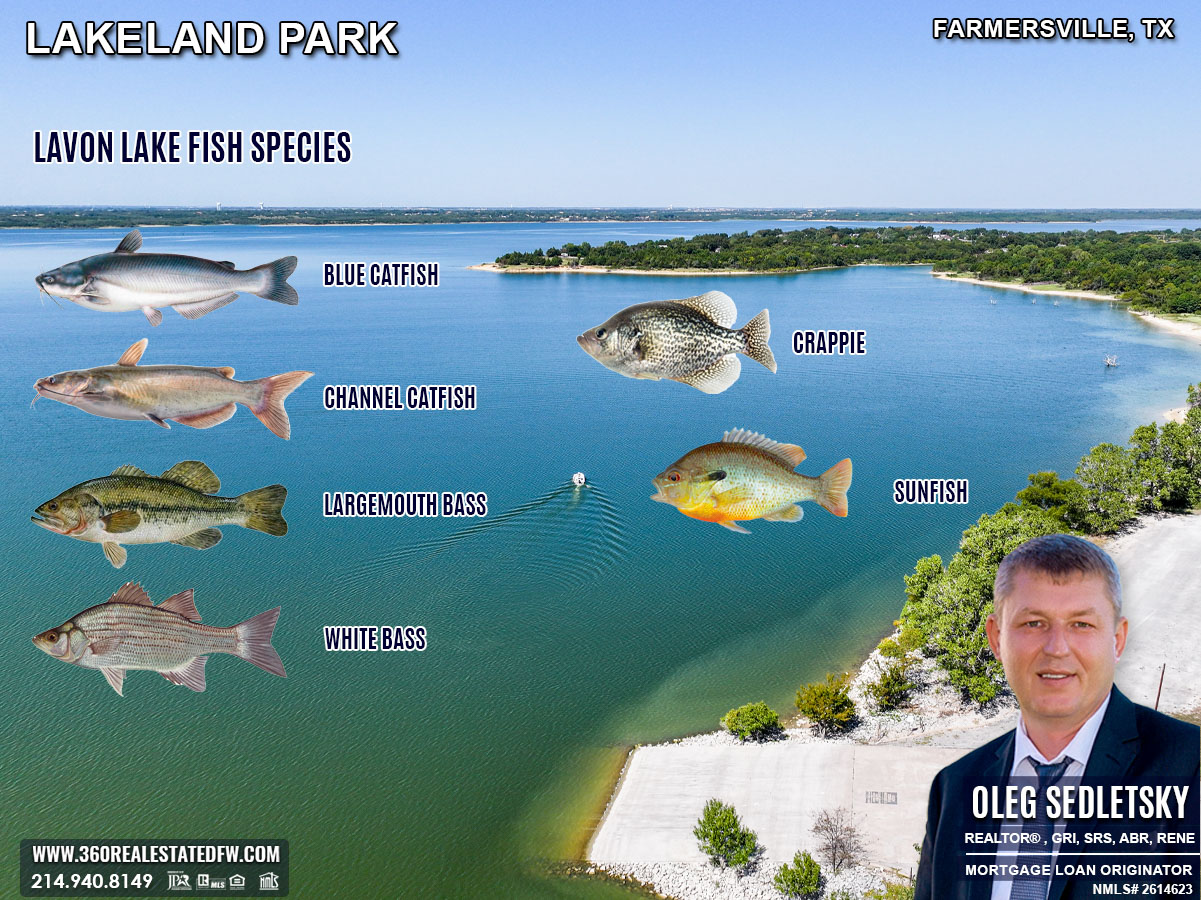
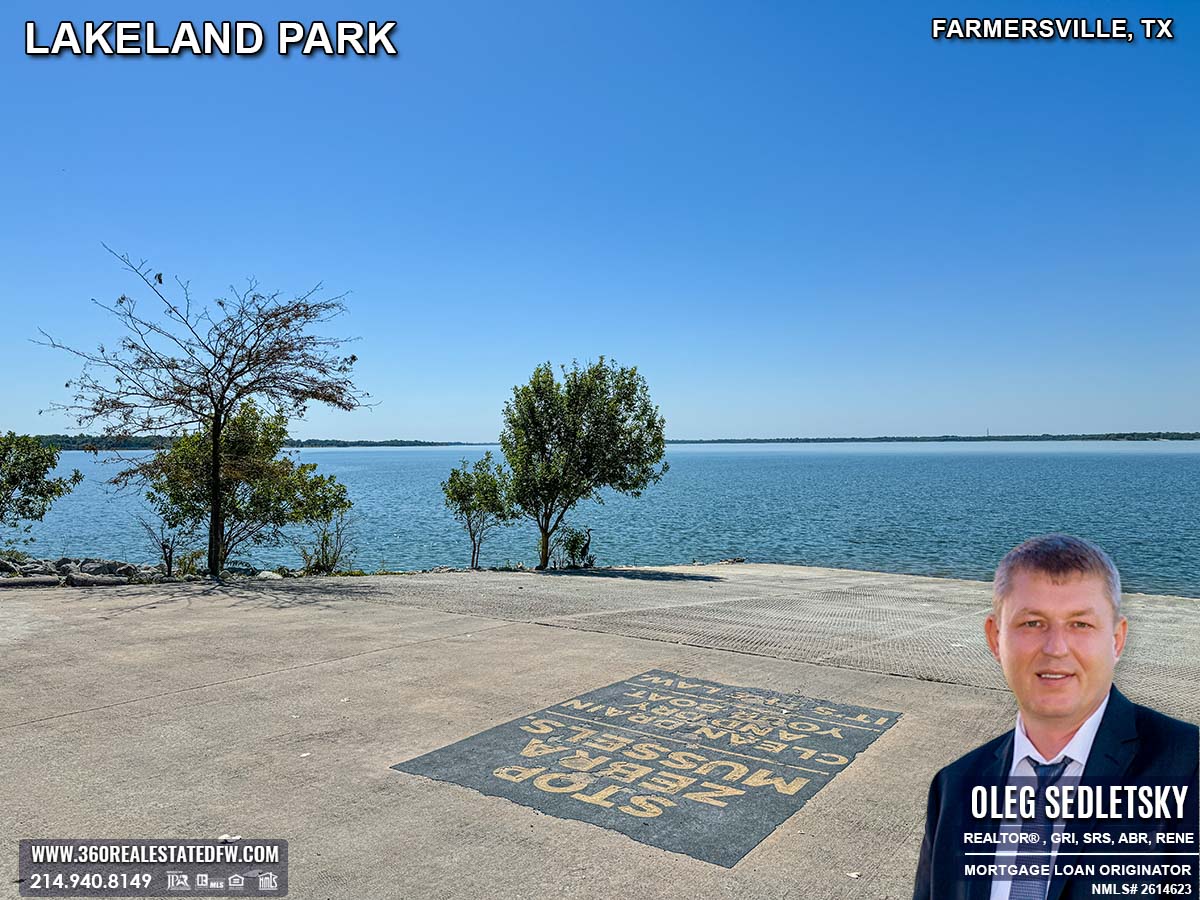
Fishing Haven: What types of fish can you find in Lavon Lake?
Bring along your fishing gear because the lake is teeming with fish! You’ll find Largemouth Bass, Blue Catfish, Channel Catfish, Crappie, White Bass, and Sunfish swimming these waters. Whether you’re a seasoned angler or a first-timer hoping for a lucky catch, there’s plenty of action to keep you entertained.
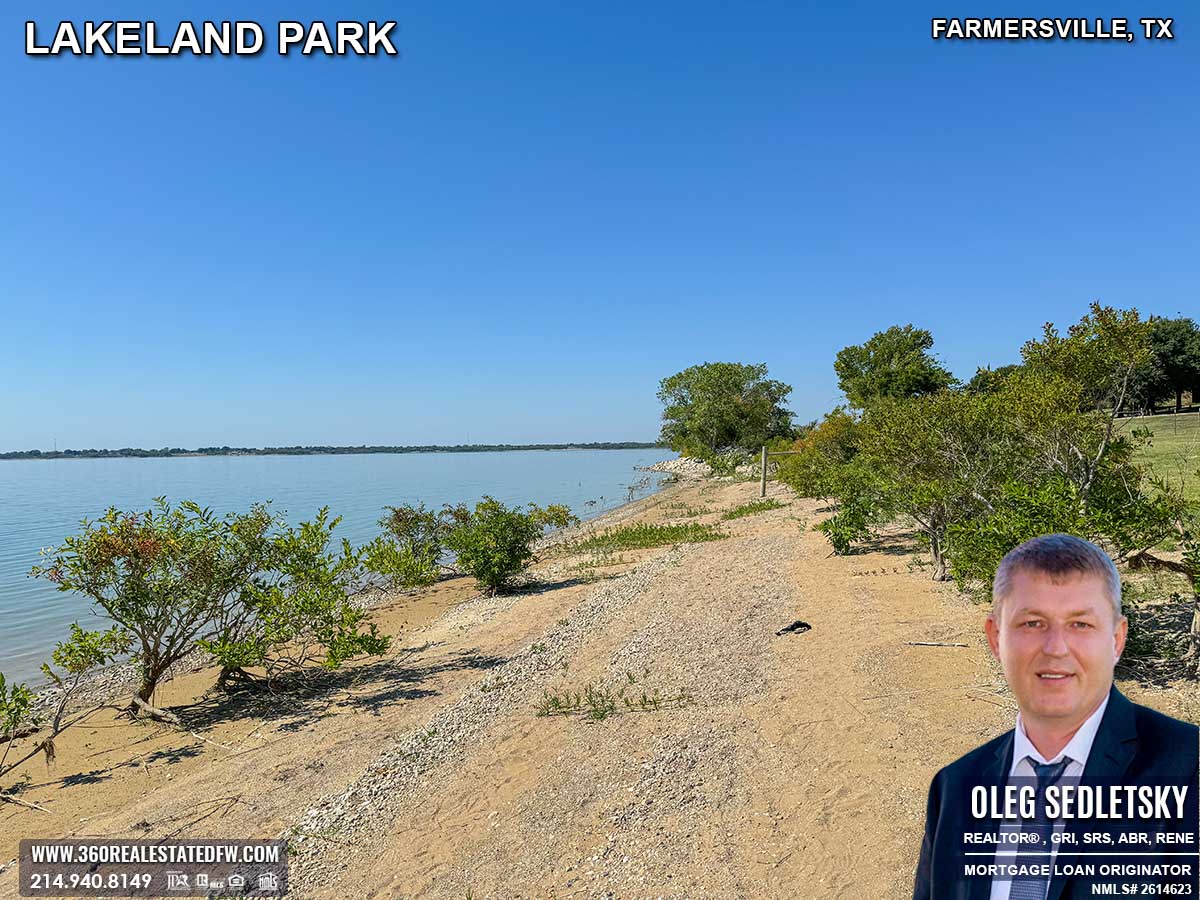
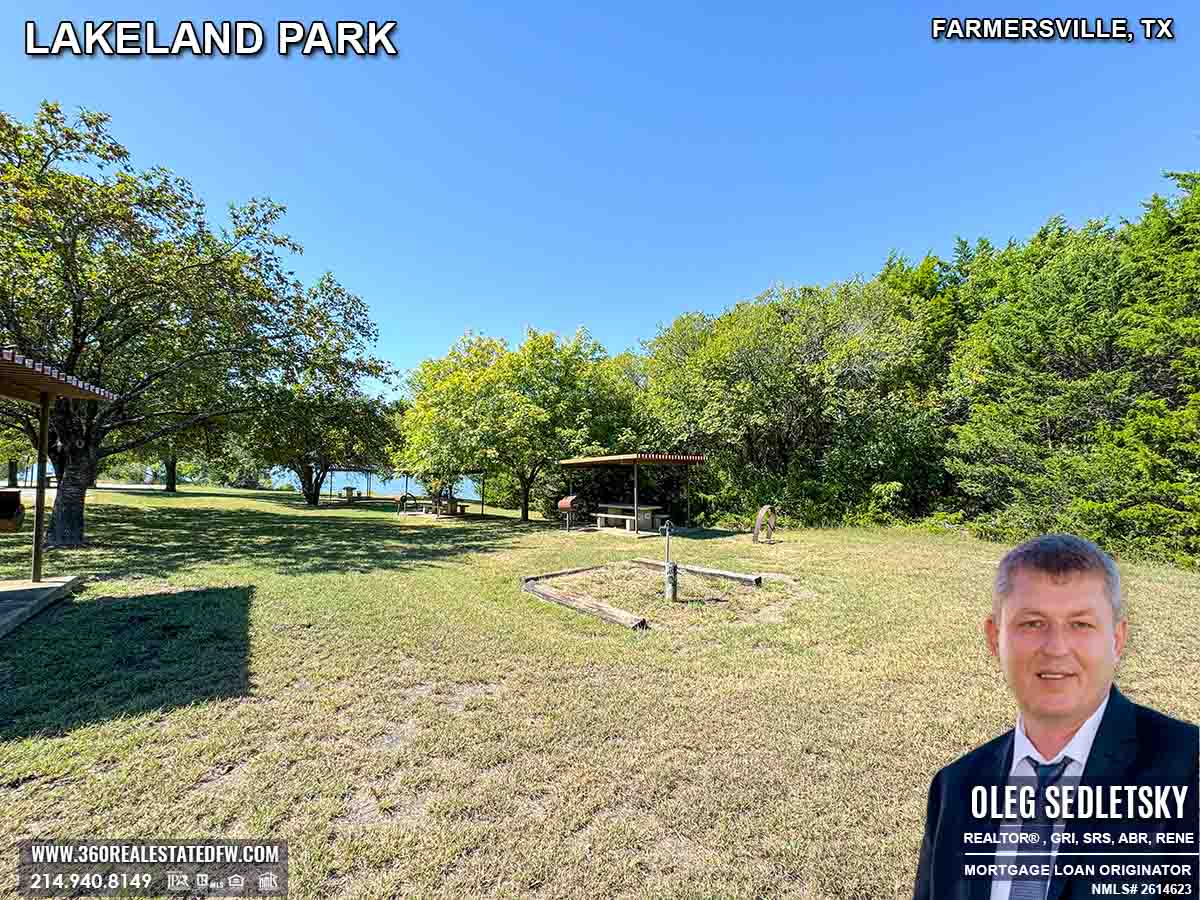
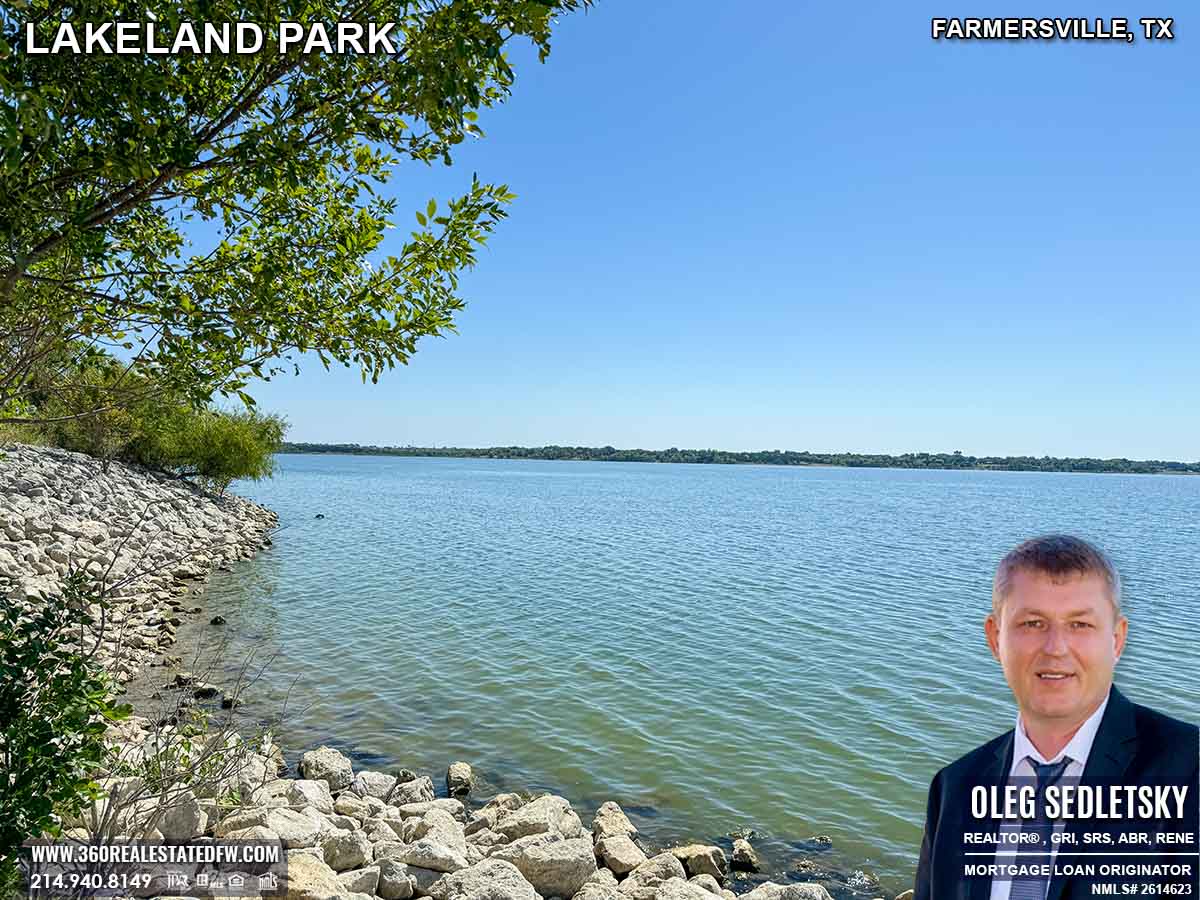
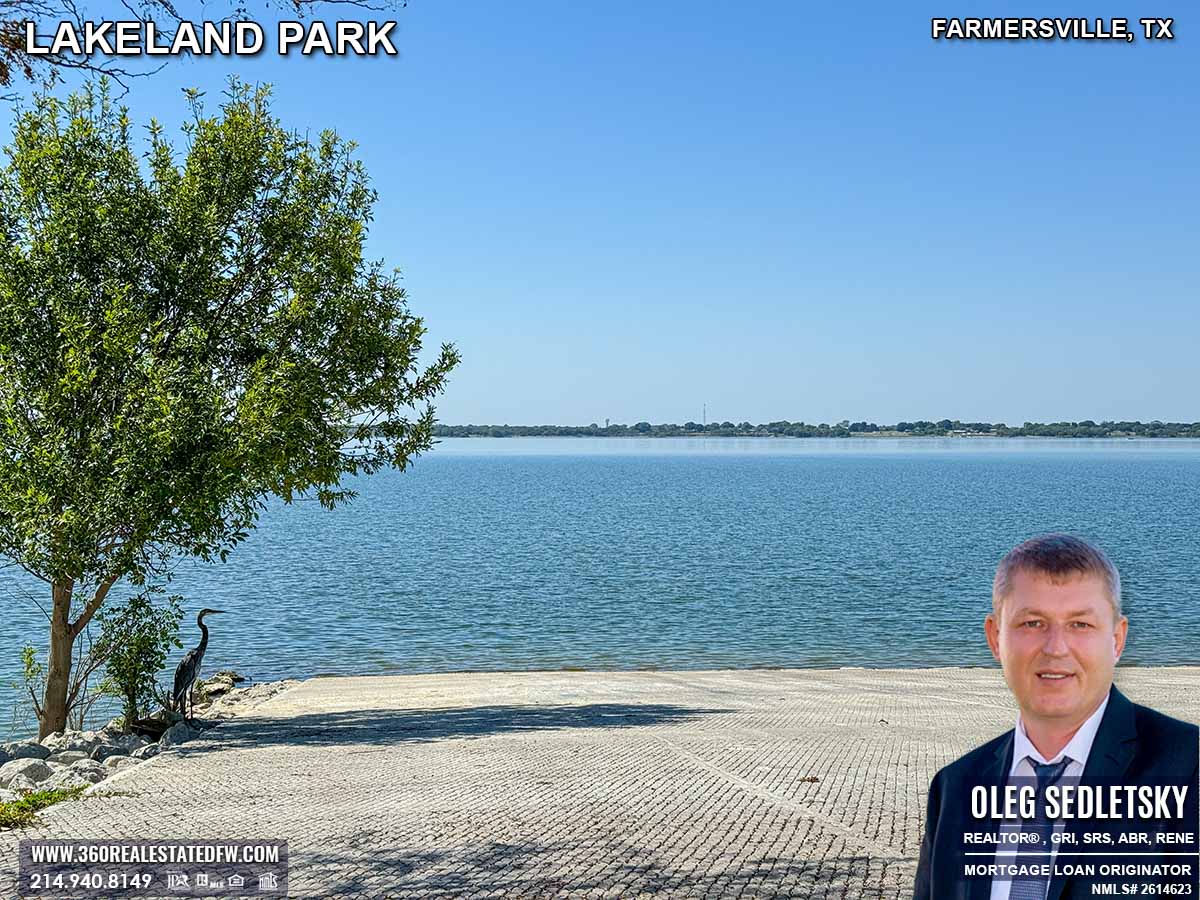
Is There a Beach in Lakeland Park? No Beaches, but a Stunning Shoreline
While the park doesn’t have an official beach, its natural shoreline adds to the charm. Depending on the season and the lake’s water levels, you’ll find plenty of areas to sit back and enjoy the lake’s peaceful ambiance. Bring a chair, dip your toes in the water, and soak in the tranquility.

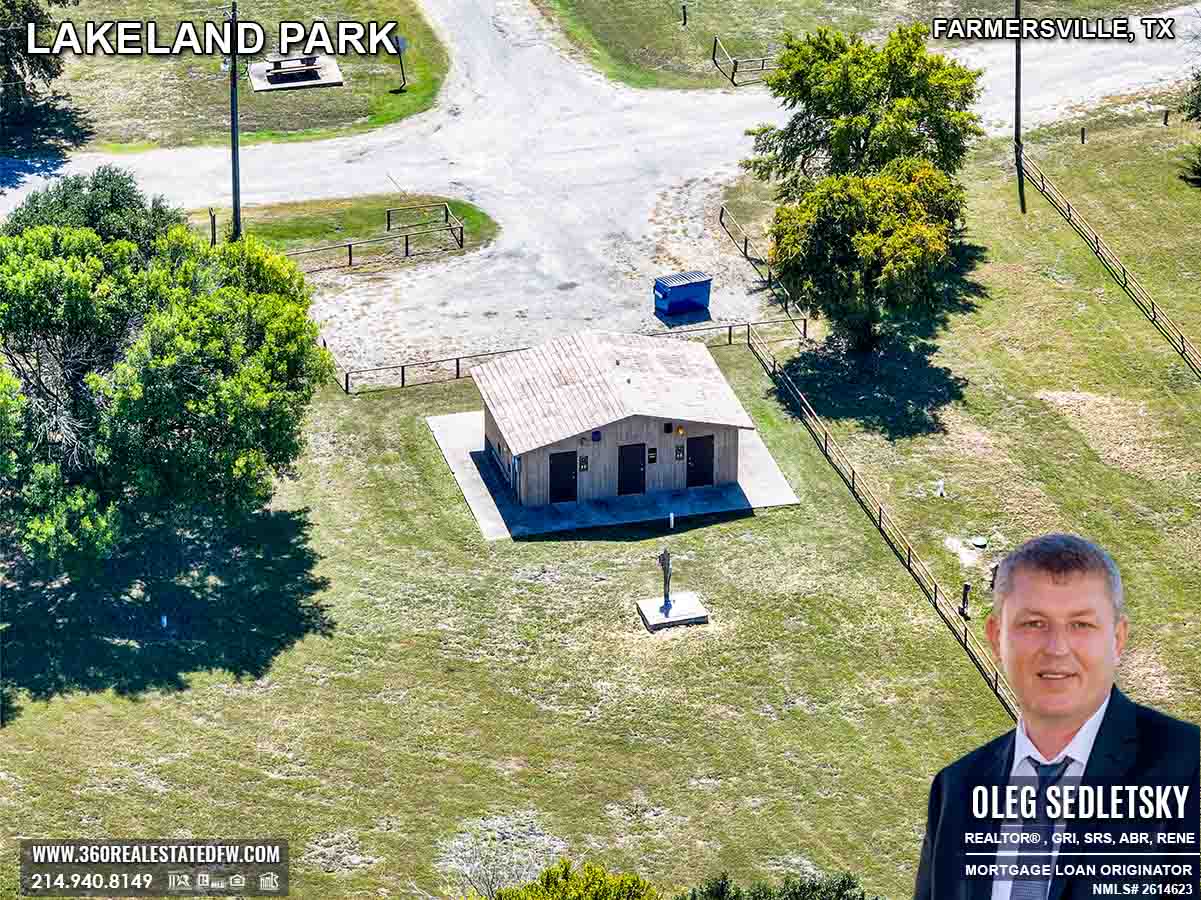
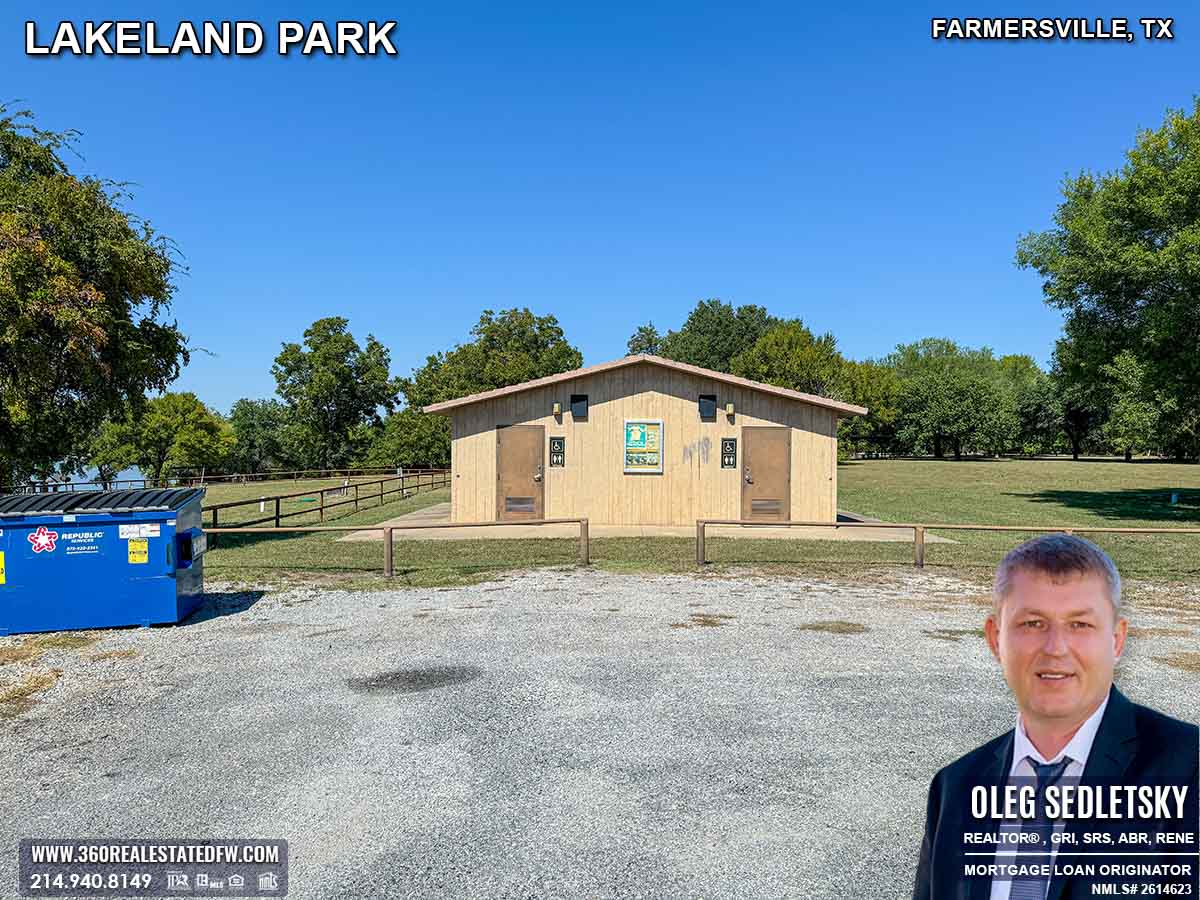
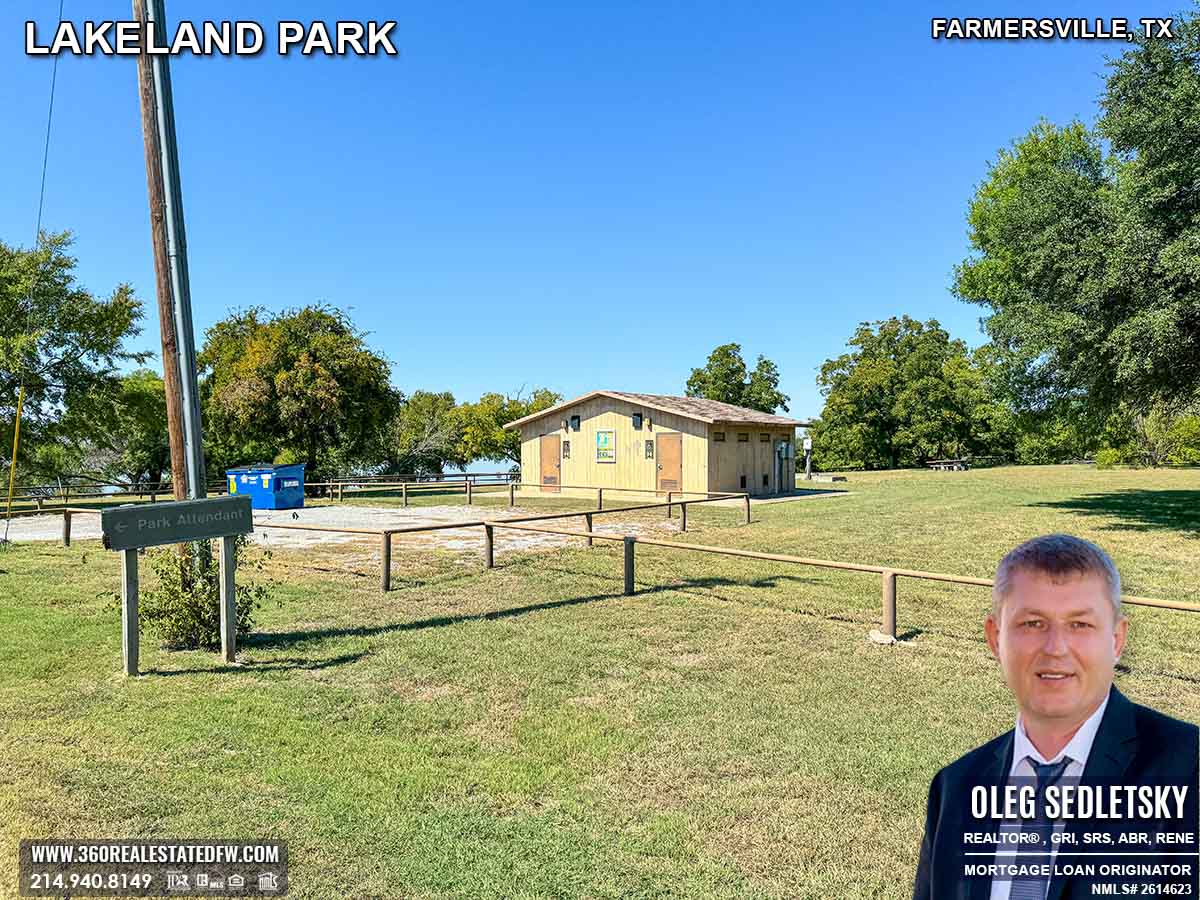
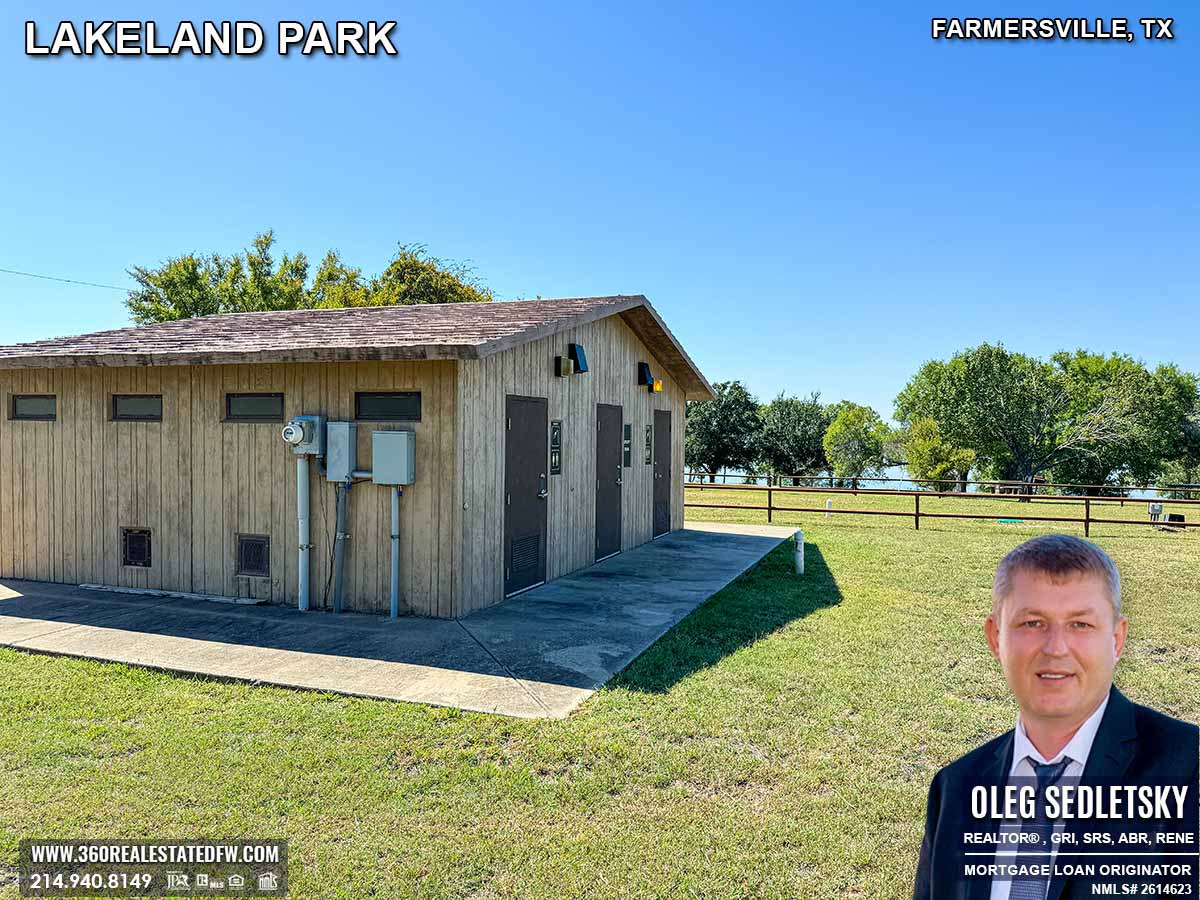
Are there Restrooms in Lakeland Park? Absolutely!
You won’t have to worry about facilities here. The park has two restrooms for your convenience, ensuring that your visit is as comfortable as it is fun.
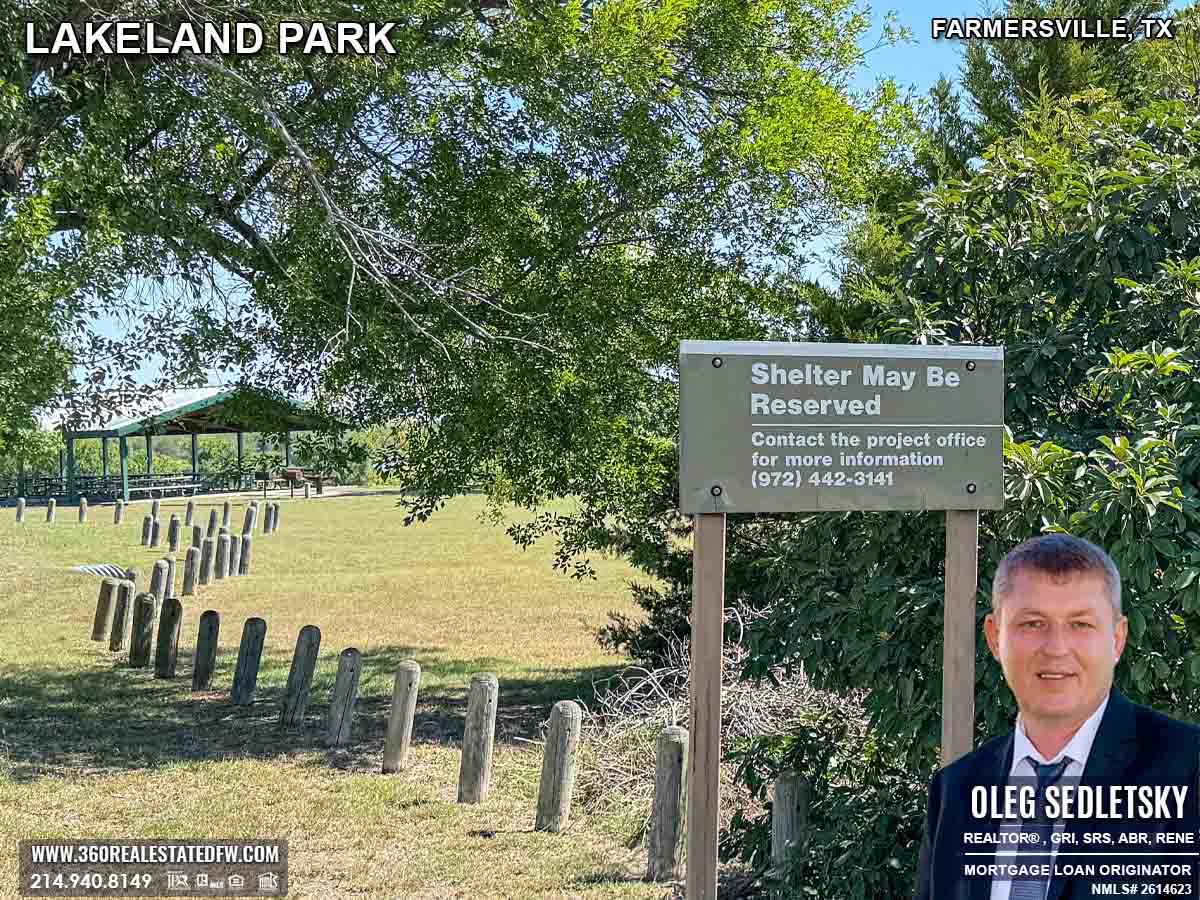
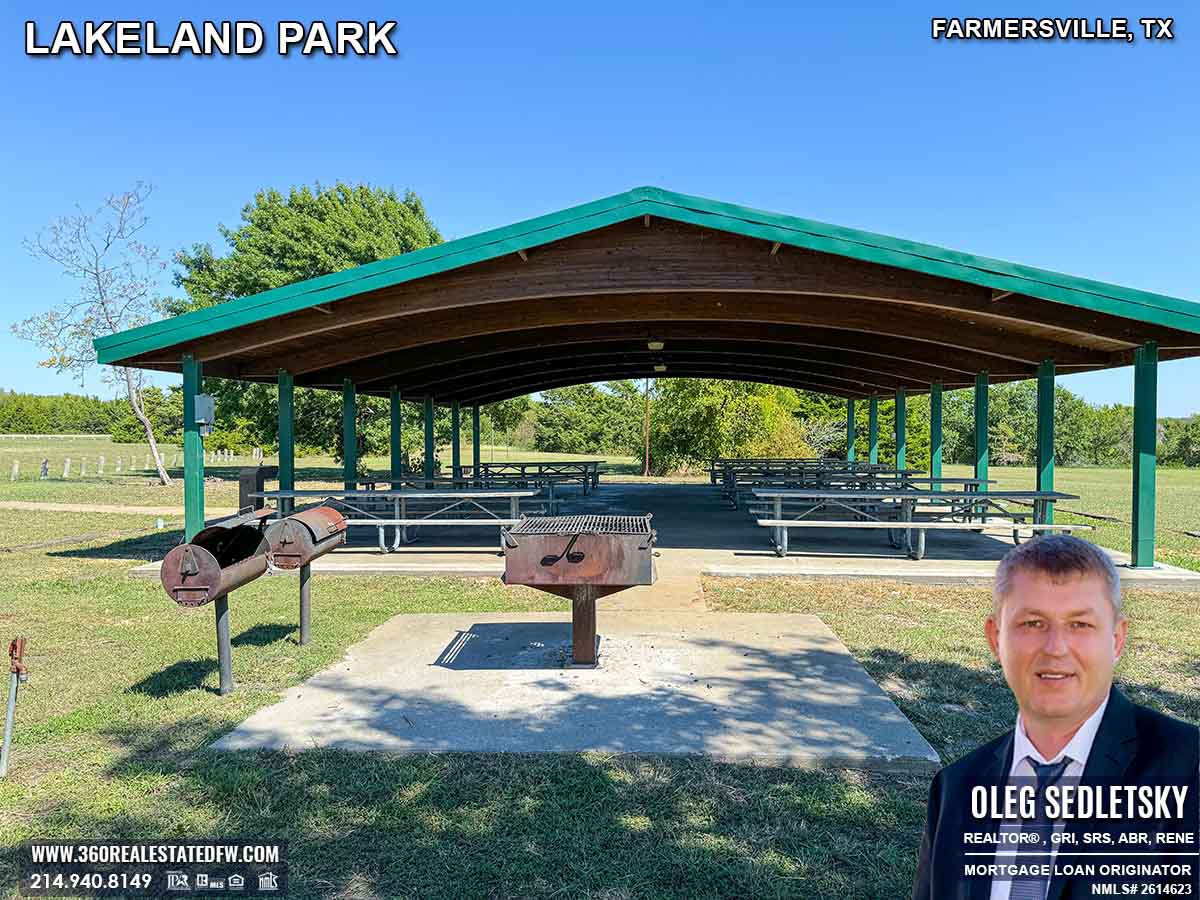
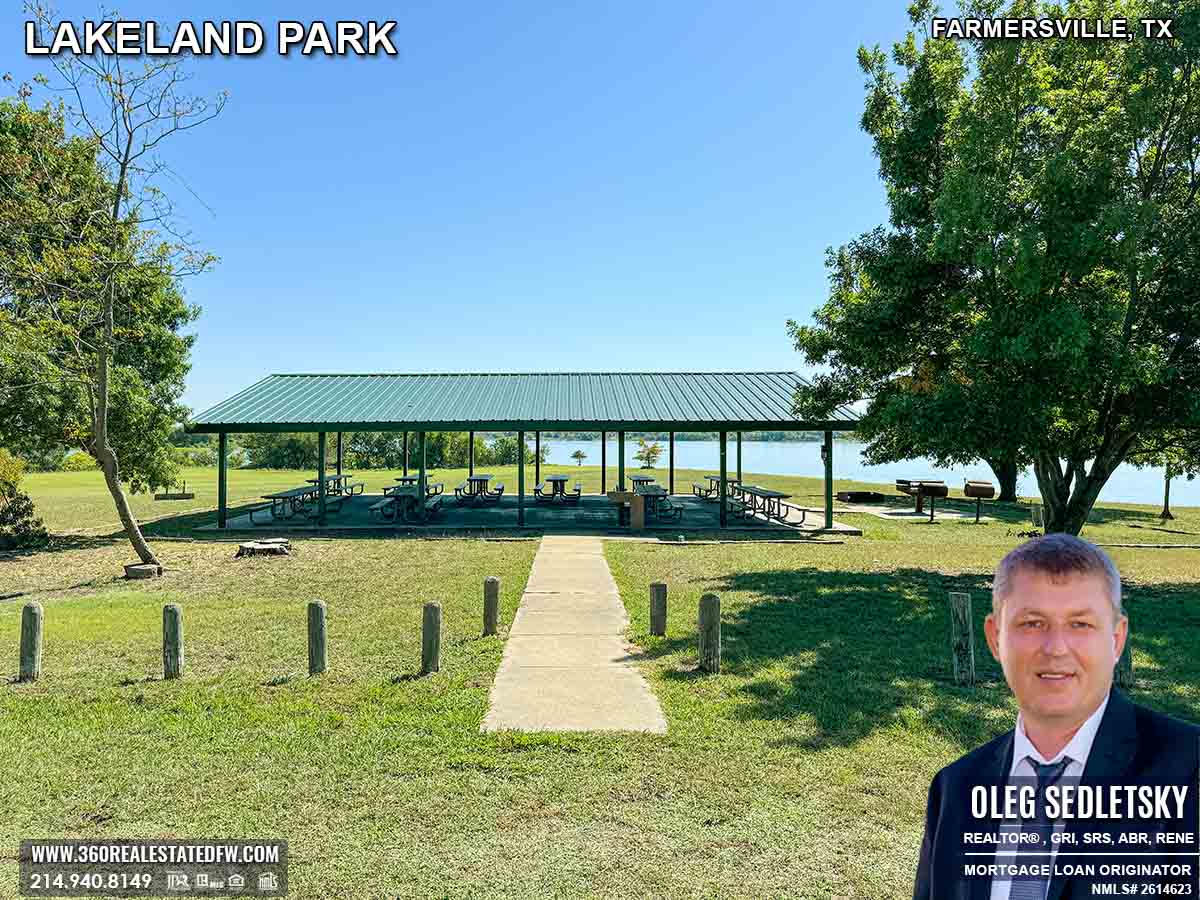
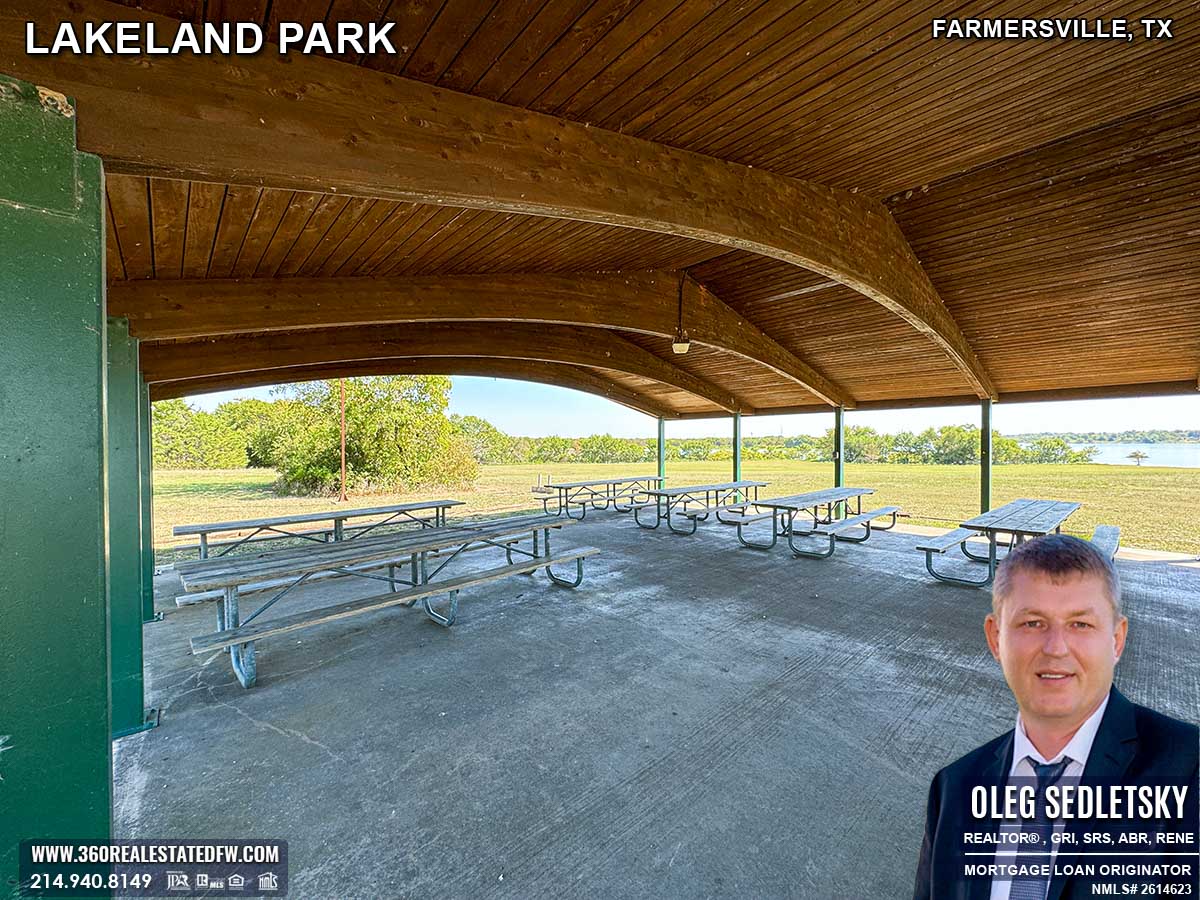
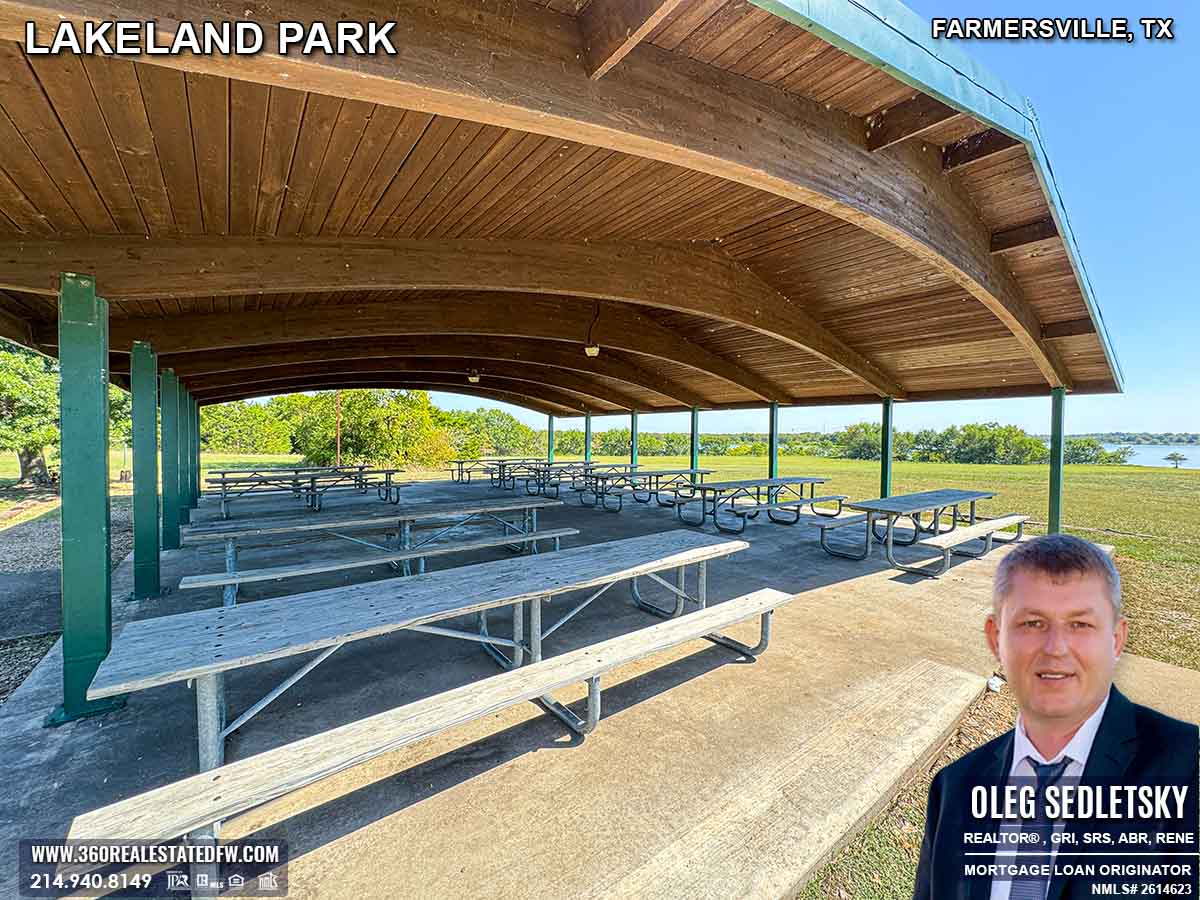
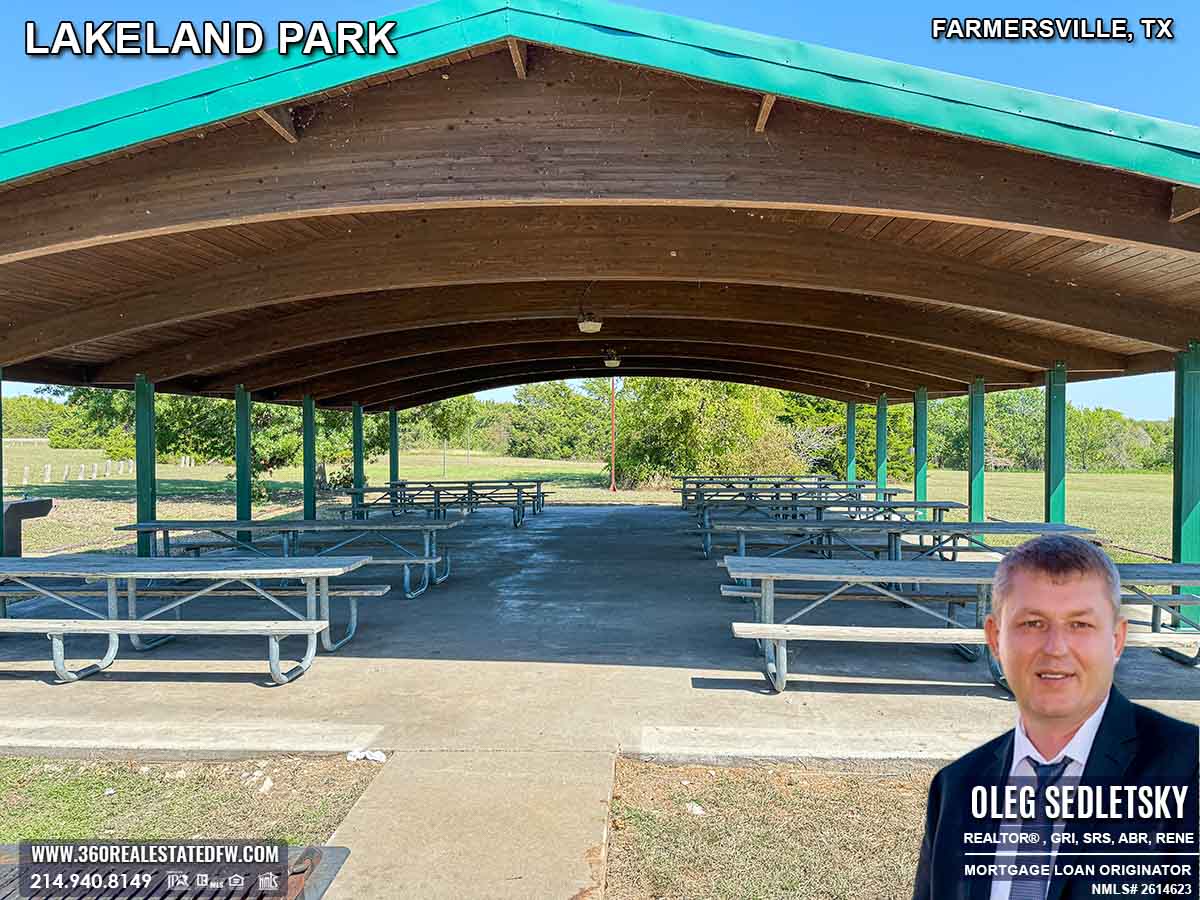
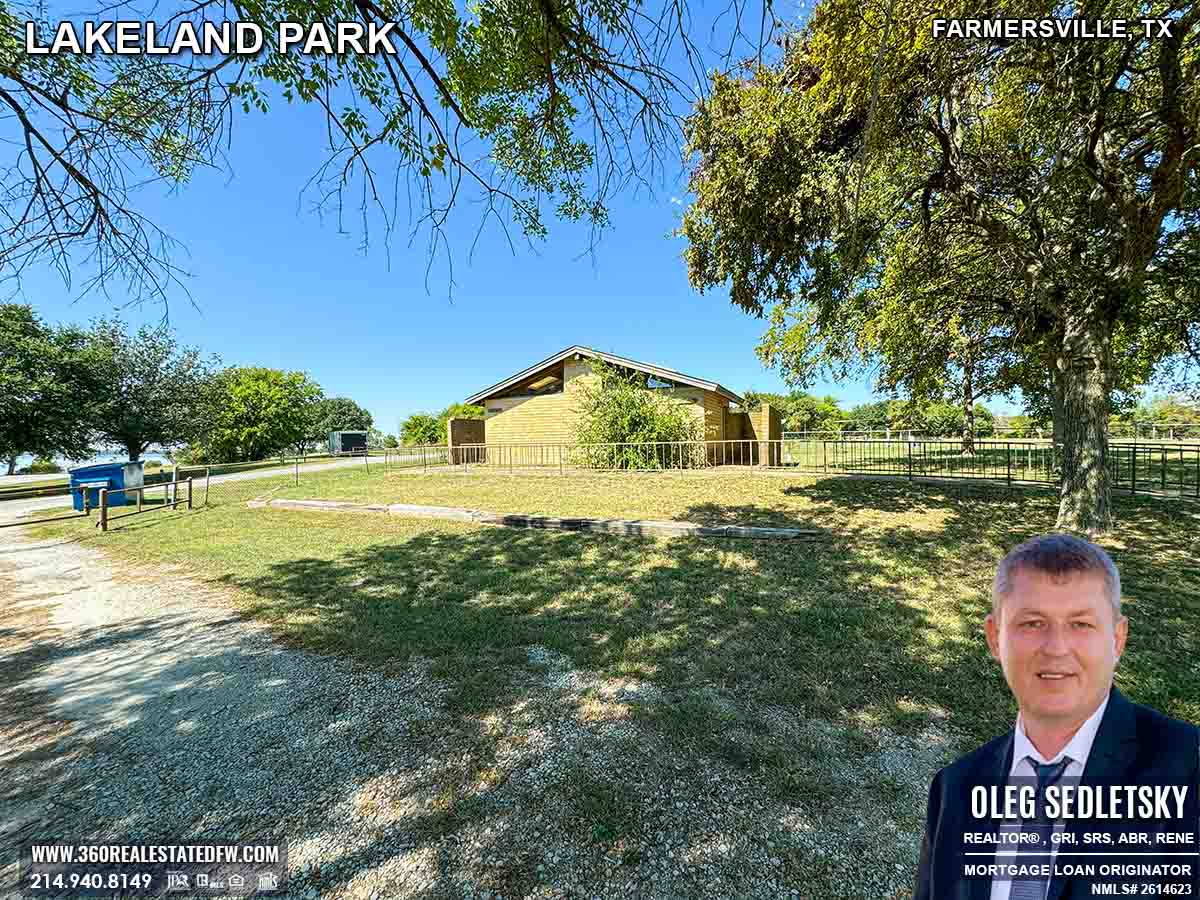
UNIQUE FEATURE ALERT! You can rent a Shelter at the Lakeland Park for your private events!
Planning a special gathering? The park’s lakeside shelter is the perfect venue. For $150 per day, you can reserve this spacious structure, which comes equipped with large tables, a big grill, two smaller grills, and an open fire pit. Plus, you’ll enjoy stunning lake views and the privacy of a space separated from the park’s general area. Whether it’s a birthday, reunion, or wedding, this shelter adds unforgettable charm to any event.
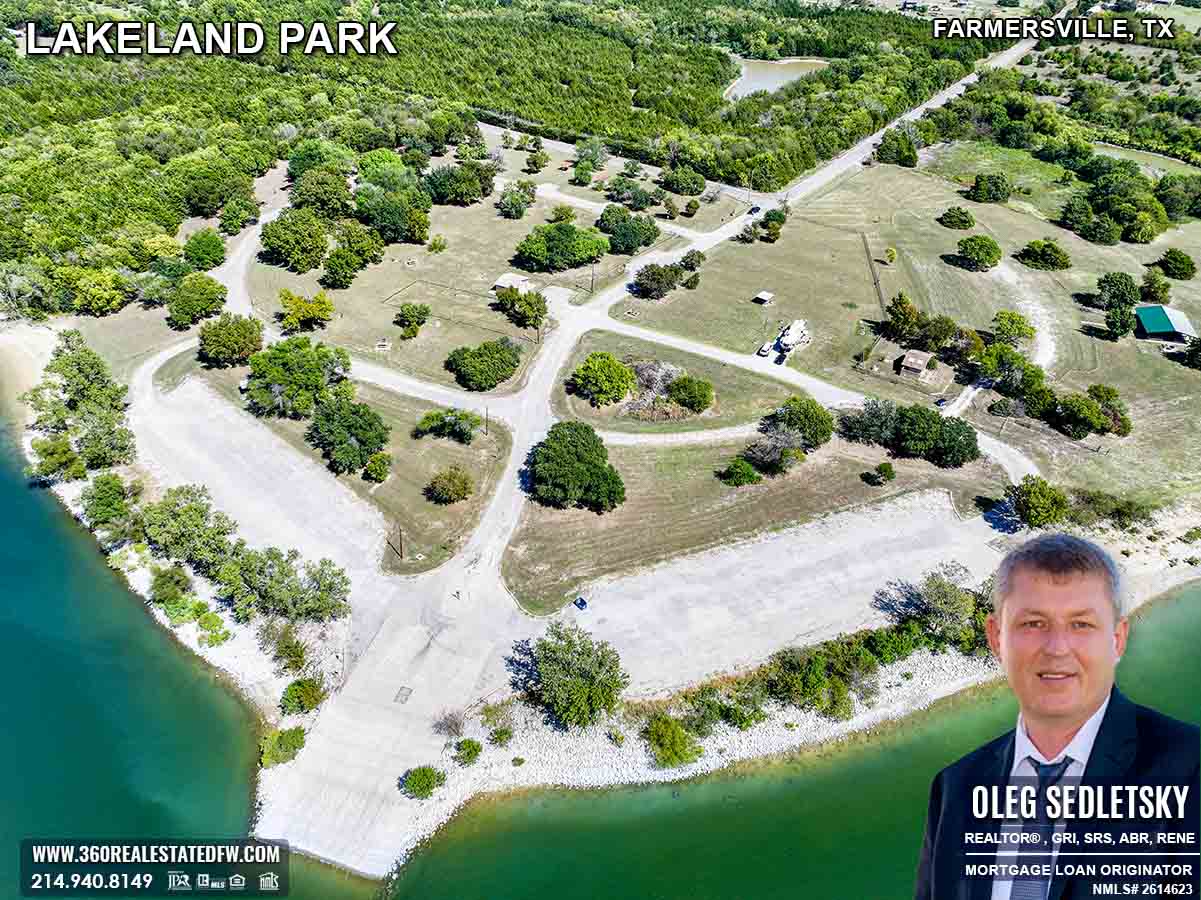
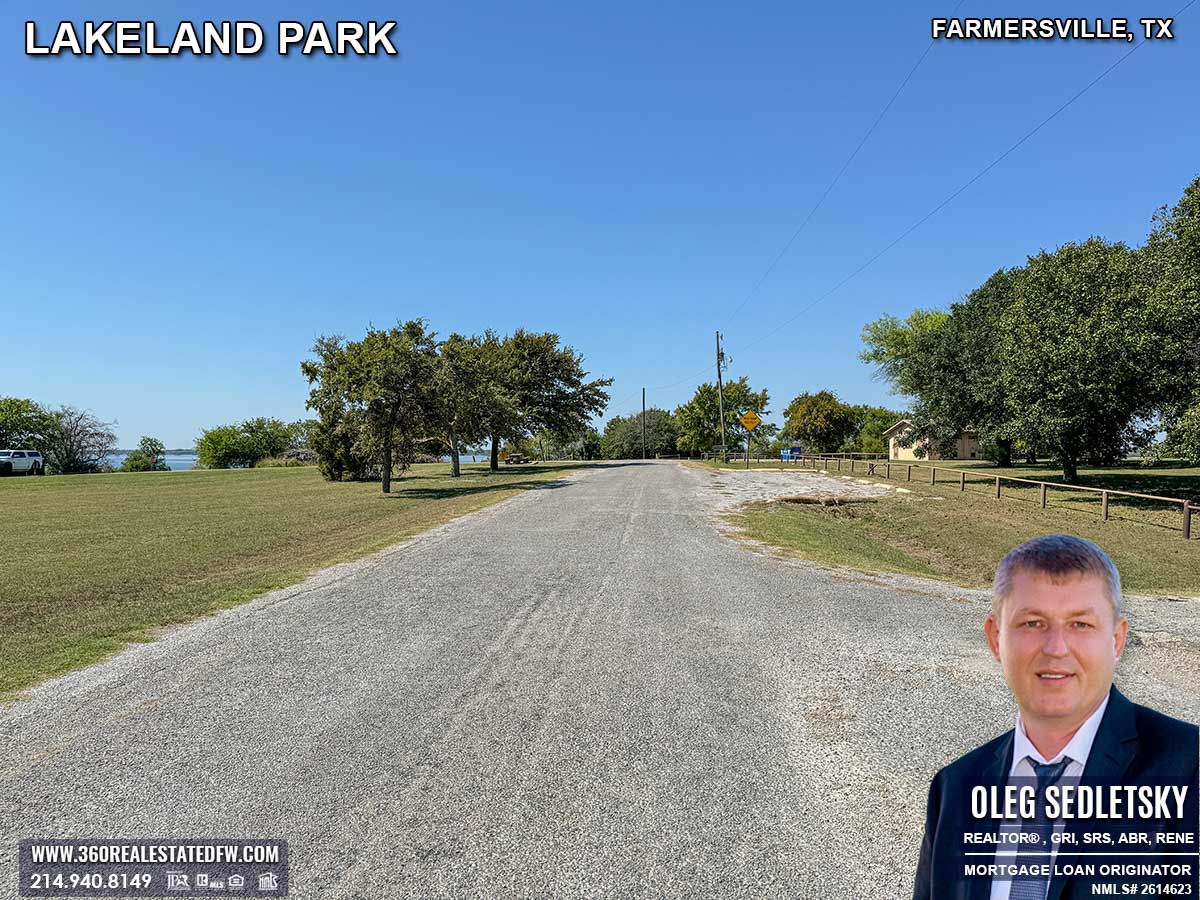
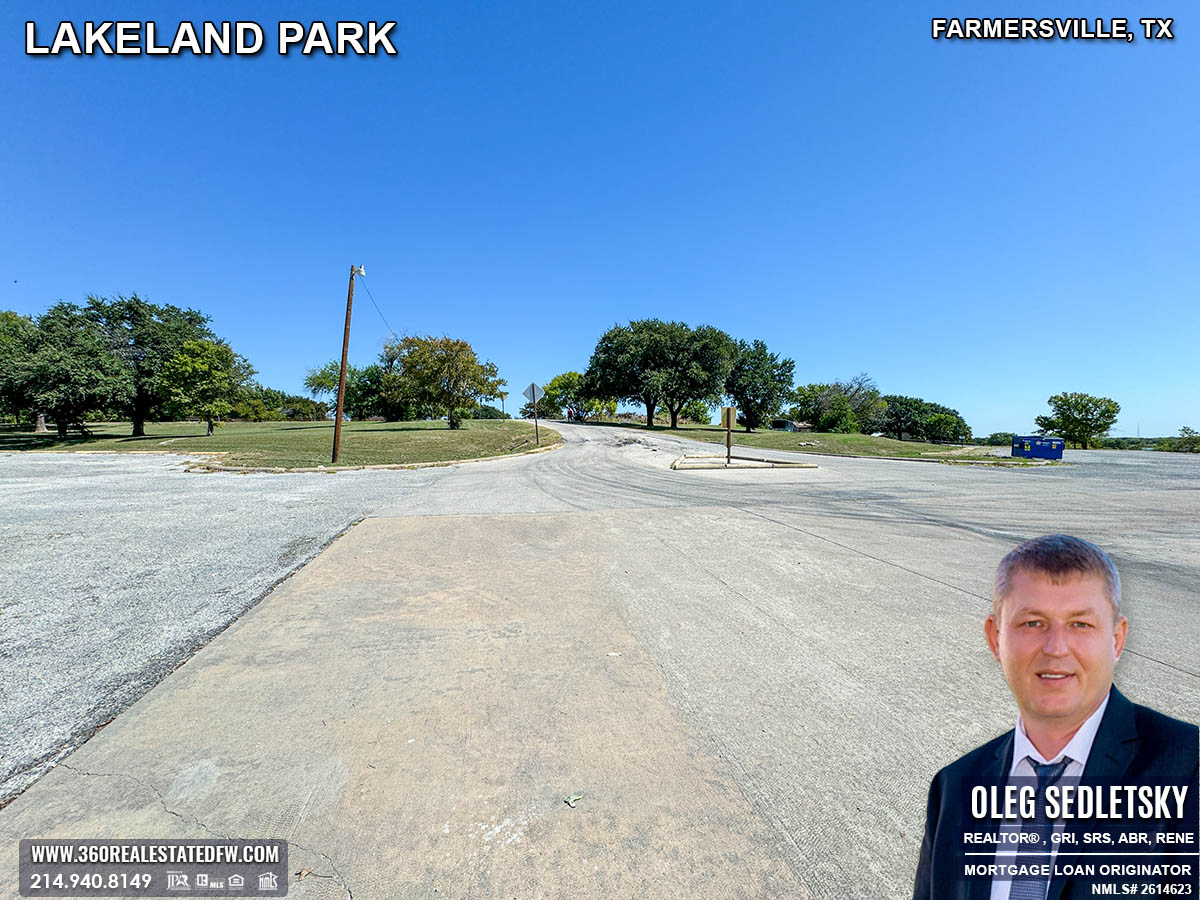
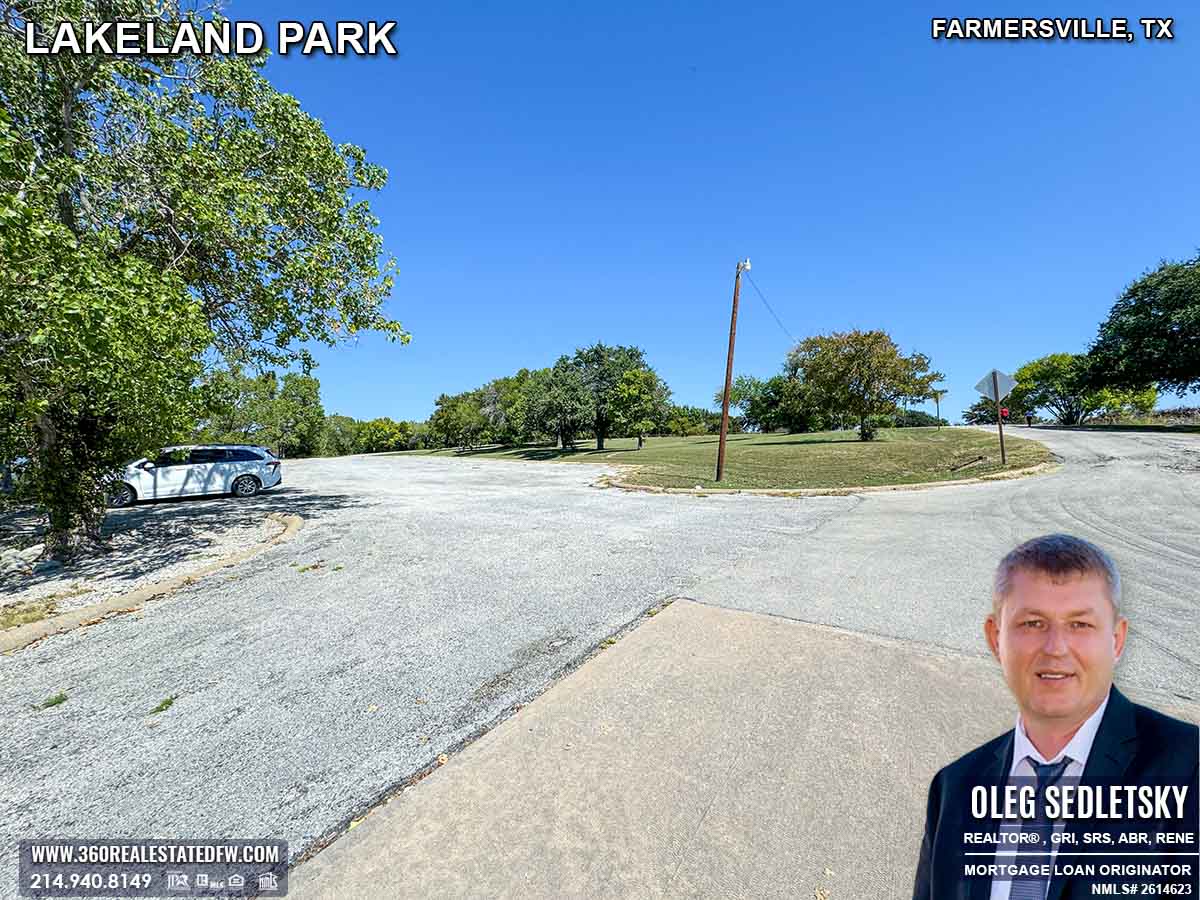
Ample Parking Available at the Lakeland Park
Parking won’t be an issue when you visit this park. While many picnic sites have parking spaces nearby for added convenience, there’s also plenty of general public parking available. Take your time exploring without worrying about finding a spot for your vehicle.
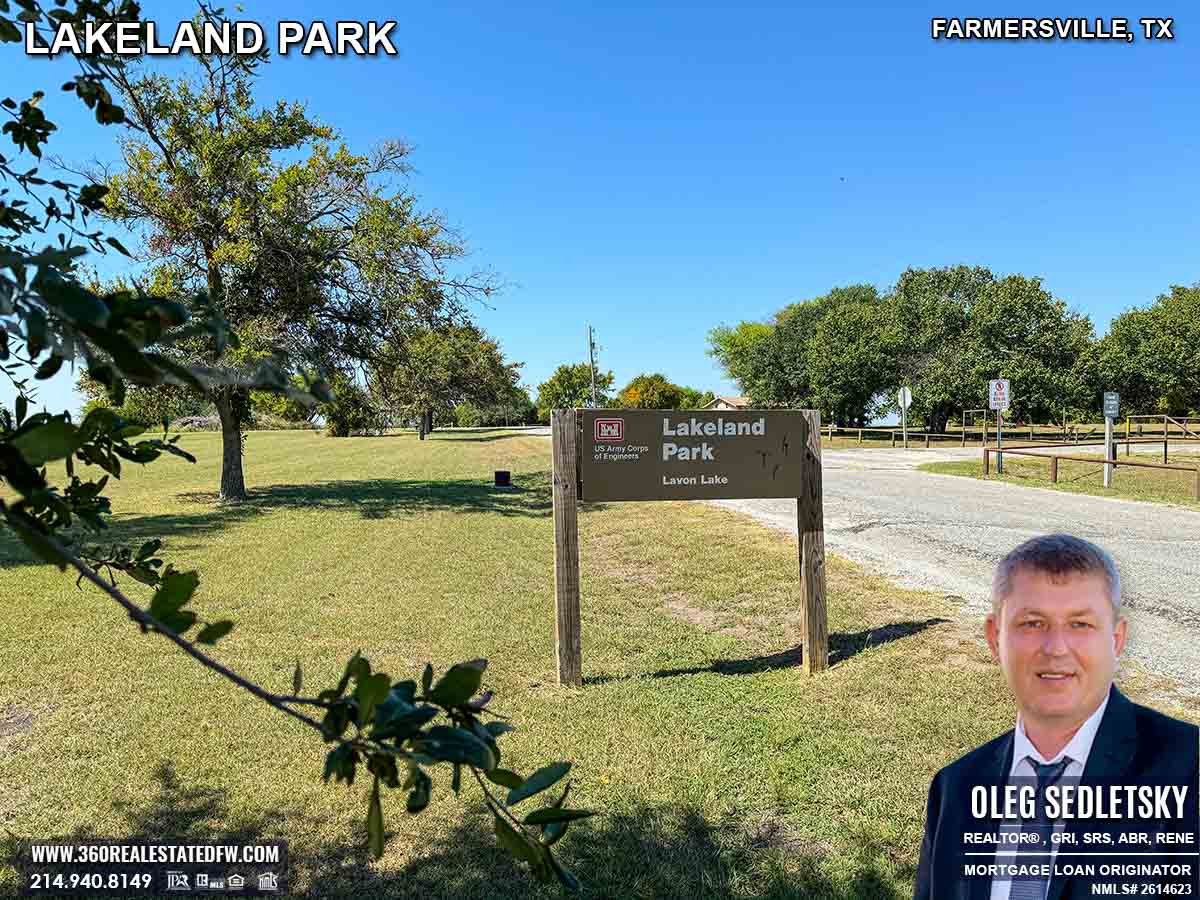
Where to Find the Lakeland Park?
You’ll have no trouble finding this park, as it’s right in the heart of Lavon Lake in Farmersville, TX.
Just set your GPS to 13560 Co Rd 550, Farmersville, TX 75442 and you’ll be on your way.
What Makes The Lakeland Park Unique?
While there are plenty of great parks out there, (like Ticky Creek Park in Princeton, TX for example) this one stands out for three big reasons.
- First, its sunsets are unforgettable, making it a must-visit for photographers and romantics alike.
- Second, the shelter rental is perfect for private events with a view that’s hard to beat.
- And third, the free boat ramp is an outdoor enthusiast’s dream, offering easy access to lake adventures without breaking the bank.
Whether you’re looking for a peaceful retreat or a fun-filled day with your family, the Lakeland Park is ready to deliver. From fishing trips to family picnics and everything in between, this park offers the perfect backdrop for making memories. Plan your visit today, and you’ll soon see why this spot is one of the best lake parks in Farmersville, TX!
Photo Gallery of Lakeland Park in Farmersville, TX (over 100 photos)
Are you ready to experience the joy of homeownership in the vibrant Dallas-Fort Worth area?
Whether you’re in search of an existing home or a brand-new construction, rest assured that I’m here to assist you every step of the way.
With a dedicated Realtor by your side, the home-buying process becomes a breeze. Say goodbye to stress, and let me handle all the intricate details on your behalf.
Getting the guidance you need is as simple as filling out a brief questionnaire on my Homebuyers contact form. From there, I’ll take care of everything, ensuring a seamless and hassle-free journey towards finding your dream home.
Call/Text 214.940.8149
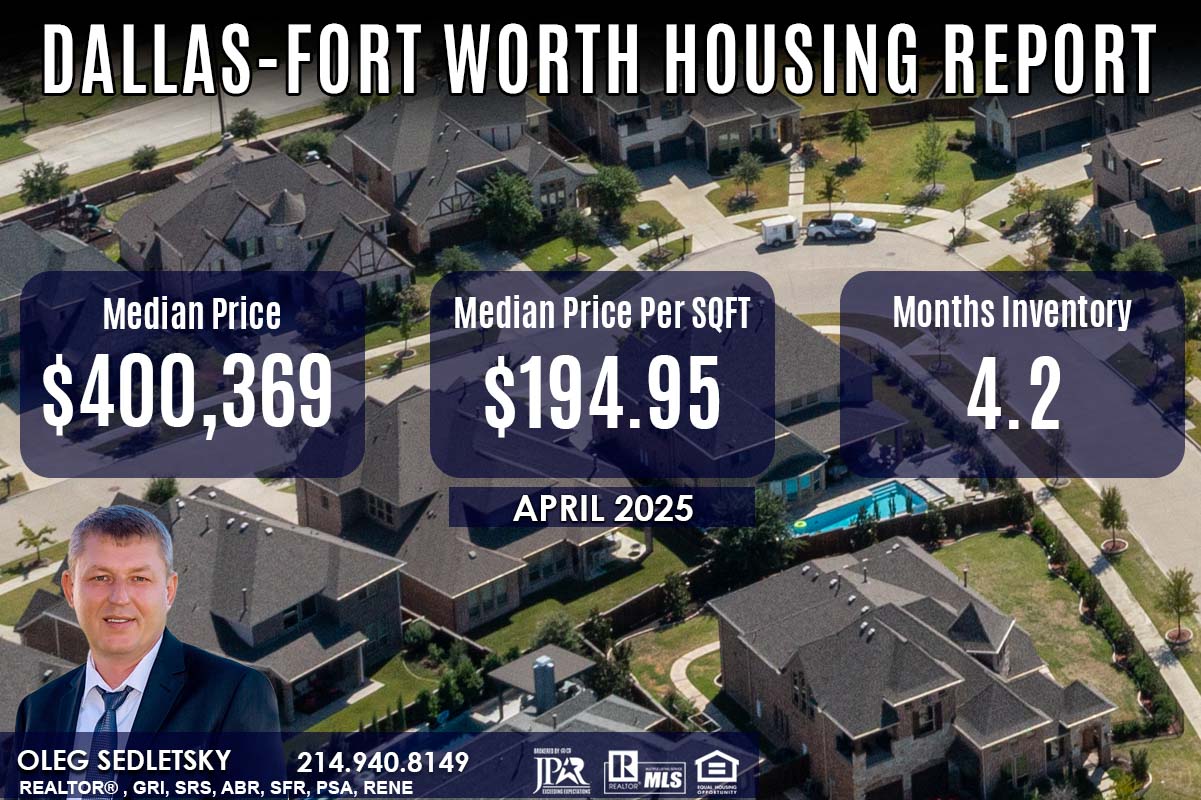
Dallas-Fort Worth Housing Market - Collin County Housing Market: Prices, Trends | April 2025
Housing Report for Dallas-Fort Worth-Arlington Metropolitan Statistical Area – April 2025
Single-Family Homes SUMMARY
Sales volume for single-family homes decreased 3.8% YoY from 7,922 to 7,621 transactions.
Year-to-date sales reached a total of 25,986 closed listings.
Dollar volume dipped from $4.06 billion to $4 billion.
The average sales price rose 2.38% YoY from $512,267 to $524,477.
The average price per square foot declined from $212.67 to $212.21.
The median price declined 2.35% YoY from $410,000 to $400,369.
The median price per square foot declined from $198.62 to $194.95.
Months inventory for single-family homes rose from 3.1 to 4.2 months supply.
Days to sell rose from 79 to 88.
—
(Days to Sell = Days on Market + Days to Close)
(YoY – Year-over-Year is a calculation commonly used in economics or financial data to show how information from one time period compares to the year prior. )
Dallas-Fort Worth Housing Report April 2025 (single family homes residential)
April 2025 | YoY %
Home Sales: 7,621 | -3.80%
Dollar Volume: $3,997,039,565 | -1.51%
Median Close Price: $400,369 | -2.35%
New Listings: 14,083 | 13.66%
Active Listings: 29,651 | 37.82%
Months Inventory: 4.2 | 35.50%
Days to Sell: 88 | 11.39%
Average Price PSF: $212.21 | -0.21%
Median Price PSF: $194.95 | -1.84%
Median Square Feet: 2,134 | 1.62%
Close to Original List Price: 95.75% | -1.31%
COLLIN COUNTY HOUSING REPORT – April 2025
April 2025 | YoY %
New Listings: 2,995 | + 22.6%
Average Sales Price: $577,775 | + 0.6%
Median Sales Price: $565,881 | + 0.9%
Days on Market Until Sale: 52 | + 33.3%
Inventory of Homes for Sale: 5,945 | + 61.3%
Months Supply of Inventory: 4.4 | + 51.7%
Close to Original List Price: 95.6% | – 2.2%
Note! Sales Prices do not include prices from any previous listing contracts or seller concessions.
Relocating to Dallas-Fort Worth?
Consider Willow Ridge community in Prosper, Texas
Welcome to the vibrant Willow Ridge community, future homeowners! You’re about to explore a unique blend of luxury, convenience, and a family-friendly atmosphere. Nestled in the heart of Town of Prosper, TX, the Willow Ridge community offers a lifestyle that’s both dynamic and serene. I’m Oleg Sedletsky, your go-to Realtor and Mortgage Loan Originator in Prosper, Texas, and I’m excited to introduce you to the remarkable features and benefits here at Willow Ridge. Let’s dive into all that this amazing community has to offer!
Prosper, TX is located in Collin County Texas and is part of Dallas-Fort Worth metropolitan area.
About the data used in this report
Data used in Dallas-Fort Worth- Arlington report come from Texas Realtor® Data Relevance Project, a partnership between the Texas Association of Realtors® and local Realtor® associations throughout the state. The analysis is provided through a research agreement with the Real Estate Center at Texas A&M University
Data used in Collin County report come from North Texas Real Estate Information Services, Inc.
You may also be interested in:
Latest from Dallas Real Estate Blog
– Texas Homebuyers Tips, Tricks and Lifehacks
– New Construction Homes in Dallas TX
– Texas Home Sellers Tips, Tricks and Lifehacks
– Mortgages for Homebuyers and Investors in Dallas-Fort Worth
Dallas-Fort Worth Relocation Guide
Explore an important information for Home Sellers in the Dallas-Fort Worth area
Explore an important information for Home Buyers in the Dallas-Fort Worth area
2025
Dallas-Fort Worth Housing Market – Collin County Housing Market: Prices and Trends | January 2025
Dallas-Fort Worth Housing Market – Collin County Housing Market: Prices and Trends | February 2025
Dallas-Fort Worth Housing Market – Collin County Housing Market: Prices and Trends | March 2025
Dallas-Fort Worth Housing Market – Collin County Housing Market: Prices and Trends | April 2025
Dallas-Fort Worth Housing Market – Collin County Housing Market: Prices and Trends | May 2025
Dallas-Fort Worth Housing Market – Collin County Housing Market: Prices and Trends | June 2025
Dallas-Fort Worth Housing Market – Collin County Housing Market: Prices and Trends | July 2025
Dallas-Fort Worth Housing Market – Collin County Housing Market: Prices and Trends | August 2025
Dallas-Fort Worth Housing Market – Collin County Housing Market: Prices and Trends | September 2025
Dallas-Fort Worth Housing Market – Collin County Housing Market: Prices and Trends | October 2025
Dallas-Fort Worth Housing Market – Collin County Housing Market: Prices and Trends | November 2025
Dallas-Fort Worth Housing Market – Collin County Housing Market: Prices and Trends | December 2025
2024
Dallas-Fort Worth Housing Market: Prices and Trends | December 2024
Dallas-Fort Worth Housing Market: Prices and Trends | November 2024
Dallas-Fort Worth Housing Market: Prices and Trends | October 2024
Dallas-Fort Worth Market: Prices and Trends | September 2024
Dallas-Fort Worth Housing Market: Prices and Trends | August 2024
Dallas-Fort Worth Housing Market: Prices and Trends | July 2024
Dallas-Fort Worth Housing Market: Prices and Trends | June 2024
Dallas-Fort Worth Housing Market: Prices and Trends | May 2024
Dallas-Fort Worth Housing Market: Prices and Trends | April 2024
Dallas-Fort Worth Housing Market: Prices and Trends | March 2024
Dallas-Fort Worth Housing Market: Prices and Trends | February 2024
Dallas-Fort Worth Housing Market: Prices and Trends | January 2024
2023
Dallas-Fort Worth Housing Market: Prices and Trends | December 2023
Dallas-Fort Worth Housing Market: Prices and Trends | November 2023
Dallas-Fort Worth Housing Market: Prices and Trends | October 2023
Dallas-Fort Worth Housing Market: Prices and Trends | September 2023
Dallas-Fort Worth Housing Market: Prices and Trends | August 2023
Dallas-Fort Worth Housing Market: Prices and Trends | July 2023
Dallas-Fort Worth Housing Market: Prices and Trends | June 2023
Dallas-Fort Worth Housing Market: Prices and Trends | May 2023
Dallas-Fort Worth Housing Market: Prices and Trends | April 2023
Dallas-Fort Worth Housing Market: Prices and Trends | March 2023
Dallas-Fort Worth Housing Market: Prices and Trends | February 2023
Dallas-Fort Worth Housing Market: Prices and Trends | January 2023
2022
Dallas-Fort Worth Housing Market: Prices and Trends | December 2022
Dallas-Fort Worth Housing Market: Prices and Trends | November 2022
Dallas-Fort Worth Housing Market: Prices and Trends | October 2022
Dallas-Fort Worth Housing Market: Prices and Trends | September 2022
Dallas-Fort Worth Housing Market: Prices and Trends | August 2022
Dallas-Fort Worth Housing Market: Prices and Trends | July 2022
Dallas-Fort Worth Housing Market: Prices and Trends | June 2022
Dallas-Fort Worth Housing Market: Prices and Trends | May 2022
Dallas-Fort Worth Housing Market: Prices and Trends | April 2022
Dallas-Fort Worth Housing Market: Prices and Trends | March 2022
Dallas-Fort Worth Housing Market: Prices and Trends | February 2022
Dallas-Fort Worth Housing Market: Prices and Trends | January 2022

Who Is Oleg Sedletsky? Texas REALTOR® & Mortgage Loan Expert
About Oleg Sedletsky, Your Realtor® and Advocate
Hi, I’m Oleg Sedletsky, and if you’re here, it means you’re about to take a big step in your life. Whether you’re buying your first home, selling your current property, or investing in your future, I’m here to guide you every step of the way in the Dallas-Fort Worth (DFW) area.
Why Am I in Real Estate?
My real estate career began with a personal story that fundamentally shaped how I work with clients today. When I bought my first home in DFW, I was excited but also overwhelmed as a first-time buyer. Unfortunately, my experience with the Realtor I hired left me feeling lost and unsupported. My analytical mind was hungry for information, but instead of getting the clear, critical guidance I needed, I was left with more questions than answers.
That experience ignited a passion in me. I realized how crucial it is to have a Realtor who is more than just a transaction facilitator—someone who genuinely cares, educates, and guides their clients every step of the way.
That’s why, in March 2018, I became a Realtor. My mission is to make sure no one has to endure the frustration I did.
I’m passionate about over-delivering on care, knowledge, and support. My goal is to give you all the information you need to make confident, educated decisions. With me by your side, you’ll never feel uncertain or in the dark—I’m here to make sure every step of the process is clear, achievable, and tailored to meet your goals.

Why Work With Me?
Analytical Mind, Real Estate Expertise
When you work with me, you’re not just getting a Realtor; you’re partnering with someone who is fully invested in your success. My personalized approach means I take the time to understand your unique needs, whether you’re buying, selling, or both.
As a Texas REALTOR® and Mortgage Loan Originator, I offer a seamless, end-to-end experience by combining real estate expertise with tailored mortgage solutions. This dual expertise allows me to guide you confidently through every step of the process, ensuring all your goals are met efficiently and with care.
What truly sets me apart is my unwavering commitment to a client-first approach. Your goals, concerns, and dreams are my top priority. I focus on building trust by delivering clear, honest communication and personalized solutions that align with your unique goals. You can count on me to advocate for your best interests and ensure you feel supported and confident at every turn.
Born in the 1970s, I bring a unique perspective shaped by decades of life experience, coupled with a deep understanding of the real estate market. My background allows me to connect with clients on a more personal level while ensuring you receive expert guidance throughout your real estate and mortgage journey.
With my dedication to transparency, attention to detail, and the promise to always go the extra mile, you’ll experience exceptional results and unmatched support every step of the way.

Certified Expertise You Can Trust
Real estate is a constantly evolving field, and I’m committed to staying ahead of the curve. I’m proud to have earned the following designations, each requiring significant time, education, and dedication to achieve. These certifications represent the best practices I bring to every client relationship:
GRI (Graduate, REALTOR® Institute)
A deep foundation in real estate law, ethics, marketing, and technology.
SRS (Seller Representative Specialist)
Advanced expertise in creating strategies to market and sell your home.
ABR (Accredited Buyer’s Representative)
Dedicated support for buyers, from start to finish, with a focus on negotiation and guidance.
RENE (Certified Real Estate Negotiation Expert)
Masterful negotiation skills to advocate for the best outcomes for you.
PSA (Pricing Strategy Advisor)
Precise property pricing to maximize value and market appeal.
SFR (Short Sales and Foreclosure Resource)
Specialized knowledge to help with challenging transactions like short sales or foreclosures.

Going Beyond the Basics for Buyers and Sellers
For Home Buyers
Buying a home is a significant milestone, and I’m here to make sure it’s a rewarding and well-informed experience. My approach is rooted in education and empowerment, so you feel confident every step of the way.
As a licensed Mortgage Loan Originator, I offer more than just real estate guidance—I bring deep expertise in the financial aspects of buying a home, helping you make smart decisions that align with your budget and goals. I’ll simplify the process by breaking down the details, from understanding mortgage options to accessing valuable resources like first-time buyer grants, down payment assistance programs, and builder incentives (think free appliances, closing cost contributions, and more).
One of my passions is helping buyers focus on what truly matters when purchasing a home. Together, we’ll concentrate on items like monthly affordability, understanding loan terms, and long-term value, while avoiding common pitfalls, like overstretching your budget or skipping important steps like inspections. I also provide guidance on navigating Municipal Utility Districts (MUDs), Public Improvement Districts (PIDs), and option periods to keep everything on track.
Beyond the financials, finding the right home means finding the right community. I pride myself on in-depth knowledge of the Dallas-Fort Worth area, from bustling cities like Plano, Frisco, McKinney to serene, family-friendly neighborhoods in Prosper, Celina, Allen, and the fastest growing city in America – Princeton, TX. Whether you’re looking for top-tier schools, hiking and biking trails, dog-friendly parks, or vibrant downtowns, I’ll help you weigh the amenities that matter most to you.
Imagine your weekends spent at lush green spaces like Bonnie Wenk Park in McKinney, Natural Springs Park in Anna TX, Frontier Park in Prosper TX, or Tickey Creek Park on Lake Lavon in Princeton,TX. Picture your daily life with access to fantastic restaurants, community events, and excellent schools. With my guidance, you’ll understand how each location aligns with your lifestyle, making it easier to choose the perfect place to call home.
I’m with you from start to finish, answering your questions, addressing your concerns, and ensuring no detail is overlooked. By the time you’re handed the keys to your new home, you’ll feel confident you made the right choice—not just for today, but for years to come.

For Home Sellers
Selling a home is more than just a transaction; it’s a life-changing moment that deserves expert care and precision. I’m here to make sure your selling experience is seamless, stress-free, and, most importantly, profitable.
My Comprehensive Home-Selling Plan is built to showcase your home’s unique appeal and attract the right buyers. From the start, I focus on creating a standout listing with professional photography and videos that highlight your property’s best features, whether that’s a stunning backyard, updated kitchen, or close proximity to local parks and trails. And with strategic, targeted marketing across platforms like Facebook, Instagram, and YouTube, your home will gain the exposure it needs to stand out in today’s competitive market.
One of the most critical aspects of selling a home is pricing it right. With my Pricing Strategy Advisor (PSA) certification, I use data, market analysis, and a deep understanding of buyer trends to determine the most effective pricing strategy for your home. And when buyers come knocking, my expertise as a Certified Real Estate Negotiation Expert (RENE) ensures that you’ll get the best deal possible.
I also understand that presentation is everything. Small details can make a big difference in how buyers perceive your home. That’s why I’ll provide you with staging tips (like creating a welcoming atmosphere by setting the thermostat to a comfortable 70°F) and advice on highlighting features like nearby parks, walking trails, or community amenities that can add significant value in the eyes of potential buyers.
With my step-by-step guidance, from preparing your home for the market to final negotiations, I make the selling process as smooth and rewarding as possible. Together, we’ll ensure your home shines and sells for its highest potential. When you’re ready to take the next step, I’m here to help you get there with confidence.
The Dallas-Fort Worth area is a place I’m proud to call home. Each community is unique and vibrant, offering something for everyone. Whether it’s Prosper’s Willow Ridge or Celinas’s Mustang Lakes, I have in-depth knowledge to guide you toward the perfect home, neighborhood, or investment.
What You Gain By Working With Me
Knowledge and Confidence
I empower you with clear, detailed insights so you always know your next step. Real estate decisions are too important to leave to guesswork, and I’ll make sure you feel confident every step of the way.
Cost-Saving Strategies
From builder incentives to seller concessions, I’ll help you save money wherever possible.
Efficiency and Expertise
Time is money. I streamline every process to get you results faster without cutting corners.
Results-Driven Service
Whether it’s pricing strategy, marketing, or negotiations, my approach is all about delivering the outcomes you deserve.
A guardian of your best interests and an advocate for your goals
I’m not just a Realtor—I’m a guardian of your best interests and an advocate for your goals. When you work with me, you’re not just getting a skilled market expert; you’re getting a trusted partner who is deeply committed to protecting your investment and ensuring you achieve your desired outcomes. I prioritize transparency at every step, keeping you informed and empowered to make the best decisions. Your success is my mission, and I work tirelessly to deliver results that align with your unique needs and aspirations.
Your Next Step
This isn’t just about buying or selling a home; it’s about navigating one of life’s biggest decisions with someone who genuinely cares. My goal isn’t just to meet your expectations—but to exceed them.
If you’re ready to get started, call/text me today at 214-940-8149, or reach out through my Home Buyers and Home Sellers contact forms. I can’t wait to help you write the next chapter of your story!
Unlock Exceptional Service!
Assistance with all your real estate needs in the Dallas-Fort Worth area is just a click or call away. Reach out at 214-940-8149 or connect through the links below.
Dallas-Fort Worth Housing Market - Collin County Housing Market: Prices, Trends | March 2025
Housing Report for Dallas-Fort Worth-Arlington Metropolitan Statistical Area – March 2025
Single-Family Homes SUMMARY
Sales volume for single-family homes increased 0.78% YoY from 7,343 to 7,400 transactions.
Year-to-date sales reached a total of 18,406 closed listings.
Dollar volume rose from $3.65 billion to $3.75 billion.
The average sales price rose 1.94% YoY from $496,838 to $506,491,
The average price per square foot declined from $207.52 to $207.44.
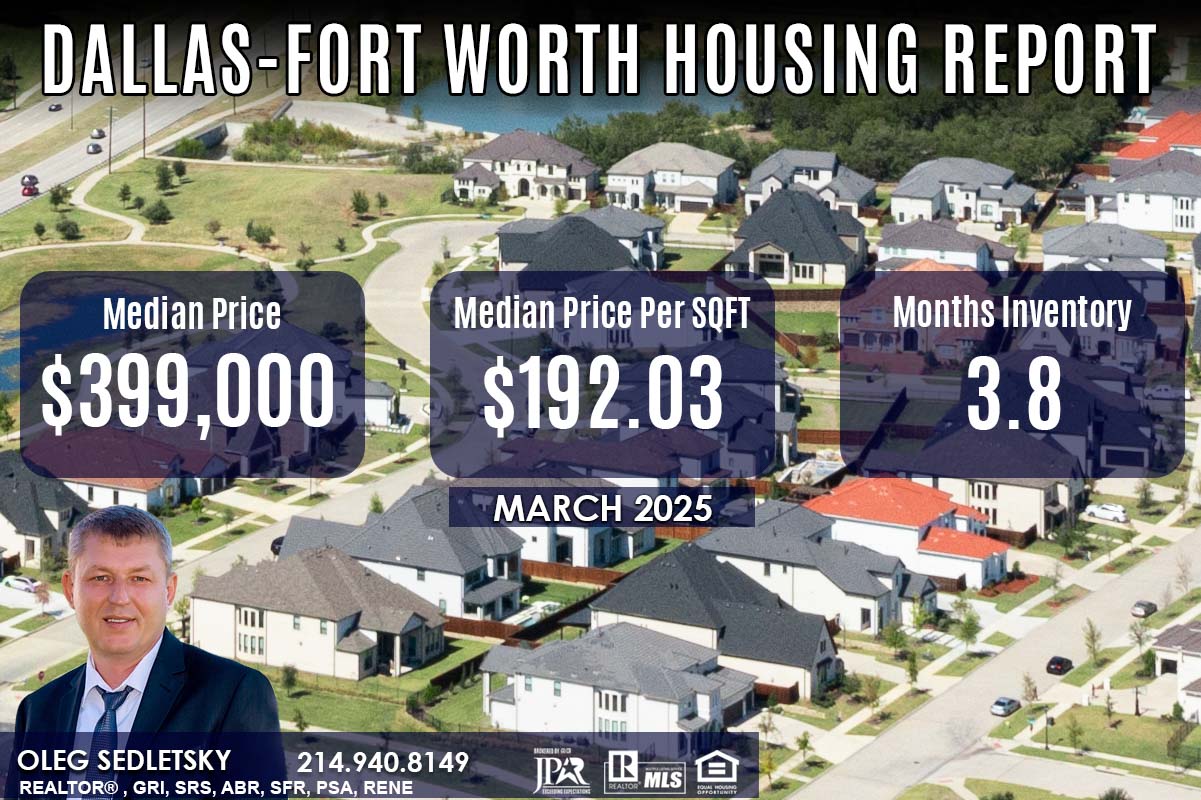
Median price rose 0.25% YoY from $398,000 to $399,000.
The median price per square foot declined from $195.12 to $192.03.
Months inventory for single-family homes rose from 2.9 to 3.8 months supply,
Days to sell rose from 84 to 95.
—
(Days to Sell = Days on Market + Days to Close)
(YoY – Year-over-Year is a calculation commonly used in economics or financial data to show how information from one time period compares to the year prior. )
Dallas-Fort Worth Housing Report March 2025 (single family homes residential)
March 2025 | YoY %
Home Sales: 7,400 | 0.78%
Dollar Volume: $3,748,033,698 | 2.73%
Median Close Price: $399,000 | 0.25%
New Listings: 13,094 | 15.97%
Active Listings: 27,003 | 34.78%
Months Inventory: 3.8 | 31.04%
Days to Sell: 95 | 13.10%
Average Price PSF: $207.44 | -0.04%
Median Price PSF: $192.03 | -1.58%
Median Square Feet: 2,136 | 1.47%
Close to Original List Price: 95.28% | -1.08%
COLLIN COUNTY HOUSING REPORT – March 2025
March 2025 | YoY %
New Listings: 2,660 | + 26.2%
Average Sales Price: $577,775 | + 0.6%
Median Sales Price: $475,000 | – 3.0%
Days on Market Until Sale: 58 | + 41.5%
Inventory of Homes for Sale: 5,090 | + 56.6%
Months Supply of Inventory: 3.8 | + 46.2%
Close to Original List Price: 95.3% | – 1.9%
Note! Sales Prices do not include prices from any previous listing contracts or seller concessions.
Relocating to Dallas-Fort Worth?
Consider Willow Ridge community in Prosper, Texas
Welcome to the vibrant Willow Ridge community, future homeowners! You’re about to explore a unique blend of luxury, convenience, and a family-friendly atmosphere. Nestled in the heart of Town of Prosper, TX, the Willow Ridge community offers a lifestyle that’s both dynamic and serene. I’m Oleg Sedletsky, your go-to Realtor and Mortgage Loan Originator in Prosper, Texas, and I’m excited to introduce you to the remarkable features and benefits here at Willow Ridge. Let’s dive into all that this amazing community has to offer!
Prosper, TX is located in Collin County Texas and is part of Dallas-Fort Worth metropolitan area.
About the data used in this report
Data used in Dallas-Fort Worth- Arlington report come from Texas Realtor® Data Relevance Project, a partnership between the Texas Association of Realtors® and local Realtor® associations throughout the state. The analysis is provided through a research agreement with the Real Estate Center at Texas A&M University
Data used in Collin County report come from North Texas Real Estate Information Services, Inc.
You may also be interested in:
Latest from Dallas Real Estate Blog
– Texas Homebuyers Tips, Tricks and Lifehacks
– New Construction Homes in Dallas TX
– Texas Home Sellers Tips, Tricks and Lifehacks
– Mortgages for Homebuyers and Investors in Dallas-Fort Worth
Dallas-Fort Worth Relocation Guide
Explore an important information for Home Sellers in the Dallas-Fort Worth area
Explore an important information for Home Buyers in the Dallas-Fort Worth area
2025
Dallas-Fort Worth Housing Market – Collin County Housing Market: Prices and Trends | January 2025
Dallas-Fort Worth Housing Market – Collin County Housing Market: Prices and Trends | February 2025
Dallas-Fort Worth Housing Market – Collin County Housing Market: Prices and Trends | March 2025
Dallas-Fort Worth Housing Market – Collin County Housing Market: Prices and Trends | April 2025
Dallas-Fort Worth Housing Market – Collin County Housing Market: Prices and Trends | May 2025
Dallas-Fort Worth Housing Market – Collin County Housing Market: Prices and Trends | June 2025
Dallas-Fort Worth Housing Market – Collin County Housing Market: Prices and Trends | July 2025
Dallas-Fort Worth Housing Market – Collin County Housing Market: Prices and Trends | August 2025
Dallas-Fort Worth Housing Market – Collin County Housing Market: Prices and Trends | September 2025
Dallas-Fort Worth Housing Market – Collin County Housing Market: Prices and Trends | October 2025
Dallas-Fort Worth Housing Market – Collin County Housing Market: Prices and Trends | November 2025
Dallas-Fort Worth Housing Market – Collin County Housing Market: Prices and Trends | December 2025
2024
Dallas-Fort Worth Housing Market: Prices and Trends | December 2024
Dallas-Fort Worth Housing Market: Prices and Trends | November 2024
Dallas-Fort Worth Housing Market: Prices and Trends | October 2024
Dallas-Fort Worth Market: Prices and Trends | September 2024
Dallas-Fort Worth Housing Market: Prices and Trends | August 2024
Dallas-Fort Worth Housing Market: Prices and Trends | July 2024
Dallas-Fort Worth Housing Market: Prices and Trends | June 2024
Dallas-Fort Worth Housing Market: Prices and Trends | May 2024
Dallas-Fort Worth Housing Market: Prices and Trends | April 2024
Dallas-Fort Worth Housing Market: Prices and Trends | March 2024
Dallas-Fort Worth Housing Market: Prices and Trends | February 2024
Dallas-Fort Worth Housing Market: Prices and Trends | January 2024
2023
Dallas-Fort Worth Housing Market: Prices and Trends | December 2023
Dallas-Fort Worth Housing Market: Prices and Trends | November 2023
Dallas-Fort Worth Housing Market: Prices and Trends | October 2023
Dallas-Fort Worth Housing Market: Prices and Trends | September 2023
Dallas-Fort Worth Housing Market: Prices and Trends | August 2023
Dallas-Fort Worth Housing Market: Prices and Trends | July 2023
Dallas-Fort Worth Housing Market: Prices and Trends | June 2023
Dallas-Fort Worth Housing Market: Prices and Trends | May 2023
Dallas-Fort Worth Housing Market: Prices and Trends | April 2023
Dallas-Fort Worth Housing Market: Prices and Trends | March 2023
Dallas-Fort Worth Housing Market: Prices and Trends | February 2023
Dallas-Fort Worth Housing Market: Prices and Trends | January 2023
2022
Dallas-Fort Worth Housing Market: Prices and Trends | December 2022
Dallas-Fort Worth Housing Market: Prices and Trends | November 2022
Dallas-Fort Worth Housing Market: Prices and Trends | October 2022
Dallas-Fort Worth Housing Market: Prices and Trends | September 2022
Dallas-Fort Worth Housing Market: Prices and Trends | August 2022
Dallas-Fort Worth Housing Market: Prices and Trends | July 2022
Dallas-Fort Worth Housing Market: Prices and Trends | June 2022
Dallas-Fort Worth Housing Market: Prices and Trends | May 2022
Dallas-Fort Worth Housing Market: Prices and Trends | April 2022
Dallas-Fort Worth Housing Market: Prices and Trends | March 2022
Dallas-Fort Worth Housing Market: Prices and Trends | February 2022
Dallas-Fort Worth Housing Market: Prices and Trends | January 2022
Dallas-Fort Worth Housing Market - Collin County Housing Market: Prices, Trends | February 2025
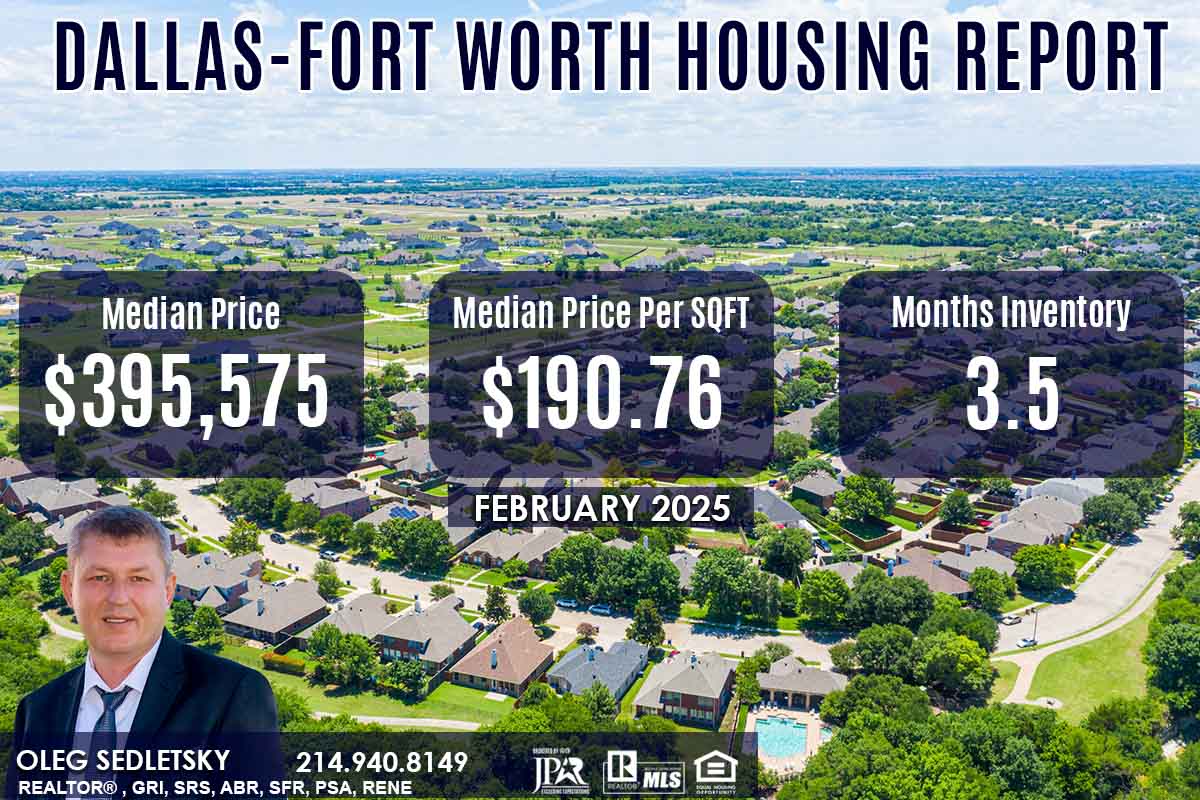
Housing Report for Dallas-Fort Worth-Arlington Metropolitan Statistical Area – February 2025
Single-Family Homes SUMMARY
Sales volume for single-family homes decreased 4.83% YoY from 6,226 to 5,925 transactions.
Year-to-date sales reached a total of 10,932 closed listings.
Dollar volume dipped from $2.99 billion to $2.91 billion.
The average sales price rose 2.32% YoY from $480,474 to $491,621.
The average price per square foot subsequently rose from $204.65 to $205.09.
Median price rose 1.43% YoY from $390,000 to $395,575.
The median price per square foot declined from $192.13 to $190.76.
Months inventory for single-family homes rose from 2.7 to 3.5 months supply.
Days to sell rose from 93 to 100.
—
(Days to Sell = Days on Market + Days to Close)
(YoY – Year-over-Year is a calculation commonly used in economics or financial data to show how information from one time period compares to the year prior. )
Dallas-Fort Worth Housing Report February 2025 (single family homes residential)
February 2025 | YoY %
Home Sales: 5,925 | -4.83%
Dollar Volume: $2,912,851,760 | -2.63%
Median Close Price: $395,575 | 1.43%
New Listings: 9,956 | -0.29%
Active Listings: 24,873 | 33.82%
Months Inventory: 3.5 | 31.22%
Days to Sell: 100 | 7.53%
Average Price PSF: $205.09 | 0.22%
Median Price PSF: $190.76 | -0.71%
Median Square Feet: 2,133 | 2.01%
Close to Original List Price: 94.88% | -0.71%
COLLIN COUNTY HOUSING REPORT – February 2025
February 2025 | YoY %
New Listings: 1,860 |+ 7.6%
Average Sales Price: $551,465 | + 1.7%
Median Sales Price: $464,000 | – 2.8%
Days on Market Until Sale: 66 | + 26.9%
Inventory of Homes for Sale: 4,462 | + 54.2%
Months Supply of Inventory: 3.3 | + 43.5%
Close to Original List Price: 95.1% | – 1.1%
Note! Sales Prices do not include prices from any previous listing contracts or seller concessions.
Relocating to Dallas-Fort Worth?
Consider Willow Ridge community in Prosper, Texas
Welcome to the vibrant Willow Ridge community, future homeowners! You’re about to explore a unique blend of luxury, convenience, and a family-friendly atmosphere. Nestled in the heart of Town of Prosper, TX, the Willow Ridge community offers a lifestyle that’s both dynamic and serene. I’m Oleg Sedletsky, your go-to Realtor and Mortgage Loan Originator in Prosper, Texas, and I’m excited to introduce you to the remarkable features and benefits here at Willow Ridge. Let’s dive into all that this amazing community has to offer!
Prosper, TX is located in Collin County Texas and is part of Dallas-Fort Worth metropolitan area.
About the data used in this report
Data used in Dallas-Fort Worth- Arlington report come from Texas Realtor® Data Relevance Project, a partnership between the Texas Association of Realtors® and local Realtor® associations throughout the state. The analysis is provided through a research agreement with the Real Estate Center at Texas A&M University
Data used in Collin County report come from North Texas Real Estate Information Services, Inc.
You may also be interested in:
Latest from Dallas Real Estate Blog
– Texas Homebuyers Tips, Tricks and Lifehacks
– New Construction Homes in Dallas TX
– Texas Home Sellers Tips, Tricks and Lifehacks
– Mortgages for Homebuyers and Investors in Dallas-Fort Worth
Dallas-Fort Worth Relocation Guide
Explore an important information for Home Sellers in the Dallas-Fort Worth area
Explore an important information for Home Buyers in the Dallas-Fort Worth area
2025
Dallas-Fort Worth Housing Market – Collin County Housing Market: Prices and Trends | January 2025
Dallas-Fort Worth Housing Market – Collin County Housing Market: Prices and Trends | February 2025
Dallas-Fort Worth Housing Market – Collin County Housing Market: Prices and Trends | March 2025
Dallas-Fort Worth Housing Market – Collin County Housing Market: Prices and Trends | April 2025
Dallas-Fort Worth Housing Market – Collin County Housing Market: Prices and Trends | May 2025
Dallas-Fort Worth Housing Market – Collin County Housing Market: Prices and Trends | June 2025
Dallas-Fort Worth Housing Market – Collin County Housing Market: Prices and Trends | July 2025
Dallas-Fort Worth Housing Market – Collin County Housing Market: Prices and Trends | August 2025
Dallas-Fort Worth Housing Market – Collin County Housing Market: Prices and Trends | September 2025
Dallas-Fort Worth Housing Market – Collin County Housing Market: Prices and Trends | October 2025
Dallas-Fort Worth Housing Market – Collin County Housing Market: Prices and Trends | November 2025
Dallas-Fort Worth Housing Market – Collin County Housing Market: Prices and Trends | December 2025
2024
Dallas-Fort Worth Housing Market: Prices and Trends | December 2024
Dallas-Fort Worth Housing Market: Prices and Trends | November 2024
Dallas-Fort Worth Housing Market: Prices and Trends | October 2024
Dallas-Fort Worth Market: Prices and Trends | September 2024
Dallas-Fort Worth Housing Market: Prices and Trends | August 2024
Dallas-Fort Worth Housing Market: Prices and Trends | July 2024
Dallas-Fort Worth Housing Market: Prices and Trends | June 2024
Dallas-Fort Worth Housing Market: Prices and Trends | May 2024
Dallas-Fort Worth Housing Market: Prices and Trends | April 2024
Dallas-Fort Worth Housing Market: Prices and Trends | March 2024
Dallas-Fort Worth Housing Market: Prices and Trends | February 2024
Dallas-Fort Worth Housing Market: Prices and Trends | January 2024
2023
Dallas-Fort Worth Housing Market: Prices and Trends | December 2023
Dallas-Fort Worth Housing Market: Prices and Trends | November 2023
Dallas-Fort Worth Housing Market: Prices and Trends | October 2023
Dallas-Fort Worth Housing Market: Prices and Trends | September 2023
Dallas-Fort Worth Housing Market: Prices and Trends | August 2023
Dallas-Fort Worth Housing Market: Prices and Trends | July 2023
Dallas-Fort Worth Housing Market: Prices and Trends | June 2023
Dallas-Fort Worth Housing Market: Prices and Trends | May 2023
Dallas-Fort Worth Housing Market: Prices and Trends | April 2023
Dallas-Fort Worth Housing Market: Prices and Trends | March 2023
Dallas-Fort Worth Housing Market: Prices and Trends | February 2023
Dallas-Fort Worth Housing Market: Prices and Trends | January 2023
2022
Dallas-Fort Worth Housing Market: Prices and Trends | December 2022
Dallas-Fort Worth Housing Market: Prices and Trends | November 2022
Dallas-Fort Worth Housing Market: Prices and Trends | October 2022
Dallas-Fort Worth Housing Market: Prices and Trends | September 2022
Dallas-Fort Worth Housing Market: Prices and Trends | August 2022
Dallas-Fort Worth Housing Market: Prices and Trends | July 2022
Dallas-Fort Worth Housing Market: Prices and Trends | June 2022
Dallas-Fort Worth Housing Market: Prices and Trends | May 2022
Dallas-Fort Worth Housing Market: Prices and Trends | April 2022
Dallas-Fort Worth Housing Market: Prices and Trends | March 2022
Dallas-Fort Worth Housing Market: Prices and Trends | February 2022
Dallas-Fort Worth Housing Market: Prices and Trends | January 2022
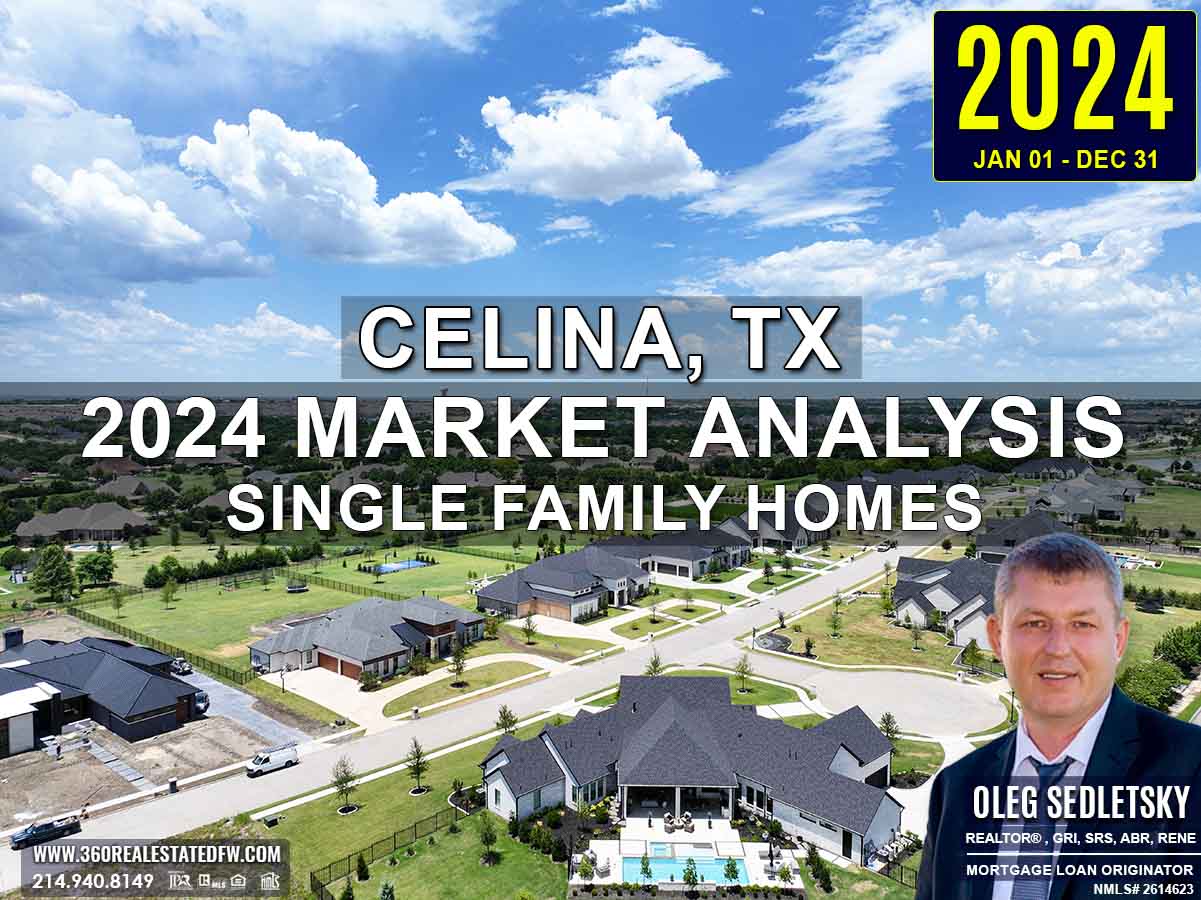
Celina, TX Real Estate: A Comprehensive Analysis of the 2024 Single-Family Residential Housing Market
The 2024 real estate market in Celina, Texas showcases a continued evolution marked by stabilized pricing dynamics, robust new construction activity, and an emphasis on enhanced home features. This analysis delves into key developments, price shifts, and standout properties, providing a clear and insightful overview of the market’s changing landscape.
Key Takeaways and Trends from the 2024 Real Estate Market in Celina, TX
Pricing Range
Pricing remained steady, with the most expensive properties reflecting features like premium acreage and luxury amenities, while the entry-level market expanded slightly with higher affordability.
Market Efficiency
The average DOM rose to 60 days, up from the previous year, reflecting a softening of market pace despite steady buyer activity. Home Sellers leaned on realtor expertise for pricing and marketing.
Unique Outliers
The priciest property, listing at $3.53 million, blends custom luxury features into a master-planned community, contrasting with last year’s larger-acreage luxury sale.
Mortgage Rate Impact
Buyers faced tightened affordability due to 6.90% mortgage rates, resulting in higher demand for seller concessions, builder incentives, assumable mortgages, and rate buy-down offerings.
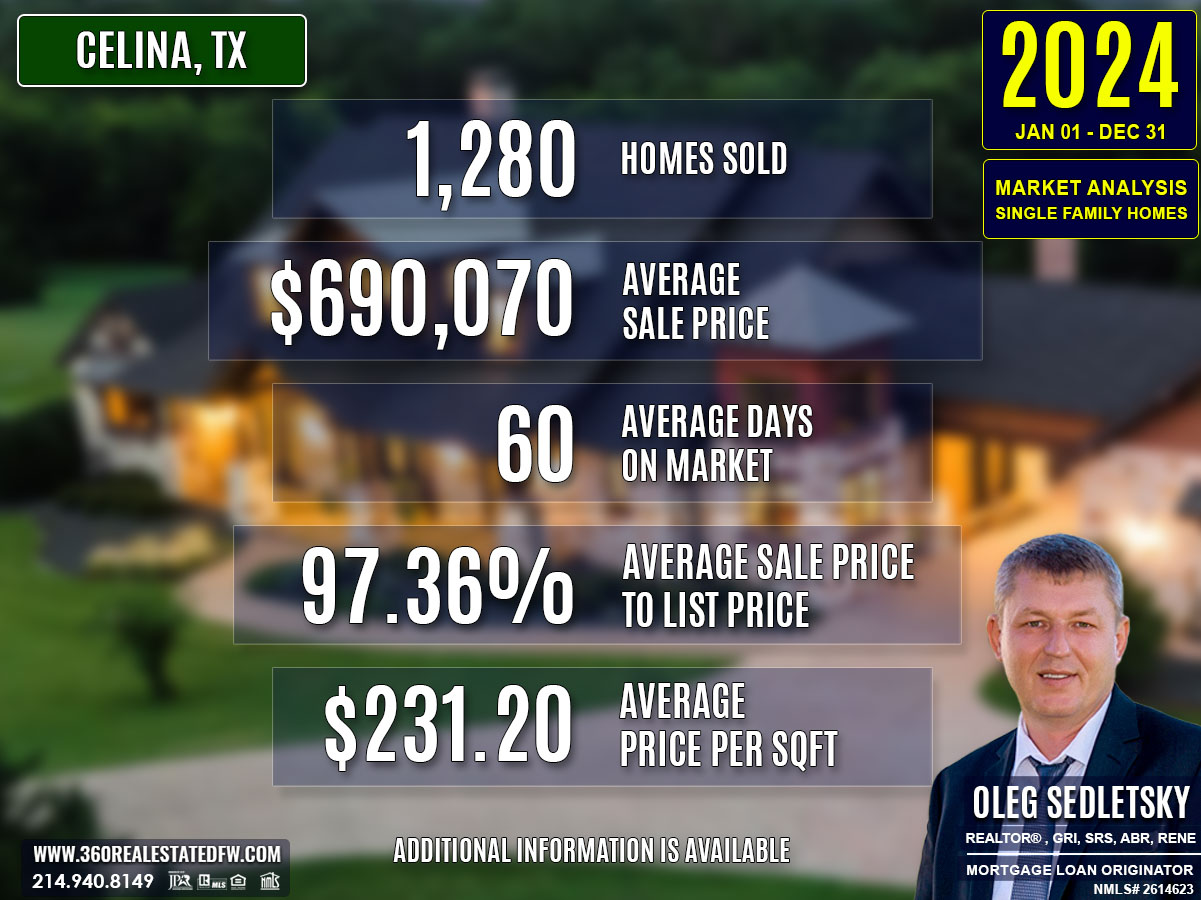
Total Homes Closed
A total of 1,280 residential single-family homes closed in Celina, TX during 2024. The market saw 760 new construction homes, accounting for over 59% of sales, reflecting builders’ success in drawing buyers. Additionally, 93 homes with pools were sold, showcasing steady demand for high-end home features.
Property Pricing Insights
- Minimum Price: $165,000
- Maximum Price: $3,530,000
- Average Price: $690,070
- Median Price: $649,339
The tightly clustered average and median prices suggest a balanced pricing distribution, with high-end sales contributing significantly but not skewing the overall market.
Property Size and Features
- Bedrooms ranged from 2 to 6, with the average home having 4.
- Bathrooms ranged from 1 to 8, with 4 being the average.
- Square Footage ranged from 646 to 7,161 sq. ft., with an average of 2,981 sq. ft.
- Lot Size averaged 0.28 acres, with a general range of smaller, more manageable lots.
A combination of larger homes and multi-purpose spaces catered to changing household dynamics.
Market Dynamics
- Average DOM increased to 60 days, reflecting a slightly more deliberate buyer’s market.
- Average ClsPr/LstPr (Close Price to Listing Price) was steady at 97.36%, showing consistent pricing accuracy.
- ClsPr/OLP (Close Price to Original Listing Price) averaged 95.91%, indicating some price adjustments before final sales.
- Average Price per Sq. Ft. settled at $231.20, showcasing stable pricing for market inventory.
Insights into the Most Expensive Celina, TX Property Sold in 2024
The standout sale of 2024 was a luxury new construction property in Mustang Lakes a premier master-planned community, priced at $3,530,000. With exceptional design and features tailored for high-end buyers, this property set market benchmarks.
- Price: $3,530,000
- Beds/Baths: 6 beds, 7 baths (6 full, 1 half)
- Square Footage: 6,800 sq. ft.
- Price per Sq. Ft.: $519.12
- Lot Size: 1.38 acres
- DOM: 45 days
- ClsPr/LstPr: 93.02%
- ClsPr/OLP: 93.02%
- Year Built: 2024
This home epitomized luxury with a 40-ft pool, spa, outdoor kitchen, and multi-generational living spaces. While its sale didn’t reflect market-wide trends due to its unique appeal, it underscored buyer interest in premium amenities when exceptional quality was evident.
Economic context
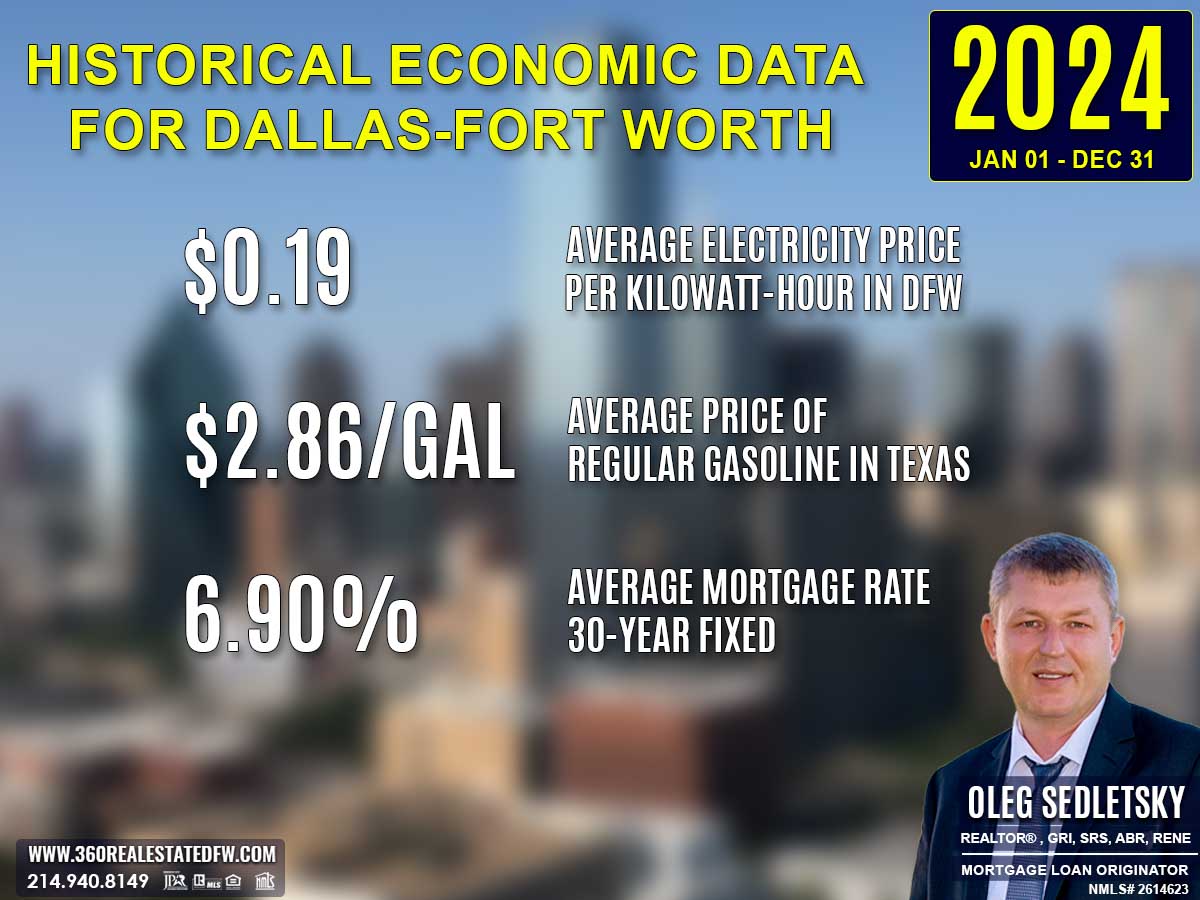
Average Electricity Costs in Dallas-Fort Worth in 2024
Electricity prices rose again to $0.19 per kilowatt-hour in 2024, up from $0.17 in 2023. The steady rise in energy costs underscored the growing value of homes equipped with renewable energy solutions. Energy-conscious designs likely remained a key factor in real estate market trends.
Average Price for Regular Gasoline in Texas in 2024
Gas prices settled slightly lower at $2.86 per gallon in 2024, down from $3.06 in 2023. This decrease, while modest, might have encouraged more exploratory behavior from buyers considering homes in more distant locations. The reduced cost of transportation relieved some financial stress for commuting.
Average 30-Year Fixed Mortgage Rate in 2024
The average 30-year fixed mortgage rate fell marginally to 6.90% in 2024, down from 7.00% in 2023. While still elevated, this slight decline could provide homebuyers with additional opportunities to re-enter the market. Pre-approvals with a local mortgage loan originator remained critical in helping buyers react quickly to evolving financial conditions and maintain a competitive edge.
Curious about today’s mortgage rates and the home you can comfortably afford?
Submit a no-obligation mortgage application today and get pre-approved to determine your budget and take the first step toward homeownership with confidence.
Overview of Differences Between the 2024 and 2023 Real Estate Markets in Celina, Texas
Total Homes Sold
2023: 1,266
2024: 1,280
Home sales increased by 14 units (1.1%), indicating stable market activity despite economic pressures like high mortgage rates.
Number of Homes with Pools
2023: 79
2024: 93
The number of homes sold with pools rose by 14 (17.7%), highlighting increased interest in properties with lifestyle-enhancing features.
Number of New Construction Homes
2023: 720
2024: 760
New construction sales grew by 40 units (5.6%), indicating sustained interest in modern properties and builder-backed incentives.
Average Sales Price
2023: $663,229
2024: $690,070
The average sales price rose by $26,841 (4%), reflecting strong demand and rising value in the residential market.
Average Days on Market (DOM)
2023: 55 days
2024: 60 days
Homes took 5 days longer to sell (9.1%), suggesting that the buying process became slightly slower, likely impacted by higher borrowing costs and buyer caution.
Average Price per Square Foot
2023: $228.62
2024: $231.20
The price per square foot increased by $2.58 (1.1%), signaling a modest appreciation in property value.
Most Expensive Property Sold
2023: $5,000,000 (4 beds, 4,250 sq. ft., $1,176.47 per sq. ft.)
2024: $3,530,000 (6 beds, 6,800 sq. ft., $519.12 per sq. ft.)
The most expensive property sold in 2024 was $1,470,000 less costly, with a lower price per square foot. This shift reflects a more restrained high-end market compared to the unique ultra-luxury property sold in 2023.
Summary of Real Estate Market Analysis for Celina, TX in 2024
The 2024 real estate market in Celina, Texas reflected significant creativity and resilience as buyers and sellers navigated challenges posed by high mortgage rates and shifting market dynamics. Trends such as builder incentives, seller concessions, and innovative financing methods like seller financing and rate buy-downs played a critical role in maintaining robust market activity. The importance of professional guidance and preparation was evident, enabling both buyers and sellers to achieve their goals effectively.
Homebuyers and First-Time Homebuyers Perspective
For homebuyers, especially first-time buyers, 2024 was a year to tread thoughtfully. High mortgage rates underscored the value of being financially prepared, with mortgage pre-approval standing out as an essential first step. Pre-approval not only streamlined the buying process but also demonstrated to sellers that buyers were serious and capable.
Additionally, working with experienced realtors was a major asset for buyers. Realtors provided critical insights into market conditions, financing options, and property values, guiding them toward properties that matched both their needs and budgets. Incentives such as rate buy-downs, assumable mortgages, and flexible builder offers made homeownership more attainable, proving especially beneficial for entry-level buyers.
Home-Sellers Perspective
For home sellers, navigating the 2024 market required strategic decision-making and reliance on expert advice. Home sellers leaned heavily on their realtors for marketing guidance that helped properties stand out. From effective pricing strategies to crafting appealing listings and negotiating favorable terms, realtors played a pivotal role in achieving sellers’ objectives.
The market also urged sellers to adapt by offering concessions, such as covering closing costs or including pre-sale improvements, to attract discerning buyers. Creative solutions, including seller-financed deals, emerged as key strategies to close transactions efficiently. Ultimately, sellers who collaborated closely with knowledgeable real estate agents benefited from targeted approaches that aligned with market demands.
Final Thoughts
Being well-informed and prepared proved crucial for both buyers and sellers in Celina’s evolving real estate landscape. Buyers gained confidence and clarity through mortgage pre-approval and guidance from expert realtors, while sellers relied on their real estate agents’ marketing and negotiation expertise to maximize their opportunities. Realtors’ knowledge and experience were fundamental in navigating the complexities of the market, providing clients with the tools and strategies they needed to succeed.
While high mortgage rates challenged affordability, they also spurred innovative practices such as builder incentives, seller concessions, and alternative financing methods. These trends not only reflected market adaptability but also contributed to a dynamic and opportunity-filled environment. The 2024 market demonstrated the strength of collaboration and strategic decisions, paving the way for continued success in 2025.
Why Historical Statistical Data Matters in the Celina, Texas Real Estate Market
Did you know that Appraisers and Realtors rely on historical statistical data to determine a property’s current value?
The information presented above is just a small glimpse into the wealth of essential data available to help both homebuyers and sellers set realistic expectations and gain an initial understanding of the real estate market in Celina, Texas. Real estate transactions are intricate, and what you see here is merely a sample of the many factors at play in each deal in this city.
Beyond these insights, a comprehensive analysis is available that focuses on specific aspects like zip codes, neighborhoods, and homes within certain school districts in Celina. This granular data dives deeper into market trends, allowing for a precise understanding of local dynamics. Additionally, historical data plays a critical role in crafting informed strategies, providing the context needed to make confident decisions that align with your goals.
Unlock Exceptional Service!
Assistance with all your real estate needs in the Dallas-Fort Worth area is just a click or call away. Reach out at 214-940-8149 or connect through the links below.
Meet Your Trusted Realtor and Mortgage Expert in Celina, Texas!

Greetings! I’m Oleg Sedletsky, and I’m excited to introduce myself as your go-to full-time licensed Texas REALTOR® and Mortgage Loan Originator.
I proudly represent JPAR® – Real Estate Brokerage as a REALTOR® and Utopia Mortgage LLC as a Mortgage Loan Originator! My designations and certifications reflect my dedication to helping you achieve your real estate goals in CELINA, TX and other locations in the vibrant Dallas-Fort Worth area!
Whether you’re a homebuyer or a home seller, the information on this page highlights just a fraction of what’s important to know about the Celina, TX real estate market. Data like this is key to understanding trends, making informed decisions, and achieving your real estate goals.
The good news? I can provide much more. When you choose me as your real estate agent, you’ll gain access to detailed neighborhood analyses, historical trends, and everything you need to make confident decisions. Whether you’re buying your dream home or securing the best deal on a sale, I’ll guide you every step of the way with peace of mind.
I’d love to be your trusted advisor in this exciting journey. With a commitment to ongoing professional development, I’m always improving to serve you better. Plus, I’m fluent in English, Ukrainian, and Russian and ready to help whenever you’re ready.
If you’re looking for a dedicated, experienced professional, contact me today!
It’s All About You and Your Real Estate Goals!
My mission is to serve you! With my knowledge and expertise, I’m here to help you achieve all your real estate goals!
I’m passionate about helping homebuyers and home-sellers navigate the exciting real estate landscape in Celina, Texas! Whether you’re searching for your dream home, exploring land options, or looking for commercial properties, my Real Estate Services have you covered.
Contact me today for all your real estate needs in Celina, Texas! Call/text 214-940-8149

A Comprehensive Analysis of Single-Family Residential Housing Market in Celina, TX: 2010 to Present
Discover the trends, stats, and insights shaping Celina’s real estate market year by year!
2010-2020
Celina, TX Real Estate Market Report 2010: Analysis and Trends
Celina, TX Real Estate Market Report 2011: Analysis and Trends
Celina, TX Real Estate Market Report 2012: Analysis and Trends
Celina, TX Real Estate Market Report 2013: Analysis and Trends
Celina, TX Real Estate Market Report 2014: Analysis and Trends
Celina, TX Real Estate Market Report 2015: Analysis and Trends
Celina, TX Real Estate Market Report 2016: Analysis and Trends
Celina, TX Real Estate Market Report 2017: Analysis and Trends
Celina, TX Real Estate Market Report 2018: Analysis and Trends
Celina, TX Real Estate Market Report 2019: Analysis and Trends
Celina, TX Real Estate Market Report 2020: Analysis and Trends
This market analysis is intended solely for educational purposes. This market analysis is based on data sourced from NTREIS, Inc. This analysis is exclusively focused on single-family homes and does not account for other property types. The total number of real estate transactions within the specified period and location may vary. Data accuracy cannot be guaranteed due to potential input errors made by NTREIS users. This market analysis does not account for all new construction home sales. If you need detailed information about recorded property sales or other public records, please contact the appropriate city or county office.
Celina, TX Real Estate: A Comprehensive Analysis of the 2023 Single-Family Residential Housing Market
The 2023 real estate market in Celina, Texas experienced notable activity, with 1,266 homes sold despite the headwinds of an average 7% mortgage rate. This analysis delves into key trends, pricing shifts, and standout properties, providing an insightful overview of the market’s evolving dynamics.
Key Takeaways and Trends from the 2023 Real Estate Market in Celina, TX
Pricing Range
Homes sold ranged from $100,000 to $5,000,000, showcasing diverse property options. The upper-tier market benefited from unique luxury features, while the lower-tier provided opportunities for first-time buyers.
Market Efficiency
The average close price to listing price ratio of 97.61% indicates that sellers adjusted their expectations to align with buyer affordability in a high-rate environment.
Unique Outliers
The most expensive property sold was a $5,000,000 luxury barndominium on 53 acres, highlighting the value of rare features like large tracts of land and custom amenities.
Mortgage Rate Impact
An average 30-year fixed mortgage rate of 7% introduced affordability challenges for buyers. This led to creative solutions like seller financing, assumable mortgages, and rate buy-downs to keep transactions flowing. Builders also leveraged incentives to draw buyers to new construction homes.
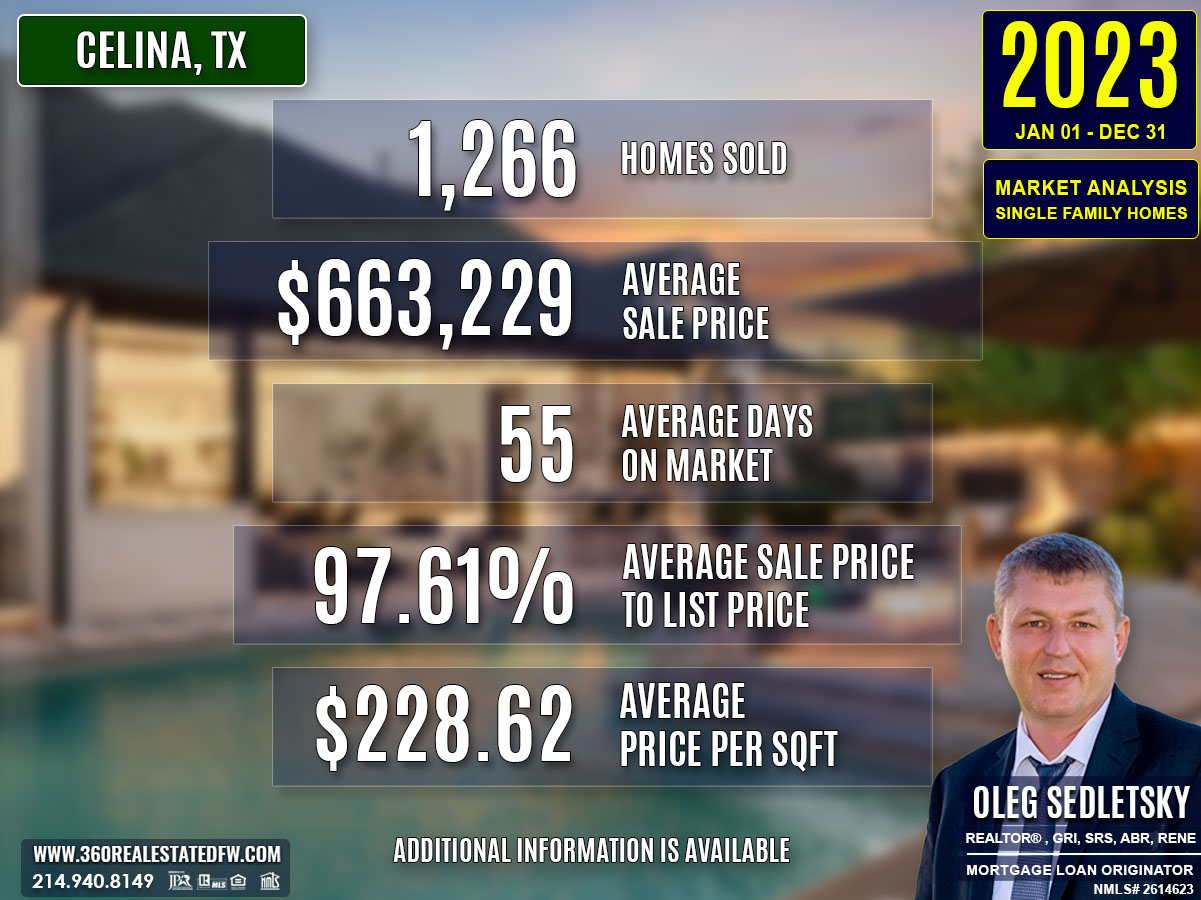
Total Homes Closed
A total of 1,266 homes closed in 2023, a 39.4% increase from the prior year. Of these, new construction homes contributed significantly, with 720 units sold. Additionally, 79 homes with pools were sold, reflecting steady demand for properties with premium amenities.
Property Pricing Insights
- Minimum Price: $100,000
- Maximum Price: $5,000,000
- Average Price: $663,229
- Median Price: $620,298
Although the average price slightly decreased compared to the previous year, this reflects a broader range of transactions and adjustments for affordability among buyers.
Property Size and Features
- Bedrooms: Most homes had 4 bedrooms on average.
- Bathrooms: Typically, 3 bathrooms were included, offering practical layouts for families.
- Square Footage: The average home was 2,909 square feet, with a median size of 2,902 square feet.
- Lot Size: Properties averaged 0.365 acres, with premium homes offering significantly larger lots, like the 53-acre luxury sale.
Market Dynamics
- Days on Market (DOM): Homes stayed on the market for an average of 55 days, highlighting slower absorption rates compared to faster-moving markets in prior years.
- Average ClsPr/LstPr (Close Price to Listing Price): 97.61%, showing slight price negotiation in transactions.
- Average ClsPr/OLP (Close Price to Original Listing Price): 102.86%, suggesting some homes required competitive adjustments to capture buyer interest.
- Average Price per SqFt: $228.62, demonstrating robust pricing for space efficiency.
Insights into the Most Expensive Celina, TX Property Sold in 2023
A custom luxury barndominium valued at $5,000,000 highlighted the highest end of the market. This expansive 53-acre property offered unique features that set it apart, including a stocked lake, RV storage, and extensive land improvements. Its sale underscores the premium placed on specialized amenities in this price bracket.
- Property Details
- Price: $5,000,000
- Beds: 4
- Baths: 4 (3 full, 1 half)
- Square Feet: 4,250
- Price per SqFt: $1,176.47
- Lot Size: 53.8 acres
- DOM: 75 days
- ClsPr/LstPr Ratio: 92.59%
- ClsPr/OLP Ratio: 92.59%
- Year Built: 2021
This property highlighted demand for high-value land and unique builds. However, its longer time on the market and lower close price ratio illustrate how niche such opportunities are in a high-rate environment, where most buyers prioritize affordability over extras.
Economic context
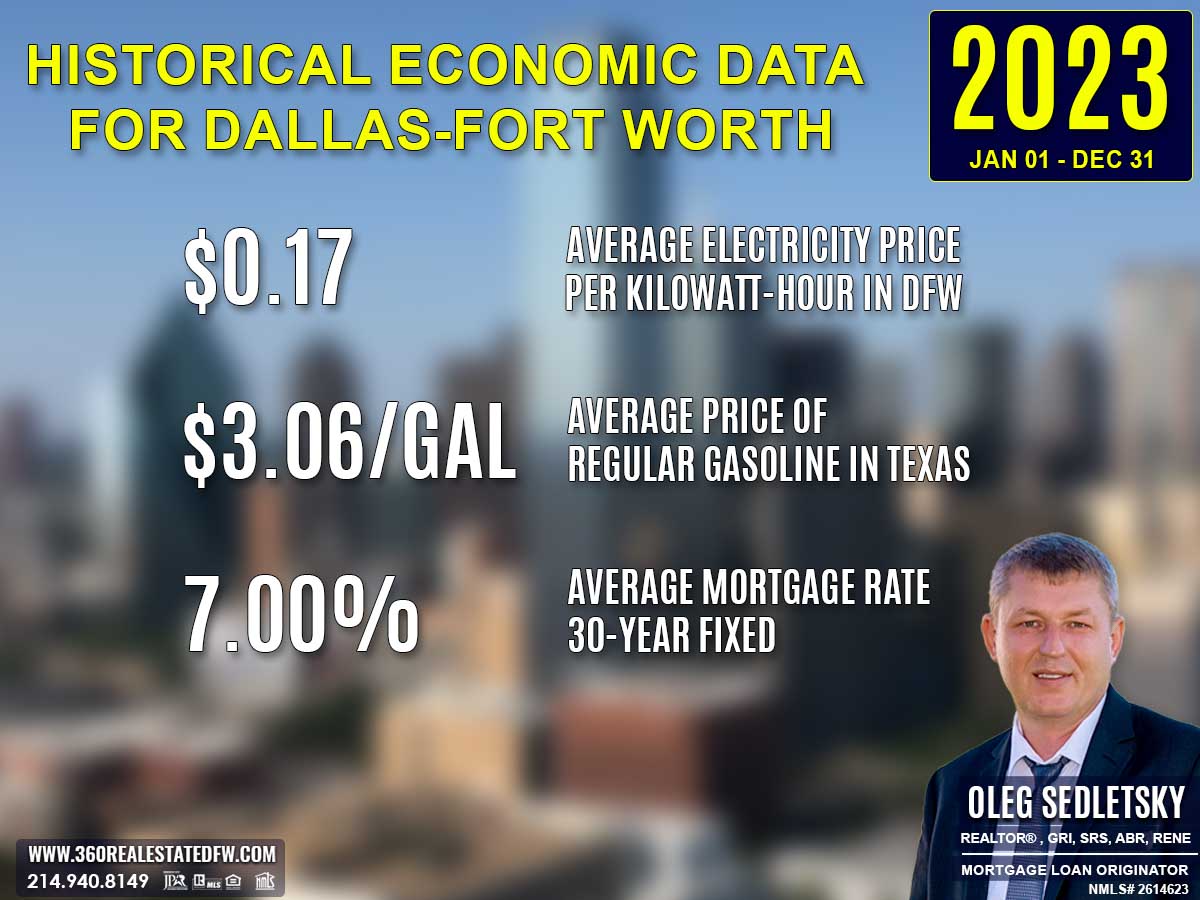
Average Electricity Costs in Dallas-Fort Worth in 2023
Electricity prices dropped slightly to $0.17 per kilowatt-hour in 2023, compared to $0.18 in 2022. While this small decrease provided some relief, energy-efficient homes remained a top priority for homebuyers. Such features offered long-term cost savings that appealed to budget-conscious households.
Average Price for Regular Gasoline in Texas in 2023
Gas prices fell to $3.06 per gallon in 2023, down from $3.47 the previous year. This decline could have renewed interest in suburban properties by making commutes more affordable. homebuyers may have placed higher importance on access to amenities and infrastructure to balance the potential for rising future gas prices.
Average 30-Year Fixed Mortgage Rate in 2023
Mortgage rates increased to 7.00% in 2023, up sharply from 5.53% the prior year. This jump added significant pressure to affordability and homebuyers’ decision-making. Pre-approvals through local mortgage loan originators became essential in helping buyers secure competitive rates and stay within budget during challenging conditions.
Curious about today’s mortgage rates and the home you can comfortably afford?
Submit a no-obligation mortgage application today and get pre-approved to determine your budget and take the first step toward homeownership with confidence.
Overview of Differences Between the 2023 and 2022 Real Estate Markets in Celina, Texas
Total Homes Sold
2022: 908
2023: 1,266
Homes sold increased by 39.4%. The surge reflects growing demand, partly driven by the availability of more new construction homes.
Number of Homes with Pools
2022: 77
2023: 79
Despite broader market adjustments, a modest 2.6% increase in homes with pools suggests steady interest in premium features.
Number of New Construction Homes
2022: 309
2023: 720
New construction homes saw a significant 133% increase, underscoring builder strategies to attract buyers with new inventory and incentives.
Average Sales Price
2022: $687,117
2023: $663,229
The average sales price decreased by 3.5%, indicating that buyers pushed back on pricing amid higher mortgage rates.
Average Days on Market (DOM)
2022: 27 days
2023: 55 days
Homes spent 104% more time on the market, highlighting slower market dynamics as buyers adjusted to higher costs.
Average Price per Square Foot
2022: $241.69
2023: $228.62
The average price per square foot declined by 5.4%, reflecting moderated pricing trends in response to affordability constraints.
Most Expensive Property Sold
2022: $7,000,000
2023: $5,000,000
The most expensive property sold in 2023 was 28.6% lower in value compared to 2022. The 2022 sale was dominated by the value of 37 acres of prime land, while the 2023 sale reflected luxury features across a smaller estate.
Summary of Real Estate Market Analysis for Celina, TX in 2023
The 2023 real estate market in Celina, Texas stood out as a year of adaptation and resilience. With higher mortgage rates averaging 7%, both buyers and sellers had to adjust their approaches. Creative strategies such as builder incentives, seller concessions, rate buy-downs, and seller financing played a critical role in keeping the market active. Despite these challenges, the guidance of experienced realtors ensured smooth transactions, highlighting the importance of informed decision-making in a competitive market.
Homebuyers and First-Time Homebuyers Perspective
For homebuyers, and especially first-time homebuyers, the 2023 market demanded preparation and adaptability. Securing mortgage pre-approval became more critical than ever, allowing buyers to understand their financial limits in a high-rate environment. Realtors played a significant role in navigating complex conditions, offering expert advice on market trends and guiding buyers toward favorable opportunities, including homes with seller financing or rate reductions. First-time buyers particularly benefited from realtors’ insights, which empowered them to make confident purchasing decisions despite the hurdles posed by higher borrowing costs.
Home-Sellers Perspective
Home sellers faced unique challenges in 2023, as higher mortgage rates reduced buyer affordability, often slowing transaction timelines. Many sellers leaned heavily on their realtors for effective marketing strategies and pricing advice. Realtors proved invaluable in showcasing properties to stand out in a crowded market and negotiating terms like closing concessions or assumable mortgages to attract buyers. By partnering with real estate experts, sellers were able to achieve positive outcomes despite the market’s shifting dynamics.
Final Thoughts
The 2023 real estate market in Celina, TX underscored the importance of being well-informed and prepared. Both buyers and sellers benefited from the guidance of experienced realtors who provided the knowledge required to understand market trends and craft tailored strategies. High mortgage rates brought new challenges, but also new solutions—including builder incentives, seller concessions, and creative financing options—that underscored the market’s ability to adapt. Ultimately, the collaboration between buyers, sellers, and skilled realtors allowed for successful outcomes, turning a challenging year into a period of opportunity for those ready to seize it.
Why Historical Statistical Data Matters in the Celina, Texas Real Estate Market
Did you know that Appraisers and Realtors rely on historical statistical data to determine a property’s current value?
The information presented above is just a small glimpse into the wealth of essential data available to help both homebuyers and sellers set realistic expectations and gain an initial understanding of the real estate market in Celina, Texas. Real estate transactions are intricate, and what you see here is merely a sample of the many factors at play in each deal in this city.
Beyond these insights, a comprehensive analysis is available that focuses on specific aspects like zip codes, neighborhoods, and homes within certain school districts in Celina. This granular data dives deeper into market trends, allowing for a precise understanding of local dynamics. Additionally, historical data plays a critical role in crafting informed strategies, providing the context needed to make confident decisions that align with your goals.
Unlock Exceptional Service!
Assistance with all your real estate needs in the Dallas-Fort Worth area is just a click or call away. Reach out at 214-940-8149 or connect through the links below.
Meet Your Trusted Realtor and Mortgage Expert in Celina, Texas!
Greetings! I’m Oleg Sedletsky, and I’m excited to introduce myself as your go-to full-time licensed Texas REALTOR® and Mortgage Loan Originator.
I proudly represent JPAR® – Real Estate Brokerage as a REALTOR® and Utopia Mortgage LLC as a Mortgage Loan Originator! My designations and certifications reflect my dedication to helping you achieve your real estate goals in CELINA, TX and other locations in the vibrant Dallas-Fort Worth area!
Whether you’re a homebuyer or a home seller, the information on this page highlights just a fraction of what’s important to know about the Celina, TX real estate market. Data like this is key to understanding trends, making informed decisions, and achieving your real estate goals.
The good news? I can provide much more. When you choose me as your real estate agent, you’ll gain access to detailed neighborhood analyses, historical trends, and everything you need to make confident decisions. Whether you’re buying your dream home or securing the best deal on a sale, I’ll guide you every step of the way with peace of mind.
I’d love to be your trusted advisor in this exciting journey. With a commitment to ongoing professional development, I’m always improving to serve you better. Plus, I’m fluent in English, Ukrainian, and Russian and ready to help whenever you’re ready.
If you’re looking for a dedicated, experienced professional, contact me today!
It’s All About You and Your Real Estate Goals!
My mission is to serve you! With my knowledge and expertise, I’m here to help you achieve all your real estate goals!
I’m passionate about helping homebuyers and home-sellers navigate the exciting real estate landscape in Celina, Texas! Whether you’re searching for your dream home, exploring land options, or looking for commercial properties, my Real Estate Services have you covered.
Contact me today for all your real estate needs in Celina, Texas! Call/text 214-940-8149
A Comprehensive Analysis of Single-Family Residential Housing Market in Celina, TX: 2010 to Present
Discover the trends, stats, and insights shaping Celina’s real estate market year by year!
2010-2020
Celina, TX Real Estate Market Report 2010: Analysis and Trends
Celina, TX Real Estate Market Report 2011: Analysis and Trends
Celina, TX Real Estate Market Report 2012: Analysis and Trends
Celina, TX Real Estate Market Report 2013: Analysis and Trends
Celina, TX Real Estate Market Report 2014: Analysis and Trends
Celina, TX Real Estate Market Report 2015: Analysis and Trends
Celina, TX Real Estate Market Report 2016: Analysis and Trends
Celina, TX Real Estate Market Report 2017: Analysis and Trends
Celina, TX Real Estate Market Report 2018: Analysis and Trends
Celina, TX Real Estate Market Report 2019: Analysis and Trends
Celina, TX Real Estate Market Report 2020: Analysis and Trends
This market analysis is intended solely for educational purposes. This market analysis is based on data sourced from NTREIS, Inc. This analysis is exclusively focused on single-family homes and does not account for other property types. The total number of real estate transactions within the specified period and location may vary. Data accuracy cannot be guaranteed due to potential input errors made by NTREIS users. This market analysis does not account for all new construction home sales. If you need detailed information about recorded property sales or other public records, please contact the appropriate city or county office.