

Celina, TX Real Estate: A Comprehensive Analysis of the 2012 Single-Family Residential Housing Market
The 2012 real estate market in Celina, TX demonstrated a noticeable upward shift in overall activity, characterized by higher transaction volumes and slight growth in pricing metrics. Building on momentum from previous years, the market balanced buyer opportunities and seller potential, all while being influenced by historically low mortgage rates. This analysis provides a comprehensive breakdown of the year’s performance, detailing key figures, trends, and the unique aspects of the market.
Key Takeaways and Trends from the 2012 Real Estate Market in Celina, TX
1. Pricing Range
The year saw an increased number of sales in the middle and upper-mid price ranges, while maintaining affordability for many homebuyers. However, the most expensive property sold came at a price well below the luxury benchmark set in 2010, signaling some changes at the high-end market tier.
2. Market Efficiency
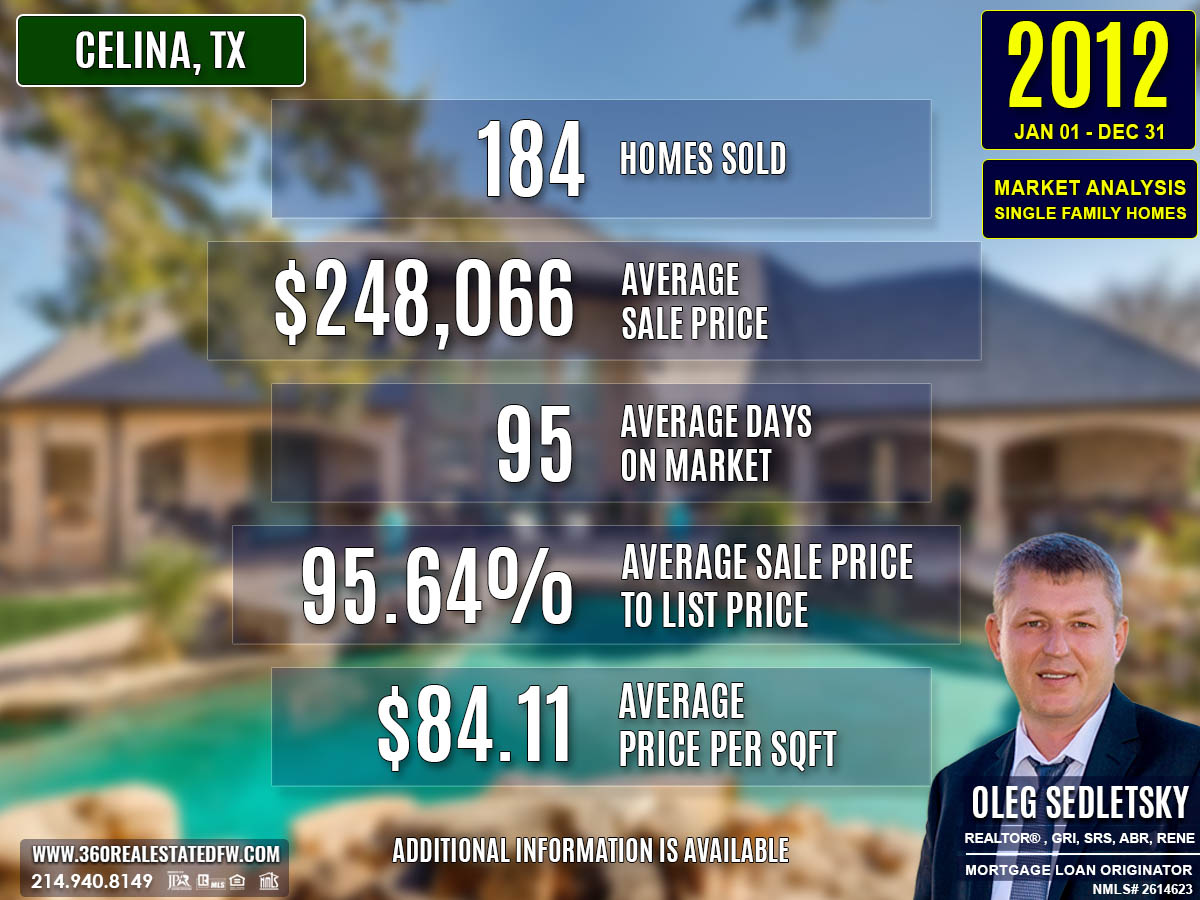
With an average close price to listing price ratio of 95.64%, the market maintained solid but slightly improving competitive conditions, highlighting reasonable flexibility in buyer and seller negotiations.
3. Unique Outliers
Properties like the most expensive custom home with a guest house and stocked pond added character to the market, reflecting the diverse range of options available to buyers, from high-priced luxury to modest, functional homes.
4. Mortgage Rates Impact
The average 30-year fixed mortgage rate dropped to 3.88%, a significant decline that likely boosted affordability. This change probably contributed to the substantial increase in transactions and new construction homes, as borrowers took advantage of lower costs.
Total Homes Closed
A total of 184 homes were sold over the year, marking a significant leap from the 145 sold in 2011. The market also saw considerable activity in specific subcategories:
- New Construction Homes accounted for 60 of the sales, showing a 22% increase compared to 2011.
- Homes with Pools represented 25 sales, up from 16 in the prior year, reflecting increased demand for lifestyle-focused amenities.
Property Pricing Insights
- Minimum Price: $30,000
- Maximum Price: $1,195,000
- Average Price: $248,066
- Median Price: $213,495
While the average and median prices rose compared to 2011, the maximum price was significantly lower than the peak four years prior, continuing the trend of softened ultra-luxury transactions.
Property Size and Features
- Bedrooms ranged from 1 to 6, with an average of 4.
- Bathrooms varied from 1 to 6, with an average of 3.
- Square Footage spanned from 720 sq. ft. to 7,228 sq. ft., with an average of 2,810 sq. ft.
- Lot Size ranged from 0.000 acres to 30.100 acres, averaging 1.660 acres.
Celina’s available inventory in 2012 remained diverse, suitable for various buyer needs, from compact starter homes to spacious estates.
Market Dynamics
The following market trends characterized 2012 dynamics:
- Days on Market (DOM) averaged 95 days, a slight improvement from the previous year.
- ClsPr/LstPr (Close Price to Listing Price Ratio): 95.64%, indicating stable market negotiations.
- ClsPr/OLP (Close Price to Original Listing Price Ratio): 91.62%, reflecting realistic pricing adjustments over time.
- Average Price per Square Foot was $84.11, up from $78.60 in 2011, signaling slight appreciation.
Insights into the Most Expensive Celina, TX Property Sold in 2012
A stunning, custom-built estate in Celina sold for $1,195,000 in 2012. This property epitomized luxury living, complete with private amenities and ample space for family or multi-generational living.
- Price: $1,195,000
- Beds/Baths: 4 beds, 6 baths (5 full, 1 half)
- Square Footage: 7,228 sq. ft.
- Price per Square Foot: $165.33
- Lot Size: 3.45 acres
- Days on Market: 119 days
- ClsPr/LstPr Ratio: 100%
- ClsPr/OLP Ratio: 95.60%
- Year Built: 2003
This estate featured a pool with a spa and waterfall, a stocked pond, and multi-generational guest quarters, all contributing to its appeal in the high-end segment. However, the property’s lower price per square foot compared to previous top sales suggests moderated valuation for expansive luxury homes.
The sale of this high-end property highlighted that while buyers were still pursuing upscale homes, they demanded properties with substantial value relative to price. This trend towards practical luxury, rather than extravagant pricing, introduced a new dynamic in Celina’s market.
Economic context
Average Electricity Costs in Dallas-Fort Worth in 2012
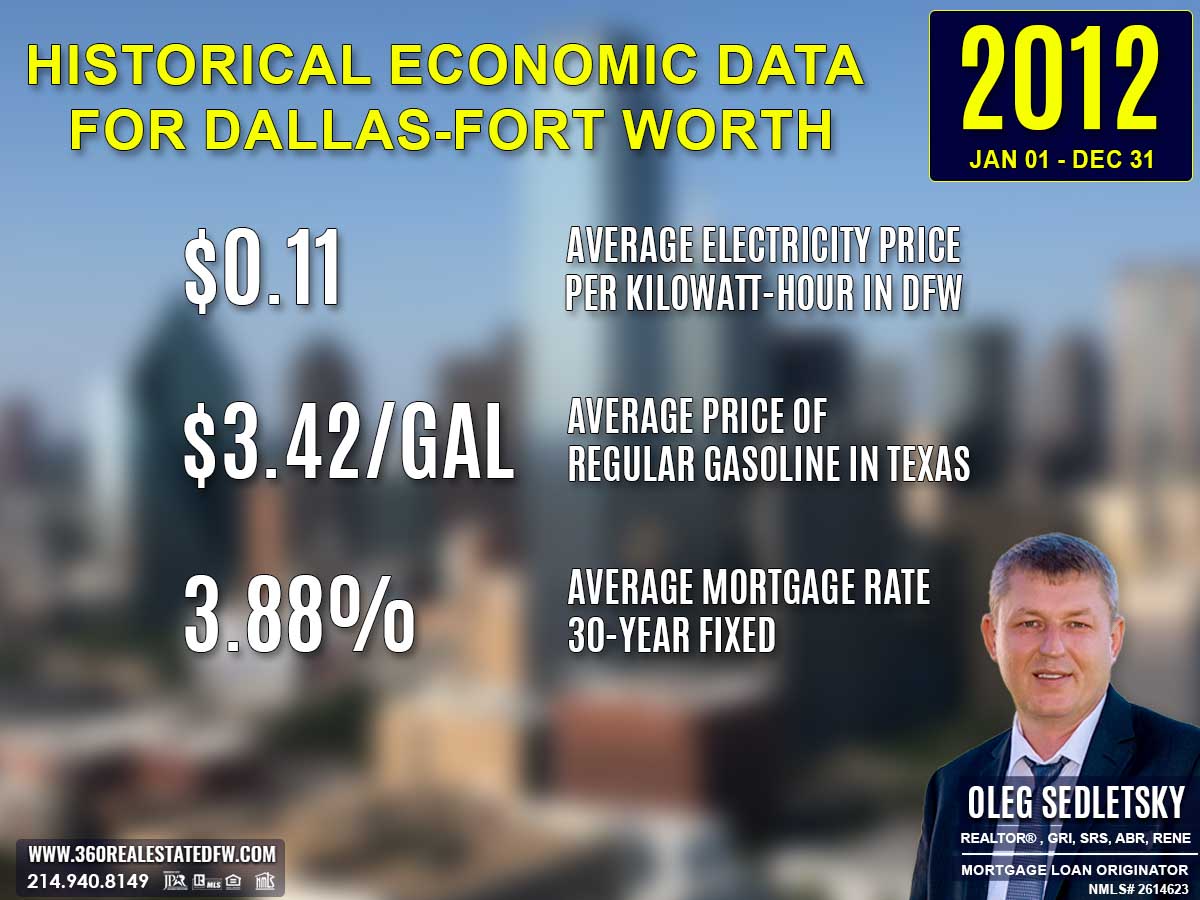
Electricity prices remained steady at $0.11 per kilowatt-hour in 2012, unchanged from 2011. This stability helped maintain predictability in household budgets, supporting steady investment in real estate. homebuyers could better evaluate prospective homes based on fixed utility costs, encouraging confident decision-making.
Average Price for Regular Gasoline in Texas in 2012
Gas prices rose slightly to $3.42 per gallon in 2012, up from $3.37 in 2011. homebuyers continued to prioritize location and proximity to public transit or work, as elevated gas prices increased commuting expenses. Properties in walkable neighborhoods likely gained more attention during this period.
Average 30-Year Fixed Mortgage Rate in 2012
Mortgage rates dropped significantly to 3.88% in 2012, down from 4.65% the previous year. This marked a historic low that spurred homebuyer activity, particularly for those locking in long-term affordability. Pre-approvals through local mortgage loan originators became an invaluable step in maximizing homebuyer advantages amidst this rate decline.
Curious about today’s mortgage rates and the home you can comfortably afford?
Submit a no-obligation mortgage application today and get pre-approved to determine your budget and take the first step toward homeownership with confidence.
Overview of Differences Between the 2012 and 2011 Real Estate Markets in Celina, Texas
Total Homes Sold
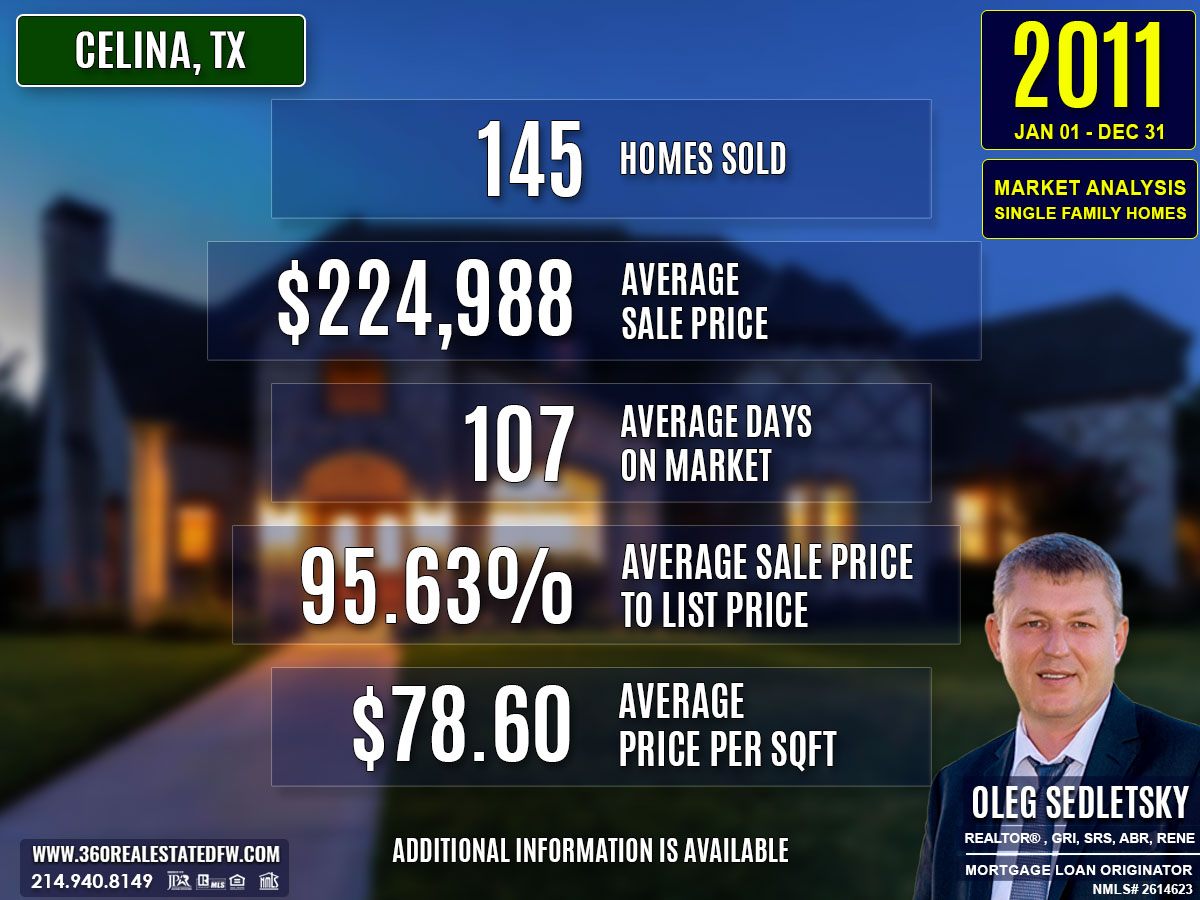
2011: 145 homes closed.
2012: 184 homes closed, representing a 27% increase in transaction volume.
Average Sales Price
2011: $224,988.
2012: $248,066, reflecting a 10% rise in average sales price.
Average Days on Market (DOM)
2011: 107 days.
2012: 95 days, marking a faster pace with properties selling 12 days quicker on average.
Close Price to Listing Price Ratio (ClsPr/LstPr)
2011: 95.63%.
2012: 95.64%, remaining consistent and indicative of stable market dynamics.
Average Price per Square Foot
2011: $78.60.
2012: $84.11, showing a 7% increase, suggesting property appreciation.
Homes with Pools
2011: 16 homes had pools.
2012: 25 homes had pools, a notable 56% rise in demand for lifestyle-focused amenities.
New Construction Homes
2011: 49 new homes.
2012: 60 new homes, an increase of 22%, highlighting growth in new builds.
Most Expensive Property Sold
2011: A lakefront custom home on 20 acres sold for $850,000, with 4,421 sq. ft. and $192.26/sq. ft.
2012: A custom home on 3.45 acres sold for $1,195,000, with 7,228 sq. ft. and $165.33/sq. ft. Despite the higher total price, the price per square foot decreased, indicating value in larger luxury properties.
Notable Trends and Shifts
- The market in 2012 showed clear growth with significant increases in transactions and pricing metrics.
- The faster sales pace and higher close price to listing price ratios reflected a competitive market.
- Luxury properties aligned more with practical value, as shown by the changing price per square foot in high-end sales.
- Increased preference for homes with pools and new builds highlighted evolving buyer priorities.
Summary of Real Estate Market Analysis for Celina, TX in 2012
The 2012 real estate market in Celina, Texas exhibited a thriving landscape marked by an increased number of homes sold, heightened buyer activity, and a broad range of property options. With historically low mortgage rates driving demand, the market provided opportunities for a diverse group of buyers and sellers.
Homebuyers and First-Time Homebuyers Perspective
For homebuyers, especially first-time buyers, 2012 proved to be a favorable year due to low mortgage rates, which enhanced affordability. However, in such a competitive market, securing mortgage pre-approval became a non-negotiable step. This not only gave buyers a clear understanding of their budget but also solidified their position as serious contenders in the eyes of sellers. Guided by experienced realtors, buyers benefited from professional insights on pricing, property trends, and negotiation strategies. For first-time homebuyers, the support of knowledgeable agents was especially crucial in navigating a fast-paced market and making informed decisions.
Home-Sellers Perspective
Home Sellers in 2012 enjoyed the advantage of an active market, with more transactions and buyer interest than in previous years. However, the role of realtors was invaluable in helping sellers distinguish their properties amidst growing inventory. From effective pricing strategies to innovative marketing efforts and expert advice, realtors ensured homes were positioned to attract the right buyers. Particularly for homes with pools or new construction properties, thoughtful marketing highlighted these sought-after features.
Final Thoughts
The 2012 real estate market in Celina, TX highlighted the importance of preparation and collaboration for success. Homebuyers and sellers who worked closely with realtors gained a competitive edge thanks to invaluable guidance on market conditions and transaction processes. For buyers, pre-approval acted as a critical step in securing the most appealing properties. Sellers benefited from a pricing and marketing strategy crafted by industry experts.
Ultimately, being prepared and informed was key to thriving in Celina’s diverse and evolving market.
Why Historical Statistical Data Matters in the Celina, Texas Real Estate Market
Did you know that Appraisers and Realtors rely on historical statistical data to determine a property’s current value?
The information presented above is just a small glimpse into the wealth of essential data available to help both homebuyers and sellers set realistic expectations and gain an initial understanding of the real estate market in Celina, Texas. Real estate transactions are intricate, and what you see here is merely a sample of the many factors at play in each deal in this city.
Beyond these insights, a comprehensive analysis is available that focuses on specific aspects like zip codes, neighborhoods, and homes within certain school districts in Celina. This granular data dives deeper into market trends, allowing for a precise understanding of local dynamics. Additionally, historical data plays a critical role in crafting informed strategies, providing the context needed to make confident decisions that align with your goals.
Unlock Exceptional Service!
Assistance with all your real estate needs in the Dallas-Fort Worth area is just a click or call away. Reach out at 214-940-8149 or connect through the links below.
Meet Your Trusted Realtor and Mortgage Expert in Celina, Texas!

Greetings! I’m Oleg Sedletsky, and I’m excited to introduce myself as your go-to full-time licensed Texas REALTOR® and Mortgage Loan Originator.
I proudly represent JPAR® – Real Estate Brokerage as a REALTOR® and Utopia Mortgage LLC as a Mortgage Loan Originator! My designations and certifications reflect my dedication to helping you achieve your real estate goals in CELINA, TX and other locations in the vibrant Dallas-Fort Worth area!
Whether you’re a homebuyer or a home seller, the information on this page highlights just a fraction of what’s important to know about the Celina, TX real estate market. Data like this is key to understanding trends, making informed decisions, and achieving your real estate goals.
The good news? I can provide much more. When you choose me as your real estate agent, you’ll gain access to detailed neighborhood analyses, historical trends, and everything you need to make confident decisions. Whether you’re buying your dream home or securing the best deal on a sale, I’ll guide you every step of the way with peace of mind.
I’d love to be your trusted advisor in this exciting journey. With a commitment to ongoing professional development, I’m always improving to serve you better. Plus, I’m fluent in English, Ukrainian, and Russian and ready to help whenever you’re ready.
If you’re looking for a dedicated, experienced professional, contact me today!
It’s All About You and Your Real Estate Goals!
My mission is to serve you! With my knowledge and expertise, I’m here to help you achieve all your real estate goals!
I’m passionate about helping homebuyers and home-sellers navigate the exciting real estate landscape in Celina, Texas! Whether you’re searching for your dream home, exploring land options, or looking for commercial properties, my Real Estate Services have you covered.
Contact me today for all your real estate needs in Celina, Texas! Call/text 214-940-8149

A Comprehensive Analysis of Single-Family Residential Housing Market in Celina, TX: 2010 to Present
Discover the trends, stats, and insights shaping Celina’s real estate market year by year!
2010-2020
Celina, TX Real Estate Market Report 2010: Analysis and Trends
Celina, TX Real Estate Market Report 2011: Analysis and Trends
Celina, TX Real Estate Market Report 2012: Analysis and Trends
Celina, TX Real Estate Market Report 2013: Analysis and Trends
Celina, TX Real Estate Market Report 2014: Analysis and Trends
Celina, TX Real Estate Market Report 2015: Analysis and Trends
Celina, TX Real Estate Market Report 2016: Analysis and Trends
Celina, TX Real Estate Market Report 2017: Analysis and Trends
Celina, TX Real Estate Market Report 2018: Analysis and Trends
Celina, TX Real Estate Market Report 2019: Analysis and Trends
Celina, TX Real Estate Market Report 2020: Analysis and Trends
This market analysis is intended solely for educational purposes. This market analysis is based on data sourced from NTREIS, Inc. This analysis is exclusively focused on single-family homes and does not account for other property types. The total number of real estate transactions within the specified period and location may vary. Data accuracy cannot be guaranteed due to potential input errors made by NTREIS users. This market analysis does not account for all new construction home sales. If you need detailed information about recorded property sales or other public records, please contact the appropriate city or county office.
Celina, TX Real Estate: A Comprehensive Analysis of the 2011 Single-Family Residential Housing Market
The 2011 real estate market in Celina, Texas, demonstrated steady activity and offered diverse options for homebuyers. This analysis examines market performance, buyer and seller dynamics, and economic influences shaping the year’s transactions. Key trends such as pricing ranges, market efficiencies, and the impact of interest rates are explored to provide a comprehensive view of residential single-family home sales.
Key Takeaways and Trends from the 2011 Real Estate Market in Celina, TX
1. Pricing Range
Sale prices ranged from $33,500 to $850,000, catering to both budget-conscious buyers and those seeking premium estates. The average price of $224,988 and the median price of $192,500 reveal a balanced market slightly skewed by higher-end home sales.
2. Market Efficiency
The market remained efficient, with homes generally selling at 95.63% of their listing price on average. The median close-price-to-list-price ratio of 97.00% showcases minimal buyer-seller negotiation gaps.
3. Unique Outliers
A lakefront country estate, sold for $850,000, stood out as the year’s most expensive property. Its oversized lot, premium lakefront features, and custom design indicate a niche demand for luxury and exclusivity in Celina, TX.
4. Mortgage Rates Impact
With the average 30-year fixed mortgage rate at 4.65%, buyers benefited from slightly reduced borrowing costs compared to 2010, further boosting purchasing power. This lower rate likely contributed to sustained interest in new and resale markets.
Total Homes Closed
A total of 145 homes sold in 2011, representing a 12% increase over the previous year’s figure of 130. Within this cohort:
- 16 homes featured pools, meeting the demand for amenity-rich properties.
- 49 new construction homes highlighted growing interest in modern, updated homes within the city.
Property Pricing Insights
- Minimum Sale Price: $33,500
- Maximum Sale Price: $850,000
- Average Sale Price: $224,988
- Median Sale Price: $192,500
The range of pricing allowed buyers with varying budgets to find opportunities. The average and median prices suggest a moderately priced market, although luxury properties, such as the most expensive estate, slightly elevated the averages.
Property Size and Features
- Bedrooms: Most homes featured 4 bedrooms, with a range of 1–5 across the dataset.
- Bathrooms: The average home offered 3 bathrooms, with a maximum of 6 (5 full, 1 half).
- Square Footage: Total square footage varied from 711 to a spacious 5,463, with an average home size of 2,746 sq. ft.
- Lot Size Area: Average lot size was 1.44 acres, but the median lot size of 0.29 acres suggests smaller lots were more common. Larger estates, particularly outliers, inflated the averages.
Market Dynamics
- Days on Market (DOM): Average DOM increased to 107 days, slightly longer than in 2010, though many homes still sold relatively quickly. DOM ranged from a minimum of 2 days to a maximum of 536.
- Close Price to Listing Price Ratio (ClsPr/LstPr): Averaged 95.63%, with a median ratio of 97.00%, reflecting sellers’ realistic pricing strategies.
- Close Price to Original Listing Price Ratio (ClsPr/OLP): Averaged 90.65%, indicating some additional discounting relative to original list prices.
- Average Price per SqFt: Settled at $78.60, offering competitive value compared to more expensive regions.
Although the market required slightly more time to absorb properties, pricing stability remained a positive attribute throughout 2011.
Insights into the Most Expensive Celina, TX Property Sold in 2011
The year’s highest-recorded sale was a lakefront country estate that showcased exceptional appeal through its mix of natural beauty and custom design.
- Price: $850,000
- Beds: 4
- Baths: 5 (4 full, 1 half)
- Square Footage: 4,421 sq. ft.
- Price per SqFt: $192.26
- Lot Size: 20.19 acres
- DOM: 12 days
- ClsPr/LstPr: 114.48%
- ClsPr/OLP: 114.48%
- Year Built: 2007
This estate offered 1,000 feet of lake frontage, native trees, rolling hills, and a 30×30 metal barn or workshop. Its quick sale within just 12 days and over-asking price highlight the demand for unique and high-value properties. This outlier sale slightly boosted the high-end pricing averages and demonstrated the appeal of custom, lifestyle-focused estates in Celina. Its short DOM further suggests that highly desirable properties can move quickly, even in a balanced market.
Economic context

Average Electricity Costs in Dallas-Fort Worth in 2011
Electricity prices dipped again to $0.11 per kilowatt-hour in 2011, down from $0.12 in 2010. This slight drop continued to help households manage their budgets with more flexibility for discretionary spending or home-related investments. The lower cost of utilities could boost the appeal of larger homes that might otherwise consume more electricity.
Average Price for Regular Gasoline in Texas in 2011
Gas prices rose noticeably to $3.37 per gallon in 2011, up from $2.64 in 2010. The steep increase likely caused homebuyers to favor properties closer to work or transit hubs. homebuyers in suburban or rural areas likely faced greater challenges due to higher commuting costs.
Average 30-Year Fixed Mortgage Rate in 2011
Mortgage rates dropped further to 4.65% in 2011 from 4.86% in the prior year. This ongoing trend of declining rates supported affordability and encouraged activity among homebuyers. First-time buyers were reminded to get pre-approved through local mortgage loan originators to better understand their purchasing power.
Curious about today’s mortgage rates and the home you can comfortably afford?
Submit a no-obligation mortgage application today and get pre-approved to determine your budget and take the first step toward homeownership with confidence.
Overview of Differences Between the 2011 and 2010 Real Estate Markets in Celina, Texas
Total Homes Sold
2010: 130 homes closed.
2011: 145 homes closed, showing a 12% increase in transaction volume.
Average Sales Price
2010: $240,127.
2011: $224,988, reflecting a slight decline in average prices, which may indicate increased affordability.
Average Days on Market (DOM)
2010: 94 days.
2011: 107 days, signaling a modest increase in listing duration.
Close Price to Listing Price Ratio (ClsPr/LstPr)
2010: 96.54%.
2011: 95.63%, a minimal drop indicating slightly less competitive market dynamics for sellers.
Average Price per Square Foot
2010: $80.45.
2011: $78.60, showing a small decline, consistent with the lower average sale prices.
Homes with Pools
2010: 17 homes featured pools.
2011: 16 homes featured pools, a negligible difference.
New Construction Homes
2010: 29 new construction homes.
2011: 49 new construction homes, marking a notable 69% increase, possibly signaling builder confidence in demand.
Most Expensive Property Sold
2010: A 9,200 sq. ft. custom home with a pool, 7-car garage, and multi-generational features sold for $2,150,000 at $233.70 per sq. ft.
2011: A 4,421 sq. ft. lakefront estate with 20 acres of land sold for $850,000 at $192.26 per sq. ft., showing a significant drop in the top-end property value.
Notable Trends and Shifts
- Volume Increase: The higher number of homes sold in 2011 indicates increased activity in the market, even amid slightly declining averages for pricing and price per square foot.
- Affordability: Both the average sales price and price per square foot fell slightly from 2010 to 2011, which could have drawn more buyers into the market.
- New Construction Surge: The sharp uptick in new construction homes emphasized builders’ confidence in 2011, catering to buyer demand with modern options.
- Luxury Shift: The highest-priced property sold in 2011 was significantly lower in both price and size compared to 2010, suggesting a reduced emphasis on ultra-luxury transactions.
Summary of Real Estate Market Analysis for Celina, TX in 2011
The 2011 real estate market in Celina, TX reflected a year of steady activity, balancing affordability with opportunities for high-end purchases. With 145 closed sales and a median sales price of $192,500, the market demonstrated resilience and accessibility for diverse buyers and sellers.
Homebuyers and First-Time Homebuyers Perspective
For homebuyers, especially first-time buyers, 2011 presented strong opportunities to enter the market. Competitive home prices, coupled with a favorable average mortgage rate of 4.65%, boosted affordability. However, securing mortgage pre-approval became a crucial, non-negotiable step in gaining an edge in the home-buying process. Pre-approval signaled to sellers that buyers were serious and financially ready, which often helped their offers stand out in a competitive environment. Additionally, working with experienced realtors proved invaluable for homebuyers. Realtors provided expert guidance on pricing trends, negotiation strategies, and property selection, ensuring buyers were well-informed and confident in their decisions.
Home-Sellers Perspective
For home sellers, navigating the 2011 market required strategic pricing and marketing. On average, properties spent 107 days on the market, emphasizing the importance of effective marketing to attract buyers. Home-sellers relied heavily on the expertise of realtors to determine competitive pricing and promote listings to the right audience. Sellers who followed their realtor’s advice often achieved strong results, as seen in the market’s average close price-to-list price ratio of 95.63%. Even in the case of unique, high-end properties, such as the year’s most expensive home, strategic marketing played a key role in securing quick and impressive sales.
Final Thoughts
The 2011 real estate market in Celina, Texas showcased the benefits of preparation and expertise for everyone involved. Buyers who were proactive in obtaining mortgage pre-approval and worked collaboratively with realtors gained significant advantages. Sellers, too, benefited from relying on their realtor’s guidance and marketing efforts, ensuring their properties were strategically positioned for success. Ultimately, the market rewarded informed participants; buyers and sellers who understood trends, respected the value of preparation, and partnered with professionals found themselves in a stronger position. The year set a standard for balanced growth in Celina, signaling positive potential for the future of its real estate market.
Why Historical Statistical Data Matters in the Celina, Texas Real Estate Market
Did you know that Appraisers and Realtors rely on historical statistical data to determine a property’s current value?
The information presented above is just a small glimpse into the wealth of essential data available to help both homebuyers and sellers set realistic expectations and gain an initial understanding of the real estate market in Celina, Texas. Real estate transactions are intricate, and what you see here is merely a sample of the many factors at play in each deal in this city.
Beyond these insights, a comprehensive analysis is available that focuses on specific aspects like zip codes, neighborhoods, and homes within certain school districts in Celina. This granular data dives deeper into market trends, allowing for a precise understanding of local dynamics. Additionally, historical data plays a critical role in crafting informed strategies, providing the context needed to make confident decisions that align with your goals.
Unlock Exceptional Service!
Assistance with all your real estate needs in the Dallas-Fort Worth area is just a click or call away. Reach out at 214-940-8149 or connect through the links below.
Meet Your Trusted Realtor and Mortgage Expert in Celina, Texas!
Greetings! I’m Oleg Sedletsky, and I’m excited to introduce myself as your go-to full-time licensed Texas REALTOR® and Mortgage Loan Originator.
I proudly represent JPAR® – Real Estate Brokerage as a REALTOR® and Utopia Mortgage LLC as a Mortgage Loan Originator! My designations and certifications reflect my dedication to helping you achieve your real estate goals in CELINA, TX and other locations in the vibrant Dallas-Fort Worth area!
Whether you’re a homebuyer or a home seller, the information on this page highlights just a fraction of what’s important to know about the Celina, TX real estate market. Data like this is key to understanding trends, making informed decisions, and achieving your real estate goals.
The good news? I can provide much more. When you choose me as your real estate agent, you’ll gain access to detailed neighborhood analyses, historical trends, and everything you need to make confident decisions. Whether you’re buying your dream home or securing the best deal on a sale, I’ll guide you every step of the way with peace of mind.
I’d love to be your trusted advisor in this exciting journey. With a commitment to ongoing professional development, I’m always improving to serve you better. Plus, I’m fluent in English, Ukrainian, and Russian and ready to help whenever you’re ready.
If you’re looking for a dedicated, experienced professional, contact me today!
It’s All About You and Your Real Estate Goals!
My mission is to serve you! With my knowledge and expertise, I’m here to help you achieve all your real estate goals!
I’m passionate about helping homebuyers and home-sellers navigate the exciting real estate landscape in Celina, Texas! Whether you’re searching for your dream home, exploring land options, or looking for commercial properties, my Real Estate Services have you covered.
Contact me today for all your real estate needs in Celina, Texas! Call/text 214-940-8149
A Comprehensive Analysis of Single-Family Residential Housing Market in Celina, TX: 2010 to Present
Discover the trends, stats, and insights shaping Celina’s real estate market year by year!
2010-2020
Celina, TX Real Estate Market Report 2010: Analysis and Trends
Celina, TX Real Estate Market Report 2011: Analysis and Trends
Celina, TX Real Estate Market Report 2012: Analysis and Trends
Celina, TX Real Estate Market Report 2013: Analysis and Trends
Celina, TX Real Estate Market Report 2014: Analysis and Trends
Celina, TX Real Estate Market Report 2015: Analysis and Trends
Celina, TX Real Estate Market Report 2016: Analysis and Trends
Celina, TX Real Estate Market Report 2017: Analysis and Trends
Celina, TX Real Estate Market Report 2018: Analysis and Trends
Celina, TX Real Estate Market Report 2019: Analysis and Trends
Celina, TX Real Estate Market Report 2020: Analysis and Trends
This market analysis is intended solely for educational purposes. This market analysis is based on data sourced from NTREIS, Inc. This analysis is exclusively focused on single-family homes and does not account for other property types. The total number of real estate transactions within the specified period and location may vary. Data accuracy cannot be guaranteed due to potential input errors made by NTREIS users. This market analysis does not account for all new construction home sales. If you need detailed information about recorded property sales or other public records, please contact the appropriate city or county office.
Celina, TX Real Estate: A Comprehensive Analysis of the 2010 Single-Family Residential Housing Market
The 2010 real estate market in Celina, Texas showcased a variety of residential single-family home sales, reflecting a combination of established and new construction properties. This analysis explores key metrics, market dynamics, and notable trends within the city, providing a comprehensive view into market performance during the year.
Key Takeaways and Trends from the 2010 Real Estate Market in Celina, TX
1. Pricing Range
Residential home sale prices ranged widely, from $30,000 to an impressive $2,150,000. The average property price settled at $240,127, with a median price slightly lower at $198,384, suggesting the presence of both affordable options and opulent estates.
2. Market Efficiency
The market demonstrated relatively strong pricing stability, with average close price-to-list price ratios (ClsPr/LstPr) of 96.54% and a median ratio of 97.06%. Homes typically took about 94 days on average to sell, showing a balance of supply and demand.
3. Unique Outliers
An extraordinary property sale at $2,150,000 significantly exceeded the average price. This custom-built estate featured lavish amenities like seven garages, three laundry rooms, and multi-generational accommodations. Such high-end sales likely skewed pricing averages upward.
4. Mortgage Rates Impact
The average 30-year fixed mortgage rate in 2010 was 4.86%, providing buyers with relatively low borrowing costs. This likely supported higher demand, even as economic headwinds prevailed due to broader market conditions.
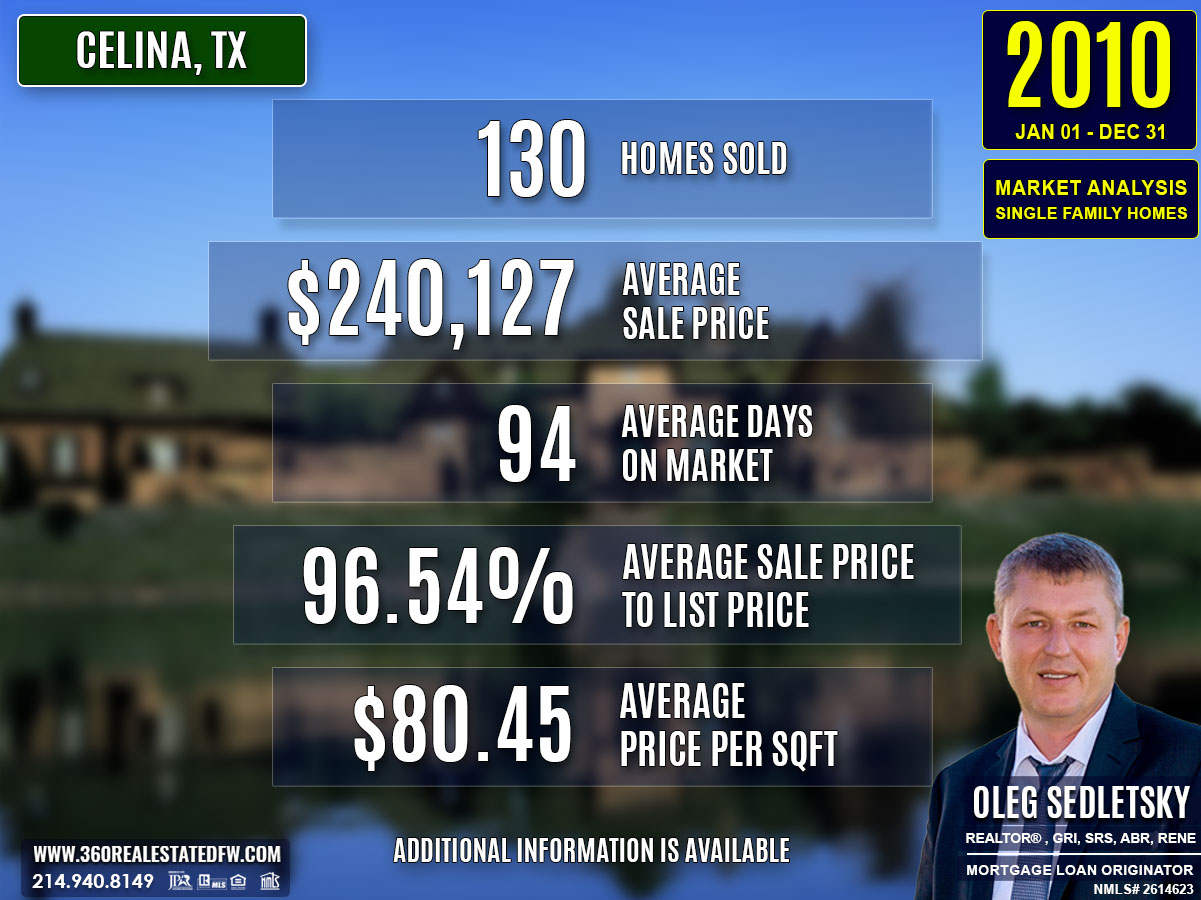
Total Homes Closed
A total of 130 residential single-family homes were sold during 2010. Among these, 17 homes featured pools, giving buyers access to amenity-rich properties. Additionally, 29 homes were newly constructed, representing a healthy share of modern, updated options in the market.
Property Pricing Insights
- Minimum Sale Price: $30,000
- Maximum Sale Price: $2,150,000
- Average Sale Price: $240,127
- Median Sale Price: $198,384
The wide range of pricing accommodated buyers across varying budgets. However, the gap between the average and median prices indicates that luxury sales (such as the highest-priced property) influenced the overall averages.
Property Size and Features
- Bedrooms: Properties typically featured 4 bedrooms, with a range of 2 to 7.
- Bathrooms: The average home had 3 bathrooms. The maximum recorded was 8 (6 full and 2 half).
- Square Footage: Homes ranged from 784 sq. ft. to an expansive 9,200 sq. ft., with an average of 2,811 sq. ft.
- Lot Size: Lot sizes averaged 1.12 acres, though most common properties were smaller (median lot size of 0.38 acres).
This reflects the variety of homes in Celina, TX, spanning cozy residences to estate-like properties.
Market Dynamics
- Days on Market (DOM): Average DOM stood at 94 days, with a maximum of 788 days and a minimum of just 2 days.
- Close Price to Listing Price Ratio (ClsPr/LstPr): Average ClsPr/LstPr was 96.54%, while the median was slightly higher at 97.06%.
- Close Price to Original Listing Price Ratio (ClsPr/OLP): The average was 91.79%, signifying moderate negotiation flexibility.
- Average Price per SqFt: Selling prices averaged $80.45 per square foot, indicating affordable value compared to high-end markets.
Homes generally sold within 3 months, suggesting a balanced market. Price-to-list ratios near 100% show efficient pricing and market confidence.
Insights into the Most Expensive Celina, TX Property Sold in 2010
The standout sale of 2010 was a custom-built estate offering an impressive combination of space, luxury, and features.
- Price: $2,150,000
- Beds: 5
- Baths: 7 (5 full, 2 half)
- Square Footage: 9,200 sq. ft.
- Price per SqFt: $233.70
- Lot Size: 3.01 acres
- DOM: 254 days
- ClsPr/LstPr: 100%
- ClsPr/OLP: 100%
- Year Built: 2007
The property featured seven garages, several kitchens, private guest quarters, oversized en-suite bedrooms, a gym, a study, and a swimming pool. It highlighted high-end living and catered to multi-generational needs.
This sale set a high benchmark, contributing to elevated average prices and showcasing Celina’s luxury market potential. However, its extended DOM (254 days) highlights the niche demand for ultra-luxury homes relative to moderately priced properties.
Economic context

Average Electricity Costs in Dallas-Fort Worth in 2010
Electricity costs decreased further to $0.12 per kilowatt-hour in 2010, down from $0.13 in 2009. The drop allowed households to manage monthly budgets a bit more effectively. For real estate, affordability in utility costs could make energy-conscious homes an easier sell, particularly as homebuyers explored long-term cost savings.
Average Price for Regular Gasoline in Texas in 2010
Gasoline prices rebounded slightly, averaging $2.64 per gallon in 2010, compared to $2.21 in 2009. The rise in fuel costs likely pushed many homebuyers to evaluate commute expenses alongside their home budgets. Urban areas and transit-centered communities may have seen increased interest as reliable transport options became a key factor.
Average 30-Year Fixed Mortgage Rate in 2010
Mortgage rates declined further to 4.86% in 2010, offering favorable conditions for potential homebuyers. This drop made monthly payments more manageable and contributed to a gradual recovery in the housing market. Pre-approvals with local mortgage loan originators were essential for homebuyers to confidently pursue homes in competitive markets.
Curious about today’s mortgage rates and the home you can comfortably afford?
Submit a no-obligation mortgage application today and get pre-approved to determine your budget and take the first step toward homeownership with confidence.
The 2010 real estate market in Celina, TX reflected resilience and adaptability, offering opportunities for both homebuyers and home-sellers. From affordable starter homes to luxury estates, the market catered to a wide spectrum of needs. This closing section provides insights from the perspectives of both buyers and sellers while highlighting the key components that shaped the year’s transactions.
Homebuyers and First-Time Homebuyers Perspective
For homebuyers, particularly first-time buyers, 2010 provided a favorable environment. Competitive home prices and relatively low mortgage rates (averaging 4.86%) made homeownership more attainable. However, securing mortgage pre-approval was vital as it became a de facto standard for serious real estate transactions in Celina. With pre-approval in hand, buyers gained a competitive edge, ensuring their offers were not only considered but prioritized by sellers in a market where efficient pricing and moderate demand prevailed. First-time buyers especially benefited from clear price ranges, offering an entry point for a variety of budgets.
Home-Sellers Perspective
Home-sellers in Celina relied heavily on realtors for marketing strategies and expert advice throughout the selling process. Given the average days on market (94 days), realtor marketing played a crucial role in ensuring maximum market exposure and accurate pricing. Sellers who priced their homes competitively saw transactions close with minimal discounts, as close-price-to-list-price ratios averaged 96.54%. For luxury properties, like the most expensive home sold, strategic marketing helped attract niche buyers despite the longer sale timeline. Sellers overall benefited from the market’s stability and steady buyer interest.
Final Thoughts
The 2010 real estate market in Celina, Texas struck a delicate balance between affordability and luxury, offering value to both buyers and sellers. The reliance on realtor expertise and the importance of mortgage pre-approval stood out as key factors driving transaction success. These elements underscore the importance of preparedness and market knowledge in navigating the buying or selling process. Celina’s market dynamics in 2010 ultimately created opportunities for growth and optimism, setting a solid foundation for future real estate activity.
Why Historical Statistical Data Matters in the Celina, Texas Real Estate Market
Did you know that Appraisers and Realtors rely on historical statistical data to determine a property’s current value?
The information presented above is just a small glimpse into the wealth of essential data available to help both homebuyers and sellers set realistic expectations and gain an initial understanding of the real estate market in Celina, Texas. Real estate transactions are intricate, and what you see here is merely a sample of the many factors at play in each deal in this city.
Beyond these insights, a comprehensive analysis is available that focuses on specific aspects like zip codes, neighborhoods, and homes within certain school districts in Celina. This granular data dives deeper into market trends, allowing for a precise understanding of local dynamics. Additionally, historical data plays a critical role in crafting informed strategies, providing the context needed to make confident decisions that align with your goals.
Unlock Exceptional Service!
Assistance with all your real estate needs in the Dallas-Fort Worth area is just a click or call away. Reach out at 214-940-8149 or connect through the links below.
Meet Your Trusted Realtor and Mortgage Expert in Celina, Texas!
Greetings! I’m Oleg Sedletsky, and I’m excited to introduce myself as your go-to full-time licensed Texas REALTOR® and Mortgage Loan Originator.
I proudly represent JPAR® – Real Estate Brokerage as a REALTOR® and Utopia Mortgage LLC as a Mortgage Loan Originator! My designations and certifications reflect my dedication to helping you achieve your real estate goals in CELINA, TX and other locations in the vibrant Dallas-Fort Worth area!
Whether you’re a homebuyer or a home seller, the information on this page highlights just a fraction of what’s important to know about the Celina, TX real estate market. Data like this is key to understanding trends, making informed decisions, and achieving your real estate goals.
The good news? I can provide much more. When you choose me as your real estate agent, you’ll gain access to detailed neighborhood analyses, historical trends, and everything you need to make confident decisions. Whether you’re buying your dream home or securing the best deal on a sale, I’ll guide you every step of the way with peace of mind.
I’d love to be your trusted advisor in this exciting journey. With a commitment to ongoing professional development, I’m always improving to serve you better. Plus, I’m fluent in English, Ukrainian, and Russian and ready to help whenever you’re ready.
If you’re looking for a dedicated, experienced professional, contact me today!
It’s All About You and Your Real Estate Goals!
My mission is to serve you! With my knowledge and expertise, I’m here to help you achieve all your real estate goals!
I’m passionate about helping homebuyers and home-sellers navigate the exciting real estate landscape in Celina, Texas! Whether you’re searching for your dream home, exploring land options, or looking for commercial properties, my Real Estate Services have you covered.
Contact me today for all your real estate needs in Celina, Texas! Call/text 214-940-8149
A Comprehensive Analysis of Single-Family Residential Housing Market in Celina, TX: 2010 to Present
Discover the trends, stats, and insights shaping Celina’s real estate market year by year!
2010-2020
Celina, TX Real Estate Market Report 2010: Analysis and Trends
Celina, TX Real Estate Market Report 2011: Analysis and Trends
Celina, TX Real Estate Market Report 2012: Analysis and Trends
Celina, TX Real Estate Market Report 2013: Analysis and Trends
Celina, TX Real Estate Market Report 2014: Analysis and Trends
Celina, TX Real Estate Market Report 2015: Analysis and Trends
Celina, TX Real Estate Market Report 2016: Analysis and Trends
Celina, TX Real Estate Market Report 2017: Analysis and Trends
Celina, TX Real Estate Market Report 2018: Analysis and Trends
Celina, TX Real Estate Market Report 2019: Analysis and Trends
Celina, TX Real Estate Market Report 2020: Analysis and Trends
This market analysis is intended solely for educational purposes. This market analysis is based on data sourced from NTREIS, Inc. This analysis is exclusively focused on single-family homes and does not account for other property types. The total number of real estate transactions within the specified period and location may vary. Data accuracy cannot be guaranteed due to potential input errors made by NTREIS users. This market analysis does not account for all new construction home sales. If you need detailed information about recorded property sales or other public records, please contact the appropriate city or county office.
Prosper, TX Real Estate: A Comprehensive Analysis of the 2024 Single-Family Residential Housing Market
The 2024 real estate market in Prosper, Texas experienced notable shifts shaped by fluctuating economic variables, including an average 30-year fixed mortgage rate of 6.90%. While sales slowed compared to 2023, the market remained strong, showing increased average sales prices and notable demand for modern and luxury homes. Buyers and sellers continued to adapt to tighter financial conditions, resulting in significant activity among high-end and mid-tier offerings.
Key Takeaways and Trends from the 2024 Real Estate Market in Prosper, TX
1. Pricing Range
The 2024 market recorded property prices ranging from $268,000 to a high of $3,300,000, with the average price hitting $944,343. While the luxury segment saw significant demand, a more cautious price increment for standard homes reflected balanced market dynamics.
2. Market Efficiency
Average Days on Market (DOM) held steady at 62 days, highlighting efficient sales processes despite changing conditions. The Close Price/List Price ratio of 97.08% showed that sellers were slightly more negotiation-friendly, likely due to increased buyer caution amid high borrowing costs.
3. Unique Outliers
The most expensive property sold, a $3,300,000 ranch-style estate, highlighted the demand for unique, feature-rich estates. Its 5-acre lot, luxury features, and multifunctional outdoor areas underscored continued interest in expansive, high-value properties.
4. Mortgage Rates Impact
With mortgage rates averaging 6.90%, affordability concerns surfaced, prompting careful buyer pricing strategies and moderate pricing adjustments. New construction and luxury homes, however, remained relatively unaffected, driving demand from higher-income buyers.
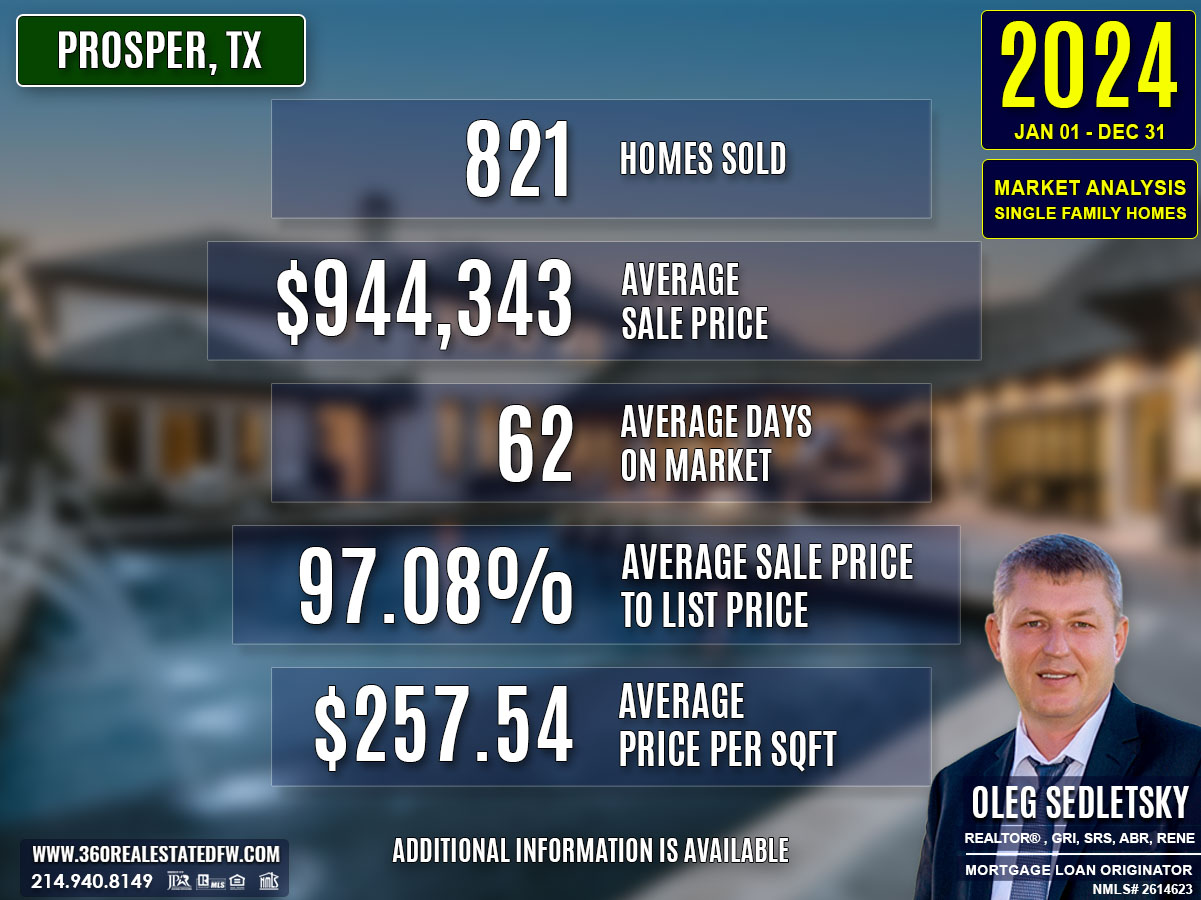
Total Homes Closed
A total of 821 single-family homes closed in 2024. Among these, 174 included pools, catering to leisure-focused buyers. Additionally, 283 were new construction homes, underscoring continued demand for modern properties with updated features.
Property Pricing Insights
- Minimum Price: $268,000
- Maximum Price: $3,300,000
- Average Price: $944,343
- Median Price: $885,000
The median and average prices highlight a slight push toward higher-value transactions, driven largely by luxury and new-build property sales.
Property Size and Features
- Average Bedrooms: 4
- Average Bathrooms: 4
- Average Square Footage: 3,611 sqft
- Average Lot Size Area: 0.304 acres
The data indicates consistent demand for family-sized homes. Larger lots were especially favored in high-end transactions.
Market Dynamics
- Average DOM: 62 days
- Average ClsPr/LstPr Ratio: 97.08%
- Average ClsPr/OLP Ratio: 94.69%
- Average Price per Square Foot: $257.54
These metrics reflect a steady balance in market efficiency, with properties selling slightly below asking prices on average, likely due to the impact of economic conditions on buyer behavior.
Insights into the Most Expensive Prosper, TX Property Sold in 2024
The standout property of 2024 was a stunning ranch-style estate sold for $3,300,000. This luxury home offered expansive features and bespoke appeal, playing a key role in shaping market perceptions of high-end properties.
Property Highlights:
- Price: $3,300,000
- Beds/Baths: 5 beds / 6 baths
- Square Footage: 5,437 sqft
- Price per Sqft: $606.95
- Lot Size: 5+ acres
- DOM: 38 days
- ClsPr/LstPr and ClsPr/OLP Ratios: 100%
- Year Built: 2014
Features: Heated pool-spa, 4-car garage, 3-stall barn, outdoor kitchen, outdoor fireplace, expansive living spaces.
This home’s uniqueness and features not only positioned it as the year’s most significant sale but also underscored the luxury segment’s ongoing strength. Its relatively quick DOM and full-price sale pointed to strong demand for premium, turnkey properties.
The sale of this estate reaffirmed Prosper’s attractiveness to high-net-worth buyers. While most buyers were influenced by rising mortgage rates, the luxury sector remained robust, offering sellers opportunities to attract substantial buyer interest.
Economic context
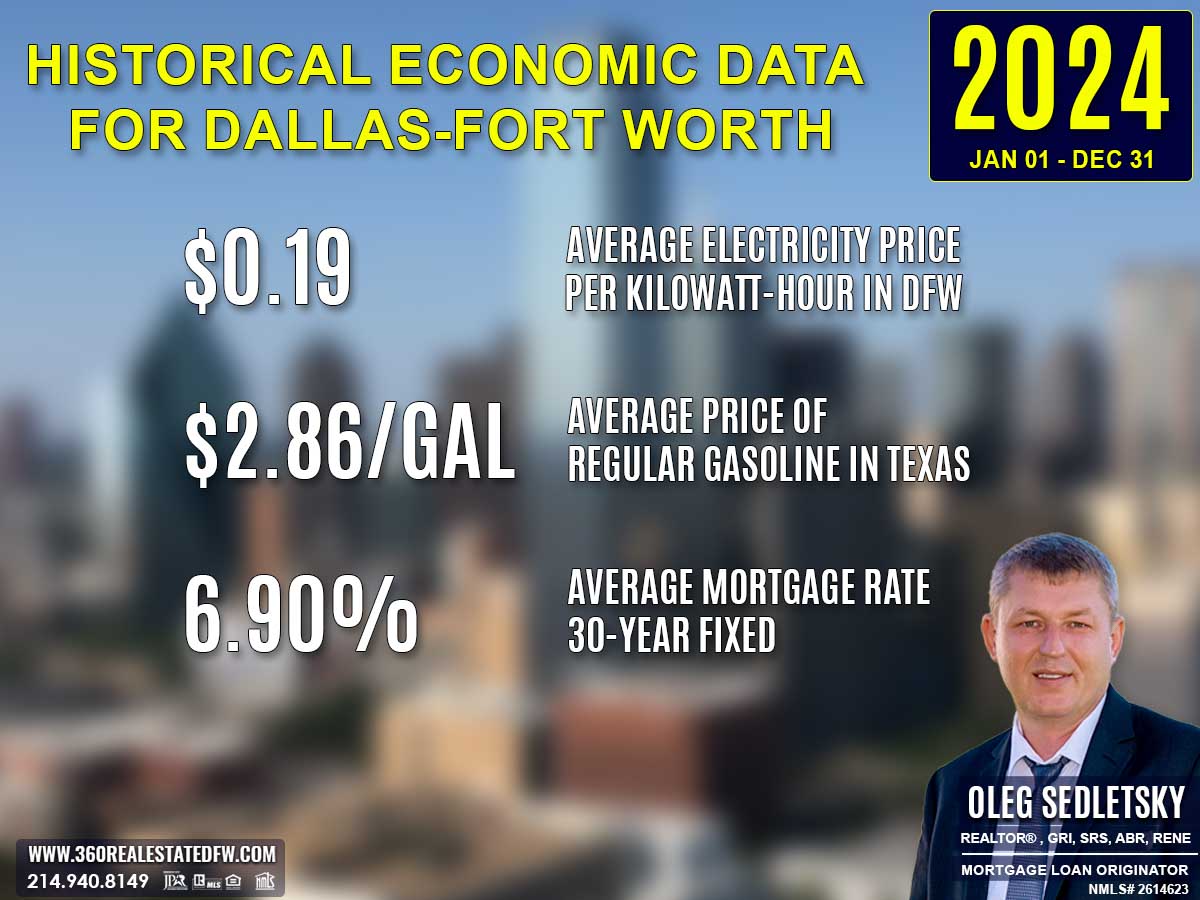
Average Electricity Costs in Dallas-Fort Worth in 2024
Electricity prices rose again to $0.19 per kilowatt-hour in 2024, up from $0.17 in 2023. The steady rise in energy costs underscored the growing value of homes equipped with renewable energy solutions. Energy-conscious designs likely remained a key factor in real estate market trends.
Average Price for Regular Gasoline in Texas in 2024
Gas prices settled slightly lower at $2.86 per gallon in 2024, down from $3.06 in 2023. This decrease, while modest, might have encouraged more exploratory behavior from buyers considering homes in more distant locations. The reduced cost of transportation relieved some financial stress for commuting.
Average 30-Year Fixed Mortgage Rate in 2024
The average 30-year fixed mortgage rate fell marginally to 6.90% in 2024, down from 7.00% in 2023. While still elevated, this slight decline could provide homebuyers with additional opportunities to re-enter the market. Pre-approvals with a local mortgage loan originator remained critical in helping buyers react quickly to evolving financial conditions and maintain a competitive edge.
Curious about today’s mortgage rates and the home you can comfortably afford?
Submit a no-obligation mortgage application today and get pre-approved to determine your budget and take the first step toward homeownership with confidence.
Overview of Differences Between the 2023 and 2024 Real Estate Markets in Prosper, Texas
Total Homes Sold
- 2023 closed 975 sales.
- 2024 saw 821 homes closed.
This marks a 15.8% decrease in total sales year-over-year, likely influenced by higher borrowing costs and economic uncertainty.
Pricing Trends
- Minimum Price: $268,000 in 2024 compared to $269,900 in 2023, a slight decrease.
- Maximum Price: Fell significantly from $7,200,000 in 2023 to $3,300,000 in 2024.
- Average Price: Increased from $883,987 in 2023 to $944,343 in 2024, reflecting greater interest in mid-to-high tier properties.
- Median Price: Also increased from $805,100 to $885,000, showing a healthy shift in market demand for well-valued listings in this range.
Property Features
- Square Footage (Average): Grew slightly in 2024 to 3,611 sq. ft. from 3,489 sq. ft.
- Square Footage (Median): Similarly, rose from 3,477 sq. ft. in 2023 to 3,600 sq. ft.
- Lot Size Area (Average): Increased modestly to .304 acres in 2024 from .279 in 2023.
Homes with Pools
2023 recorded 161 versus 174 in 2024, hinting at sustained interest in lifestyle amenities.
New Construction Homes
Dropped significantly from 448 units in 2023 to 283 in 2024. This decline reflects a slowdown in new developments amid economic pressures.
Market Dynamics
- Days on Market (DOM): Remained stable at an average of 62 days in both years, suggesting consistent pacing.
- Average ClsPr/LstPr (Close Price to Listing Price): Slightly decreased from 97.10% to 97.08%, showing negligible changes in buyer vs. seller negotiations.
- Average ClsPr/OLP (Close Price to Original Listing Price): Marginal decline from 94.96% in 2023 to 94.69% in 2024.
Most Expensive Property Sold
- 2023: A custom-built estate sold for $7,200,000. This 10,494 sq. ft. property featured high-end amenities like dual game rooms, two kitchens, a sports car lift, and an infinity-edge pool on 1.923 acres.
- 2024: A ranch-style estate sold for $3,300,000. This 5,437 sq. ft. home spanned over five acres, offering amenities like a pool-spa, 4-car garage, barn, and outdoor kitchen space.
The most expensive sale in 2024 was significantly lower in both price and size. However, it maintained exclusivity due to unique features and land size.
Summary of Real Estate Market Analysis for Prosper, TX in 2024
The 2024 real estate market in Prosper, TX reflected a shifting landscape influenced by a mix of economic pressures and strong demand for specific property types. With 821 homes sold, the market showcased resilience despite higher mortgage rates. Significant demand for new construction homes and high-end properties dominated trends, while overall pricing and market efficiency adjusted to meet buyer expectations.
Homebuyers and First-Time Homebuyers Perspective
For homebuyers, especially those entering the market for the first time, 2024 presented both challenges and opportunities. High 30-year fixed mortgage rates at an average of 6.90% tightened affordability for many, requiring buyers to be more strategic in their searches. Despite this, the availability of 283 new construction homes offered modern spaces tailored to family needs. First-time homebuyers benefited from slightly softened property valuations and the ability to negotiate more competitively due to the longer average Days on Market (62 days). Partnering with experienced Realtors proved essential to navigating Prosper’s shifting conditions and finding homes that balanced comfort, value, and budget.
Home-Sellers Perspective
Home Sellers in 2024 faced a dynamic market that required careful planning and flexibility. With average close price to listing price (ClsPr/LstPr) ratios settling at 97.08%, sellers had to adjust expectations and develop strategic pricing to attract buyers. Marketing played a crucial role in highlighting key property features like pools or expansive outdoor areas to stand out in a slightly slower market. Homes with unique features and luxury amenities continued to command strong interest, as reflected in the swift sale of top-tier properties. Savvy sellers worked closely with realtors to package their offerings effectively and tap into demand from specific buyer segments, especially for high-value and modern homes.
Final Thoughts
The 2024 real estate market underscored the importance of adaptability for both buyers and sellers. Although higher mortgage rates introduced new hurdles, motivated buyers found opportunities in a market ripe with updated listings and well-presented homes. Sellers who relied on comprehensive marketing strategies and tailored pricing saw success in capturing buyer interest. Whether navigating affordability concerns or standing out in a competitive luxury segment, working alongside a skilled Realtor was key to turning challenges into opportunities. Looking ahead, Prosper’s housing market remains poised for growth, shaped by economic conditions and evolving buyer preferences.
The Importance of Statistical Data in Prosper, Texas Real Estate Market
Did you know that Appraisers and Realtors rely on historical statistical data to determine a property’s current value?
The data above is just the beginning. This glimpse into the Prosper, Texas real estate market outlines trends but doesn’t capture the full picture. To truly understand the city’s housing market, you’ll need specific insights like zip code analyses, neighborhood breakdowns, and school-district-focused data. Historical trends and comprehensive analyses arm both homebuyers and home sellers with the tools they need to make decisions confidently.
The insights on this page represent just a small part of the comprehensive real estate services I provide to my clients. Whether you’re a buyer aiming to find your dream home or a seller looking to maximize your property’s value, I provide data-backed strategies tailored to your goals.
Reach out today—I’d love to help you achieve success in Prosper’s vibrant housing market!
Unlock Exceptional Service!
Assistance with all your real estate needs in the Dallas-Fort Worth area is just a click or call away. Reach out at 214-940-8149 or connect through the links below.
Meet Your Trusted Realtor and Mortgage Expert in Prosper, Texas!

Oleg Sedletsky REALTOR® in Prosper, Texas. Call/Text 214.940.8149
Greetings! I’m Oleg Sedletsky, and I’m excited to introduce myself as your go-to full-time licensed Texas REALTOR® and Mortgage Loan Originator.
I proudly represent JPAR® – Real Estate Brokerage as a REALTOR® and Utopia Mortgage LLC as a Mortgage Loan Originator! My designations and certifications reflect my dedication to helping you achieve your real estate goals in Prosper, TX and other locations in the vibrant Dallas-Fort Worth area!
With my expertise, I’ll provide you with in-depth resources, including detailed market reports and historical data, to help you make confident, well-informed decisions. Fluent in English, Ukrainian, and Russian, I’m here to guide you through every step of the process with personalized support and dedication.
It’s All About You and Your Real Estate Goals!
My mission is to serve you! With my knowledge and expertise, I’m here to help you achieve all your real estate goals!
I’m passionate about helping homebuyers and home-sellers navigate the exciting real estate landscape in Prosper, Texas! Whether you’re searching for your dream home, exploring land options, or looking for commercial properties, my Real Estate Services have you covered.
Contact me today for all your real estate needs in Prosper, Texas! Call/text 214-940-8149
A Comprehensive Analysis of Single-Family Residential Housing Market in Prosper, TX: 2010 to Present
Discover the trends, stats, and insights shaping Prosper’s real estate market year by year!
2010-2020
Prosper, TX Real Estate Market Report 2010: Analysis and Trends
Prosper, TX Real Estate Market Report 2011: Analysis and Trends
Prosper, TX Real Estate Market Report 2012: Analysis and Trends
Prosper, TX Real Estate Market Report 2013: Analysis and Trends
Prosper, TX Real Estate Market Report 2014: Analysis and Trends
Prosper, TX Real Estate Market Report 2015: Analysis and Trends
Prosper, TX Real Estate Market Report 2016: Analysis and Trends
Prosper, TX Real Estate Market Report 2017: Analysis and Trends
Prosper, TX Real Estate Market Report 2018: Analysis and Trends
Prosper, TX Real Estate Market Report 2019: Analysis and Trends
Prosper, TX Real Estate Market Report 2020: Analysis and Trends
This market analysis is intended solely for educational purposes. This market analysis is based on data sourced from NTREIS, Inc. This analysis is exclusively focused on single-family homes and does not account for other property types. The total number of real estate transactions within the specified period and location may vary. Data accuracy cannot be guaranteed due to potential input errors made by NTREIS users. This market analysis does not account for all new construction home sales. If you need detailed information about recorded property sales or other public records, please contact the appropriate city or county office.
Prosper, TX Real Estate: A Comprehensive Analysis of the 2023 Single-Family Residential Housing Market
The 2023 real estate market in Prosper, Texas faced continued challenges with rising mortgage rates, which averaged 7.00% for a 30-year fixed loan. The higher rates, combined with steady economic shifts in energy and fuel costs, added to buyer hesitation and impacted mid-level purchasing power. Although fewer luxury properties sold compared to prior years, the market demonstrated resilience with a substantial increase in total transactions and new home construction relative to 2022. The diversity of property offerings and ongoing demand supported steady pricing trends with slight moderation in market competition.
Key Takeaways and Trends from the 2023 Real Estate Market in Prosper, TX
1. Pricing Range
The properties sold in 2023 ranged from $269,900 to $7,200,000. The price spread reflects the wide variety of homes available, from starter homes to luxury estates. While high-end transactions did occur, newer mid-tier homes saw consistent activity, evidencing broader affordability despite the challenging economic environment.
2. Market Efficiency
The average Days on Market (DOM) rose significantly to 62 days, compared to much shorter transaction periods in 2022. Additionally, the ClsPr/LstPr (close price to listing price) ratio dropped to 97.10%, down from 101.96% in 2022, reflecting tempered buyer activity and increased seller concessions amid rising rates.
3. Unique Outliers
The luxury property market experienced notable activity with the sale of a custom estate at $7,200,000, emphasizing the demand for high-quality, uniquely designed homes. However, a notable decline in pool properties indicated a shift in buyer preferences or reduced inventory for such homes.
4. Mortgage Rates Impact
With Average 30-Year Fixed Mortgage rates reaching a striking 7.00%, buyer affordability decreased. Potential homeowners faced higher monthly payments, which softened competition in some areas, particularly for luxury homes or those requiring larger loans.
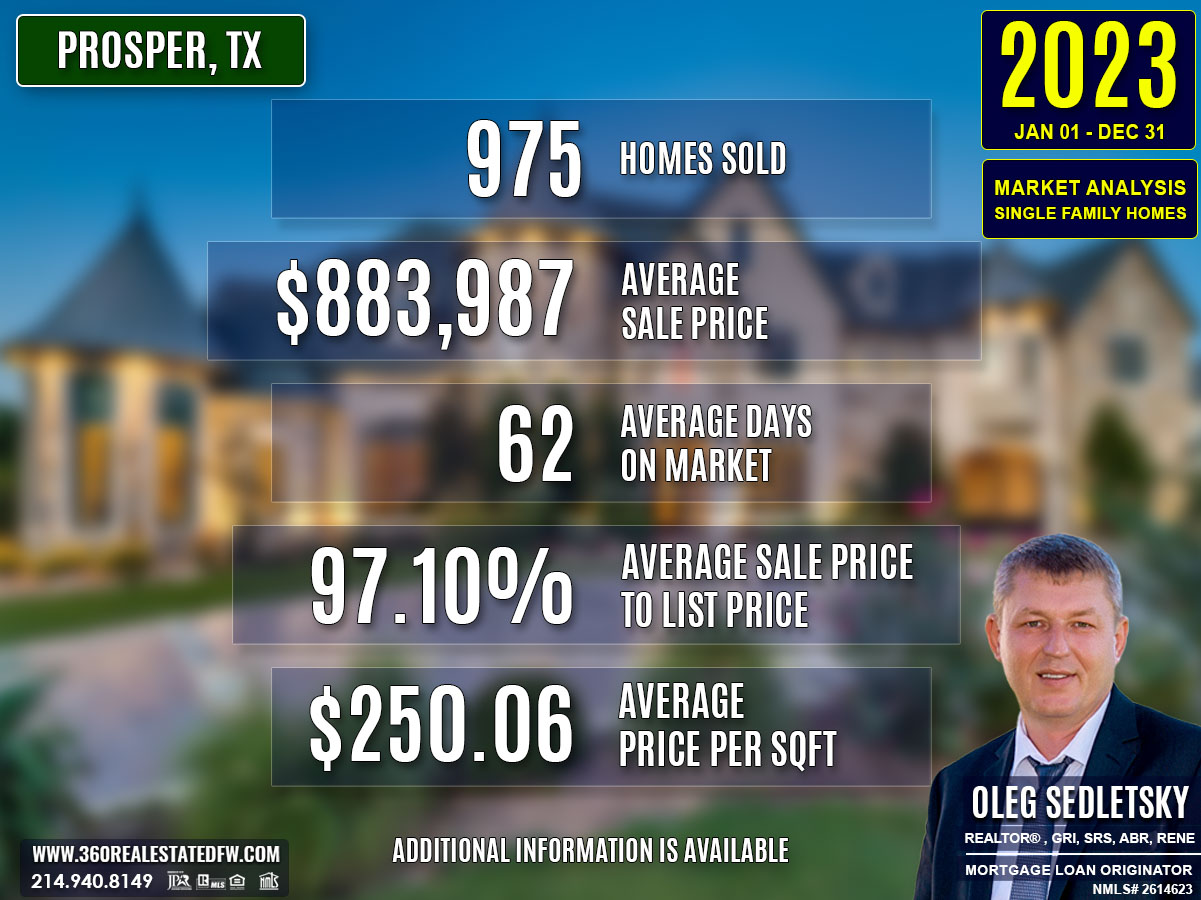
Total Homes Closed
A total of 975 homes were sold in 2023, an increase compared to the 793 homes sold in 2022. Among these, 448 were new construction homes, reflecting a growing interest in modern, freshly built homes. Meanwhile, the sale of 161 homes with pools marked a notable drop compared to previous years, pointing to either inventory constraints or changed buyer priorities.
Property Pricing Insights
- Minimum Price: $269,900
- Maximum Price: $7,200,000
- Average Price: $883,987
- Median Price: $805,100
Property pricing remained robust, with the average price stabilizing close to prior year levels despite market pressures.
Property Size and Features
- Bedrooms and Bathrooms: Most homes averaged 4 bedrooms and 4 bathrooms, reflecting family-friendly configurations.
- Square Footage: Property sizes averaged 3,489 sqft, with offerings ranging from compact layouts to expansive estates.
- Lot Size Area: The average lot covered 0.279 acres, accommodating varied property designs for flexibility in amenities and space.
Market Dynamics
- Days on Market (DOM): Homes spent an average of 62 days on the market, indicating slower transactions than in previous years.
- ClsPr/LstPr Ratio: 97.10% reflected softened competition and buyer leverage.
- ClsPr/OLP Ratio: 94.96%, underscoring the importance of realistic initial pricing strategies.
- Average Price per Square Foot: $250.06, signaling consistent cost valuation despite adjustments in other dynamics.
Insights into the Most Expensive Prosper, TX Property Sold in 2023
The most notable property sold in 2023 was a custom-built luxury estate designed for sophistication and functionality. Here are the highlights of this exceptional home:
- Price: $7,200,000
- Beds/Baths: 5 beds, 7 baths
- Square Footage: 10,494 sqft
- Lot Size: 1.923 acres
- Price per SqFt: $686.11
- DOM: 194 days
- ClsPr/LstPr Ratio: 92.90%
- ClsPr/OLP Ratio: 87.27%
- Year Built: 2020
This home set itself apart with features like 19-ft ceilings, two kitchens, dedicated kids and adult game rooms, an infinity-edge pool and spa, custom lighting, an 8-car garage with built-in sports car lifts, and a private gated garage entrance.
The sale showcased the enduring appeal of exclusive, feature-rich properties in Prosper, but it also highlighted the challenges of pricing and demand in the luxury segment. Despite its unique qualities, the property spent significant time on the market and sold below its listing price, reflecting cautious buyer sentiment in the high-end sector.
Economic context

Average Electricity Costs in Dallas-Fort Worth in 2023
Electricity prices dropped slightly to $0.17 per kilowatt-hour in 2023, compared to $0.18 in 2022. While this small decrease provided some relief, energy-efficient homes remained a top priority for homebuyers. Such features offered long-term cost savings that appealed to budget-conscious households.
Average Price for Regular Gasoline in Texas in 2023
Gas prices fell to $3.06 per gallon in 2023, down from $3.47 the previous year. This decline could have renewed interest in suburban properties by making commutes more affordable. homebuyers may have placed higher importance on access to amenities and infrastructure to balance the potential for rising future gas prices.
Average 30-Year Fixed Mortgage Rate in 2023
Mortgage rates increased to 7.00% in 2023, up sharply from 5.53% the prior year. This jump added significant pressure to affordability and homebuyers’ decision-making. Pre-approvals through local mortgage loan originators became essential in helping buyers secure competitive rates and stay within budget during challenging conditions.
Curious about today’s mortgage rates and the home you can comfortably afford?
Submit a no-obligation mortgage application today and get pre-approved to determine your budget and take the first step toward homeownership with confidence.
Overview of Differences Between the 2022 and 2023 Real Estate Markets in Prosper, Texas
1. Total Homes Sold
- 2023: 975 homes sold
- 2022: 793 homes sold
Difference: Increase of 182 homes, showing heightened activity in 2023.
2. Average Sales Price
- 2023: $883,987
- 2022: $901,534
Difference: Decrease of $17,547, indicating slight adjustment in pricing amid economic pressures.
3. Average Price per Square Foot
- 2023: $250.06
- 2022: $256.66
Difference: Decline of $6.60 per square foot, reflecting a softening in property valuation trends.
4. Average Days on Market (DOM)
- 2023: 62 days
- 2022: 27 days
Difference: Increase of 35 days, highlighting slowed market activity influenced by rising mortgage rates.
5. Close Price to Listing Price (ClsPr/LstPr) Ratio
- 2023: 97.10%
- 2022: 101.96%
Difference: A drop of 4.86%, pointing to reduced competitiveness and increased seller concessions.
6. Homes with Pools
- 2023: 161
- 2022: 181
Difference: Decline of 20 homes, possibly due to inventory shifts or evolving buyer priorities.
7. New Construction Homes
- 2023: 448
- 2022: 164
Difference: Surge of 284 new builds, suggesting a significant uptick in demand for modern homes.
8. Most Expensive Property Sold
- 2023: Sold for $7,200,000 (5 beds, 7 baths, 10,494 sqft, $686.11 per sq. ft., Infinity-edge pool, 8-car garage, custom high-end features)
- 2022: Sold for $3,975,000 (9 beds, 11 baths, 29,122 sqft, $136.49 per sq. ft., neglected property with past sale at $4,950,000)
Difference: The 2023 top sale outpaced 2022 both in price and high-end features, showcasing luxury home demand despite market cautiousness.
Overall Trends
The 2023 real estate market showed increased sales and a boom in new construction. However, rising mortgage rates led to longer listing periods, softer close-to-list price ratios, and minor declines in prices per square foot. Demand for modern homes, as evidenced by the rise in new builds, drove much of the year’s market activity, while high-end sales highlighted sustained interest in luxury properties. Despite some market softening, Prosper’s real estate market remained resilient.
Summary of Real Estate Market Analysis for Prosper, TX in 2023
The 2023 real estate market in Prosper, Texas exhibited both resilience and adjustment as higher mortgage rates significantly shaped buyer sentiment and market dynamics. While overall transaction volume increased compared to 2022, metrics like Days on Market (DOM) and close price-to-listing price ratios highlighted a tempered pace of sales. Despite these challenges, demand for new construction and well-priced properties underscored the market’s adaptability in navigating economic pressures.
Homebuyers and First-Time Homebuyers Perspective
For homebuyers and particularly first-time homebuyers, 2023 presented both opportunities and hurdles. Rising mortgage rates pushed affordability to its limits, making it more important than ever to approach the market with careful planning and preparation. Securing mortgage pre-approval became a non-negotiable standard for serious buyers in Prosper, ensuring their offers were competitive and considered. Additionally, working with a knowledgeable Realtor who provided deep insights into pricing trends, neighborhood dynamics, and market forecasts proved essential in finding the right property within budget while avoiding unnecessary delays.
Home-Sellers Perspective
Home Sellers in 2023 faced a real estate landscape that required strategic decision-making. With buyers becoming more cautious, pricing homes realistically from the outset and adjusting expectations became critical. The expertise of a Realtor was invaluable in navigating this climate, as sellers relied heavily on professional advice, customized marketing strategies, and effective pricing to meet buyer expectations. Realtors were especially instrumental in helping sellers showcase their properties’ unique features, attracting attention in a competitive market, and ultimately securing favorable deals.
Final Thoughts
The 2023 real estate market in Prosper, TX highlighted the importance of adaptability and strategy for all participants, from buyers seeking dream homes to sellers striving to maximize value. With Prosper’s evolving market conditions, the guidance of a skilled real estate professional is more important than ever to help clients achieve their goals confidently and effectively.
The Importance of Statistical Data in Prosper, Texas Real Estate Market
Did you know that Appraisers and Realtors rely on historical statistical data to determine a property’s current value?
The data above is just the beginning. This glimpse into the Prosper, Texas real estate market outlines trends but doesn’t capture the full picture. To truly understand the city’s housing market, you’ll need specific insights like zip code analyses, neighborhood breakdowns, and school-district-focused data. Historical trends and comprehensive analyses arm both homebuyers and home sellers with the tools they need to make decisions confidently.
The insights on this page represent just a small part of the comprehensive real estate services I provide to my clients. Whether you’re a buyer aiming to find your dream home or a seller looking to maximize your property’s value, I provide data-backed strategies tailored to your goals.
Reach out today—I’d love to help you achieve success in Prosper’s vibrant housing market!
Unlock Exceptional Service!
Assistance with all your real estate needs in the Dallas-Fort Worth area is just a click or call away. Reach out at 214-940-8149 or connect through the links below.
Meet Your Trusted Realtor and Mortgage Expert in Prosper, Texas!
Oleg Sedletsky REALTOR® in Prosper, Texas. Call/Text 214.940.8149
Greetings! I’m Oleg Sedletsky, and I’m excited to introduce myself as your go-to full-time licensed Texas REALTOR® and Mortgage Loan Originator.
I proudly represent JPAR® – Real Estate Brokerage as a REALTOR® and Utopia Mortgage LLC as a Mortgage Loan Originator! My designations and certifications reflect my dedication to helping you achieve your real estate goals in Prosper, TX and other locations in the vibrant Dallas-Fort Worth area!
With my expertise, I’ll provide you with in-depth resources, including detailed market reports and historical data, to help you make confident, well-informed decisions. Fluent in English, Ukrainian, and Russian, I’m here to guide you through every step of the process with personalized support and dedication.
It’s All About You and Your Real Estate Goals!
My mission is to serve you! With my knowledge and expertise, I’m here to help you achieve all your real estate goals!
I’m passionate about helping homebuyers and home-sellers navigate the exciting real estate landscape in Prosper, Texas! Whether you’re searching for your dream home, exploring land options, or looking for commercial properties, my Real Estate Services have you covered.
Contact me today for all your real estate needs in Prosper, Texas! Call/text 214-940-8149
A Comprehensive Analysis of Single-Family Residential Housing Market in Prosper, TX: 2010 to Present
Discover the trends, stats, and insights shaping Prosper’s real estate market year by year!
2010-2020
Prosper, TX Real Estate Market Report 2010: Analysis and Trends
Prosper, TX Real Estate Market Report 2011: Analysis and Trends
Prosper, TX Real Estate Market Report 2012: Analysis and Trends
Prosper, TX Real Estate Market Report 2013: Analysis and Trends
Prosper, TX Real Estate Market Report 2014: Analysis and Trends
Prosper, TX Real Estate Market Report 2015: Analysis and Trends
Prosper, TX Real Estate Market Report 2016: Analysis and Trends
Prosper, TX Real Estate Market Report 2017: Analysis and Trends
Prosper, TX Real Estate Market Report 2018: Analysis and Trends
Prosper, TX Real Estate Market Report 2019: Analysis and Trends
Prosper, TX Real Estate Market Report 2020: Analysis and Trends
This market analysis is intended solely for educational purposes. This market analysis is based on data sourced from NTREIS, Inc. This analysis is exclusively focused on single-family homes and does not account for other property types. The total number of real estate transactions within the specified period and location may vary. Data accuracy cannot be guaranteed due to potential input errors made by NTREIS users. This market analysis does not account for all new construction home sales. If you need detailed information about recorded property sales or other public records, please contact the appropriate city or county office.
Prosper, TX Real Estate: A Comprehensive Analysis of the 2022 Single-Family Residential Housing Market
The real estate market in Prosper, Texas during 2022 underwent significant shifts as rising mortgage rates and economic conditions reshaped buyer and seller behavior. With a 5.53% average 30-year fixed mortgage rate and rising utility costs, market activity slowed, but home prices saw substantial growth. The landscape reflected cautious investment with steadier demand for luxury and well-featured homes.
Key Takeaways and Trends from the 2022 Real Estate Market in Prosper, TX
1. Pricing Range
Property prices in 2022 ranged from $310,000 for a modest home to $3,975,000 for a luxury estate. While the higher end of the market continued to shine, properties at all price levels witnessed increased valuations.
2. Market Efficiency
Homes sold quickly, averaging 27 days on the market, an increase from the previous year but still reflecting swift transactions. Competitive bidding led to a near 2% premium over listing prices, signifying continued strong demand.
3. Unique Outliers
The most expensive property of the year, a sprawling luxury estate, stood out not only for its price tag but also for its extensive amenities, including indoor recreational facilities and expansive grounds. Notably, this property sold at a $975,000 loss compared to the previous year (see below).
4. Mortgage Rates Impact
The significantly higher mortgage rates in 2022 dampened overall market activity, with total sales dropping by 132 homes compared to 2021. However, due to constrained inventory and steady demand, average prices and price per square foot climbed markedly.
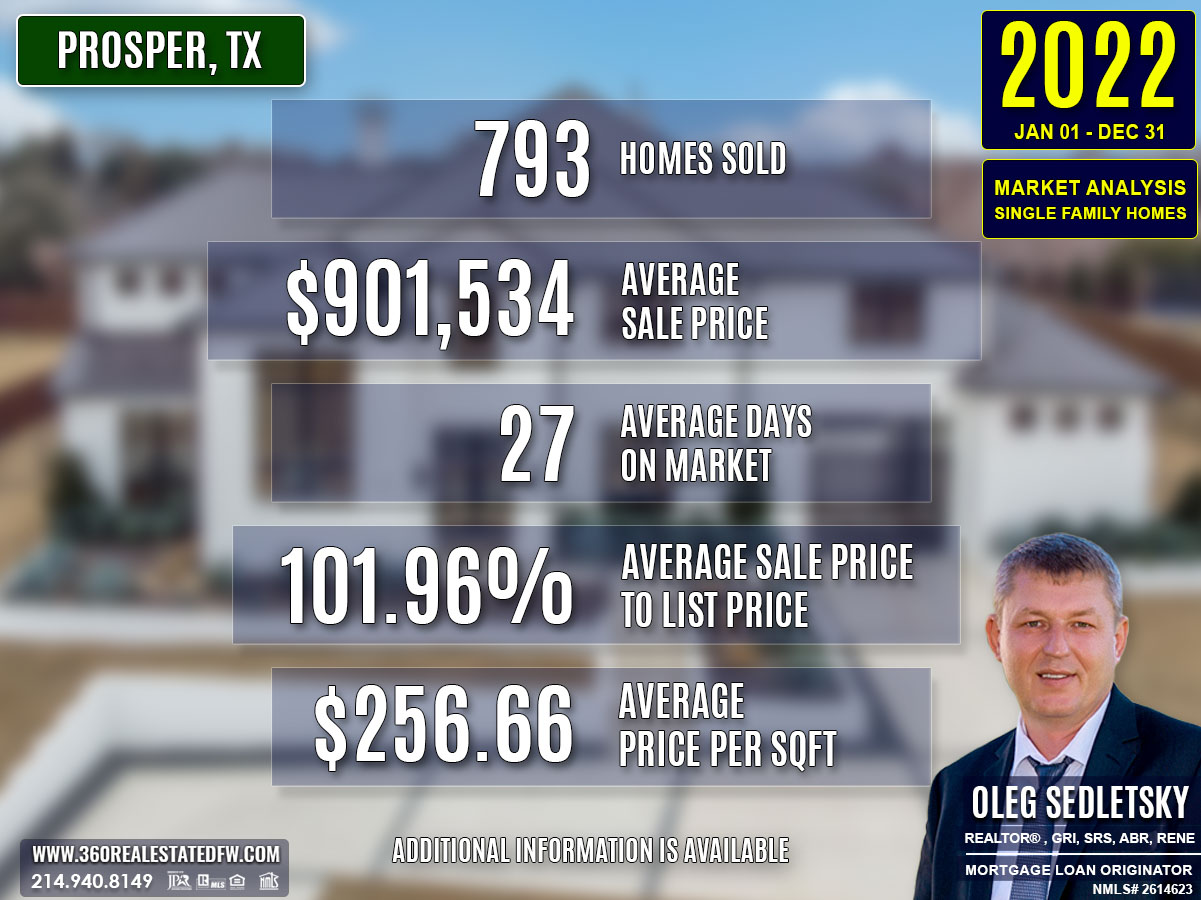
Total Homes Closed
A total of 793 homes changed hands in 2022, marking a dip from the prior year. Among these, 164 were new construction homes, reflecting a continued but modest contribution from developers. Additionally, 181 properties included pools, a slight decline suggesting tempered demand for leisure-oriented features.
Property Pricing Insights
- Minimum Price: $310,000
- Maximum Price: $3,975,000
- Average Price: $901,534
- Median Price: $840,000
While prices at the lower end provided entry points for buyers, the upper end solidified luxury trends, with the most expensive sales further driving the market’s average values.
Property Size and Features
- Bedrooms: The average property featured 4 bedrooms, with homes ranging from 2 to 9 bedrooms.
- Bathrooms: Most homes included 4 bathrooms, with a mix of full and half-bath layouts.
- Square Footage: Average size stood at 3,513 sqft, with homes ranging from 828 to 29,122 sqft.
- Lot Size: Properties averaged 0.318 acres, with the largest lot spanning nearly 6 acres.
Market Dynamics
- Days on Market (DOM): Homes sold in an average of 27 days, showing slightly slower activity compared to the fevered pace of 2021.
- ClsPr/LstPr Ratio: At 101.96%, buyers offered slightly above listing prices on average.
- ClsPr/OLP Ratio: Closed prices reached 100.16% of original listings, closely aligning with expectations.
- Average Price per Square Foot: $256.66, reflecting continued appreciation and a focus on property value per unit space.
Insights into the Most Expensive Prosper, TX Property Sold in 2022
The year’s highlight sale was again the estate that had topped charts in 2021, though it sold this year for $3,975,000, a significant decline (-$975,000) from its prior sale price due to neglect.
Key Highlights:
- Price: $3,975,000
- Beds: 9
- Baths: 11 (10 full, 1 half)
- Square Footage: 29,122 sqft
- Price per Square Foot: $136.49
- Lot Size: ~6 acres
- Days on Market: 20 days
- ClsPr/LstPr Ratio: 79.50%
- ClsPr/OLP Ratio: 79.50%
- Year Built: 1999
This palatial property included high-end features such as multiple garages, an indoor basketball court, and a yoga room. Despite its unique appeal, the property’s lower sale price reflected deferred maintenance and neglect, reminding market participants that condition plays a critical role especially in ultra-luxury sales.
Impact on Market Dynamics:
The sale of this high-profile property underscored a growing caution in the top-tier market. While luxury properties still demanded significant attention, homebuyers demonstrated more scrutiny, particularly in evaluating property condition and value.
Economic context

Average Electricity Costs in Dallas-Fort Worth in 2022
Average electricity prices spiked to $0.18 per kilowatt-hour in 2022, a sharp increase from $0.14 in 2021. Higher energy expenses placed added strain on household budgets, driving demand for energy savings. Homes with modern insulation, solar installations, or energy-saving appliances gained significant appeal during this period.
Average Price for Regular Gasoline in Texas in 2022
Gas prices surged to $3.47 per gallon in 2022, jumping from $2.65 in 2021. The substantial increase in transportation costs likely swayed homebuyers to favor central locations or areas close to public transit. Long commutes to suburban or rural homes might have lost some appeal in light of elevated gas prices.
Average 30-Year Fixed Mortgage Rate in 2022
Mortgage rates climbed steeply to 5.53% in 2022, up from 3.15% the year before. The notable rise in rates significantly impacted affordability, persuading many to reassess their homeownership goals. Homebuyers were urged to secure pre-approval with a local mortgage loan originator to better understand their financial limits in a tightened market.
Curious about today’s mortgage rates and the home you can comfortably afford?
Submit a no-obligation mortgage application today and get pre-approved to determine your budget and take the first step toward homeownership with confidence.
Overview of Differences Between the 2021 and 2022 Real Estate Markets in Prosper, Texas
1. Total Homes Sold
- 2022: 793 homes sold
- 2021: 925 homes sold
Difference: Decrease of 132 homes, representing a 14% drop in market activity, likely influenced by higher mortgage rates and reduced buyer affordability.
2. Average Sales Price
- 2022: $901,534
- 2021: $732,081
Difference: Increase of $169,453 (23%), reflecting a strong demand for mid-to-high-end properties despite fewer transactions.
3. Average Price per Square Foot
- 2022: $256.66
- 2021: $204.68
Difference: Increase of $51.98 (25%), signaling higher costs per square foot and more value placed on homes in the market.
4. Average Days on Market (DOM)
- 2022: 27 days
- 2021: 19 days
Difference: Homes took 8 days longer on average to sell in 2022, reflecting a slight softening in the speed of transactions as buyers became more cautious.
5. Close Price to Listing Price (ClsPr/LstPr) Ratio
- 2022: 101.96%
- 2021: 103.75%
Difference: A decrease of 1.79%, showing less competitive bidding and some reduction in buyer urgency.
6. Homes with Pools
- 2022: 181 homes
- 2021: 219 homes
Difference: Decrease of 38 homes, suggesting slightly less demand or availability for homes with pools in 2022 despite their general popularity.
7. New Construction Homes
- 2022: 164 homes
- 2021: 177 homes
Difference: Decrease of 13 homes, indicating a mild slowdown in the supply of new construction properties.
8. Most Expensive Property Sold (the same property two years in a row))
- 2022: $3,975,000
- Beds/Baths: 9/11
- Size: 29,122 sqft
- Features: Indoor basketball court, yoga room, multiple garages, pool, sauna, and more.
- Price per SqFt: $136.49
- DOM: 20 days
- ClsPr/LstPr Ratio: 79.50%
Sold at $975,000 less than in 2021 due to neglect and upkeep issues.
- 2021: $4,950,000
- Beds/Baths: 9/11
- Size: 29,122 sqft
- Features: Identical property as 2022.
- Price per SqFt: $169.97
- DOM: 278 days
- ClsPr/LstPr Ratio: 100.00%
Key Insight
Property condition issues can negatively affect value, with the impact becoming increasingly pronounced as the property’s level of luxury rises.
Summary of Real Estate Market Analysis for Prosper, TX in 2022
The 2022 real estate market in Prosper, Texas demonstrated resilience amidst economic changes. Rising mortgage rates and a slower pace of market activity challenged buyers and sellers. Despite these hurdles, home prices continued to climb, and demand for quality properties remained strong, though contracts closed at a slower pace than in previous years.
Homebuyers and First-Time Homebuyers Perspective
For homebuyers, particularly first-time buyers, mortgage pre-approval has shifted from being a recommendation to a necessity. Securing pre-approval not only shows financial readiness but also garners attention in this competitive market. Without pre-approval, offers are unlikely to be taken seriously. Working with a skilled Realtor can further simplify the home-buying process, ensuring that buyers can make informed decisions and secure their dream home with confidence.
Home-Sellers Perspective
Home sellers in 2022 leaned heavily on Realtors’ expertise to market their properties effectively and guide pricing strategies. With mortgage rate increases influencing buyer affordability, it was even more important to have a trusted real estate advisor to maximize visibility through strategic marketing and to price homes competitively for the best outcomes.
Final Thoughts
Navigating the dynamic and sometimes unpredictable real estate market of Prosper, TX requires expertise, planning, and data-driven decisions. Whether you’re buying your first home or selling your property, having a dedicated realtor by your side can make all the difference. The insights gained from real estate market analysis are the starting point for successful transactions, with a trusted professional ensuring your goals are met.
The Importance of Statistical Data in Prosper, Texas Real Estate Market
Did you know that Appraisers and Realtors rely on historical statistical data to determine a property’s current value?
The data above is just the beginning. This glimpse into the Prosper, Texas real estate market outlines trends but doesn’t capture the full picture. To truly understand the city’s housing market, you’ll need specific insights like zip code analyses, neighborhood breakdowns, and school-district-focused data. Historical trends and comprehensive analyses arm both homebuyers and home sellers with the tools they need to make decisions confidently.
The insights on this page represent just a small part of the comprehensive real estate services I provide to my clients. Whether you’re a buyer aiming to find your dream home or a seller looking to maximize your property’s value, I provide data-backed strategies tailored to your goals.
Reach out today—I’d love to help you achieve success in Prosper’s vibrant housing market!
Unlock Exceptional Service!
Assistance with all your real estate needs in the Dallas-Fort Worth area is just a click or call away. Reach out at 214-940-8149 or connect through the links below.
Meet Your Trusted Realtor and Mortgage Expert in Prosper, Texas!
Oleg Sedletsky REALTOR® in Prosper, Texas. Call/Text 214.940.8149
Greetings! I’m Oleg Sedletsky, and I’m excited to introduce myself as your go-to full-time licensed Texas REALTOR® and Mortgage Loan Originator.
I proudly represent JPAR® – Real Estate Brokerage as a REALTOR® and Utopia Mortgage LLC as a Mortgage Loan Originator! My designations and certifications reflect my dedication to helping you achieve your real estate goals in Prosper, TX and other locations in the vibrant Dallas-Fort Worth area!
With my expertise, I’ll provide you with in-depth resources, including detailed market reports and historical data, to help you make confident, well-informed decisions. Fluent in English, Ukrainian, and Russian, I’m here to guide you through every step of the process with personalized support and dedication.
It’s All About You and Your Real Estate Goals!
My mission is to serve you! With my knowledge and expertise, I’m here to help you achieve all your real estate goals!
I’m passionate about helping homebuyers and home-sellers navigate the exciting real estate landscape in Prosper, Texas! Whether you’re searching for your dream home, exploring land options, or looking for commercial properties, my Real Estate Services have you covered.
Contact me today for all your real estate needs in Prosper, Texas! Call/text 214-940-8149
A Comprehensive Analysis of Single-Family Residential Housing Market in Prosper, TX: 2010 to Present
Discover the trends, stats, and insights shaping Prosper’s real estate market year by year!
2010-2020
Prosper, TX Real Estate Market Report 2010: Analysis and Trends
Prosper, TX Real Estate Market Report 2011: Analysis and Trends
Prosper, TX Real Estate Market Report 2012: Analysis and Trends
Prosper, TX Real Estate Market Report 2013: Analysis and Trends
Prosper, TX Real Estate Market Report 2014: Analysis and Trends
Prosper, TX Real Estate Market Report 2015: Analysis and Trends
Prosper, TX Real Estate Market Report 2016: Analysis and Trends
Prosper, TX Real Estate Market Report 2017: Analysis and Trends
Prosper, TX Real Estate Market Report 2018: Analysis and Trends
Prosper, TX Real Estate Market Report 2019: Analysis and Trends
Prosper, TX Real Estate Market Report 2020: Analysis and Trends
This market analysis is intended solely for educational purposes. This market analysis is based on data sourced from NTREIS, Inc. This analysis is exclusively focused on single-family homes and does not account for other property types. The total number of real estate transactions within the specified period and location may vary. Data accuracy cannot be guaranteed due to potential input errors made by NTREIS users. This market analysis does not account for all new construction home sales. If you need detailed information about recorded property sales or other public records, please contact the appropriate city or county office.
Prosper, TX Real Estate: A Comprehensive Analysis of the 2021 Single-Family Residential Housing Market
The 2021 real estate market in Prosper, Texas continued to evolve under the influence of the second year of COVID-19. While societal adjustments to the pandemic became more normalized, shifting buyer priorities and continued economic fluctuations left a significant impact. Supply chain restrictions curtailed new construction, but demand surged for existing homes, resulting in sharply rising prices and quicker sales.
Key Takeaways and Trends from the 2021 Real Estate Market in Prosper, TX
1. Pricing Range
Home prices in 2021 ranged from $250,500 to a remarkable $4,950,000, highlighting a broad spectrum of options for buyers. The lower price points suggested accessibility for certain buyers, while the high-end luxury segment showcased opulent living in exclusive locations.
2. Market Efficiency
With an average DOM of just 19 days, properties sold exceptionally quickly in 2021. This reflects a highly competitive, fast-paced market. The ClsPr/LstPr ratio of 103.75% reveals that buyers often exceeded listing prices, driven by limited inventory and intense demand.
3. Unique Outliers
The most expensive property sold stood as a hallmark of luxury and uniqueness. Its extensive custom features, over 29,000 square feet of space, and exclusive community amenities showcased unparalleled opulence. This outlier emphasized the demand for premium properties catering to affluent buyers.
4. Mortgage Rates Impact
In 2021, the average 30-year fixed mortgage rate dropped to an unprecedented 3.15%. This historically low rate enabled buyers to extend their budgets, intensifying competition and driving up home prices despite the limited housing supply. As a result, Mortgage Pre-approval became essential for homebuyers, effectively serving as the standard requirement to have their offers considered.
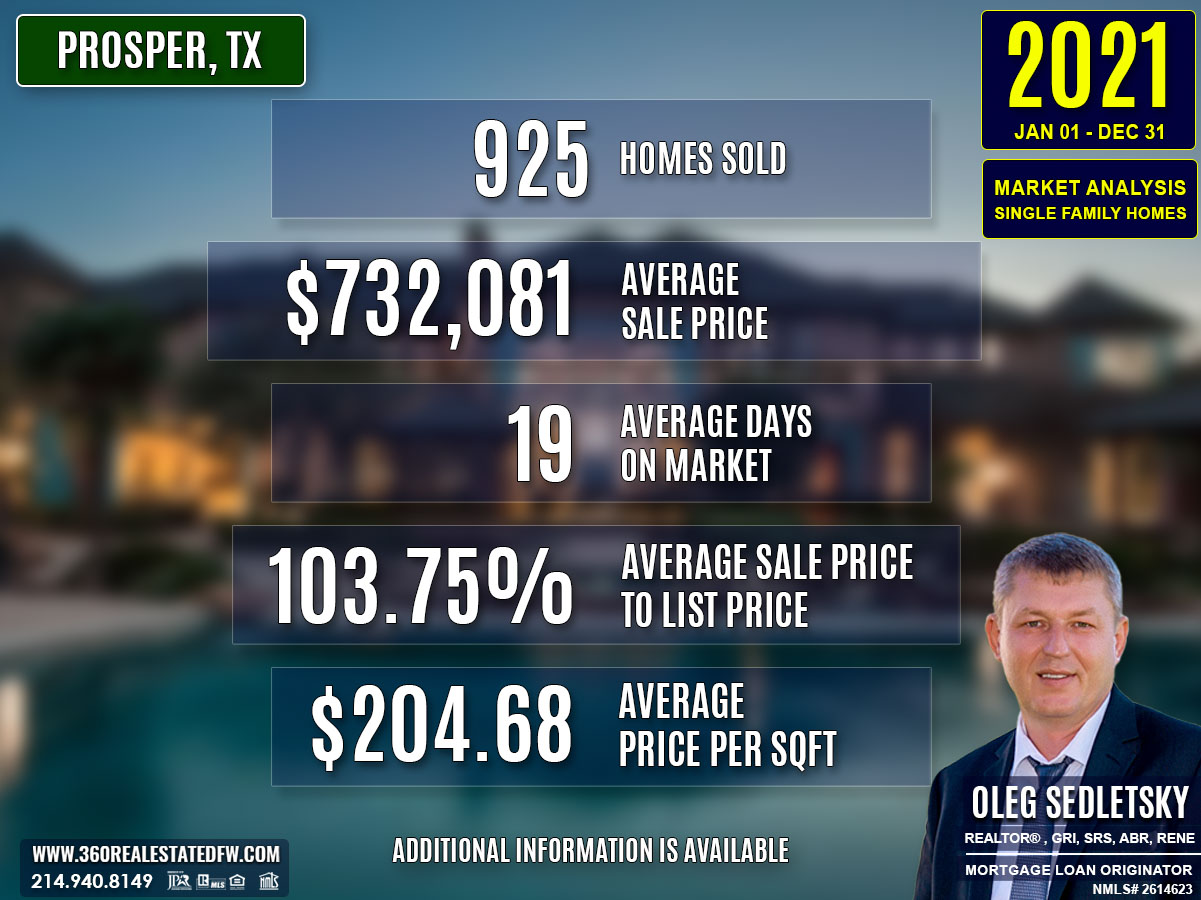
Total Homes Closed
A total of 925 homes closed in 2021, reflecting a slight cooling in quantity from prior years but an increase in quality and value.
- New Construction Homes: 177, a significant drop due to pandemic-related disruptions.
- Homes with Pools: 219, showing a steady demand for properties with leisure-focused amenities.
Property Pricing Insights
- Minimum Price: $250,500
- Maximum Price: $4,950,000
- Average Price: $732,081
- Median Price: $670,000
The price distribution demonstrated a market primarily skewed toward mid-to-high range buyers, with significant activity in the upper segments reflecting the region’s affluent demographics.
Property Size and Features
- Bedrooms: Ranged from 2 to 9; most homes averaged 4 bedrooms.
- Bathrooms: Properties included between 1 and 11 baths, with the most common being 4 bathrooms.
- Square Footage: Homes varied between 1,170 sqft and 29,122 sqft, with an average of 3,554 sqft.
- Lot Size: Ranged from modest plots to grand estates spanning nearly 6 acres (.349 average).
Market Dynamics
- Days on Market (DOM): Properties sold in as little as 5 days on average, with an exceptional example closing in 0 days. The average DOM of 19 days reflected remarkable market efficiency.
- ClsPr/LstPr Ratio: 103.75%, underscoring bidding wars and strong buyer resolve.
- ClsPr/OLP (Close Price to Original Listing Price) Ratio: 220.17%, reflecting significant price adjustments and the high premiums buyers were willing to pay.
- Average Price per Square Foot: $204.68, the highest in recent years.
Insights into the Most Expensive Prosper, TX Property Sold in 2021
The pinnacle of Prosper, TX real estate in 2021 was an extraordinary luxury estate priced at $4,950,000. Nestled on nearly 6 acres in a prestigious gated community, this property epitomized opulence and entertainment-ready design.
- Price: $4,950,000
- Beds/Baths: 9 beds, 11 baths (10 full, 1 half)
- Square Footage: 29,122 sqft
- Price per Square Foot: $169.97
- Lot Size: ~6 acres
- DOM: 278 days
- ClsPr/LstPr Ratio: 100%
- ClsPr/OLP Ratio: 66%
- Year Built: 1999
This property featured unparalleled amenities, such as:
- A motor court with 12 garages equipped for boats and RVs.
- Full indoor basketball court, bowling alley, heated pool, and sauna.
- Master suite with a 3,000 sqft closet, kitchenette, and opulent master bath.
Such properties contribute significantly to the prestige of Prosper’s real estate market, attracting high-net-worth individuals and enhancing the city’s reputation as an affluent enclave. However, the extended DOM highlights the niche audience for ultra-luxury homes.
Economic context
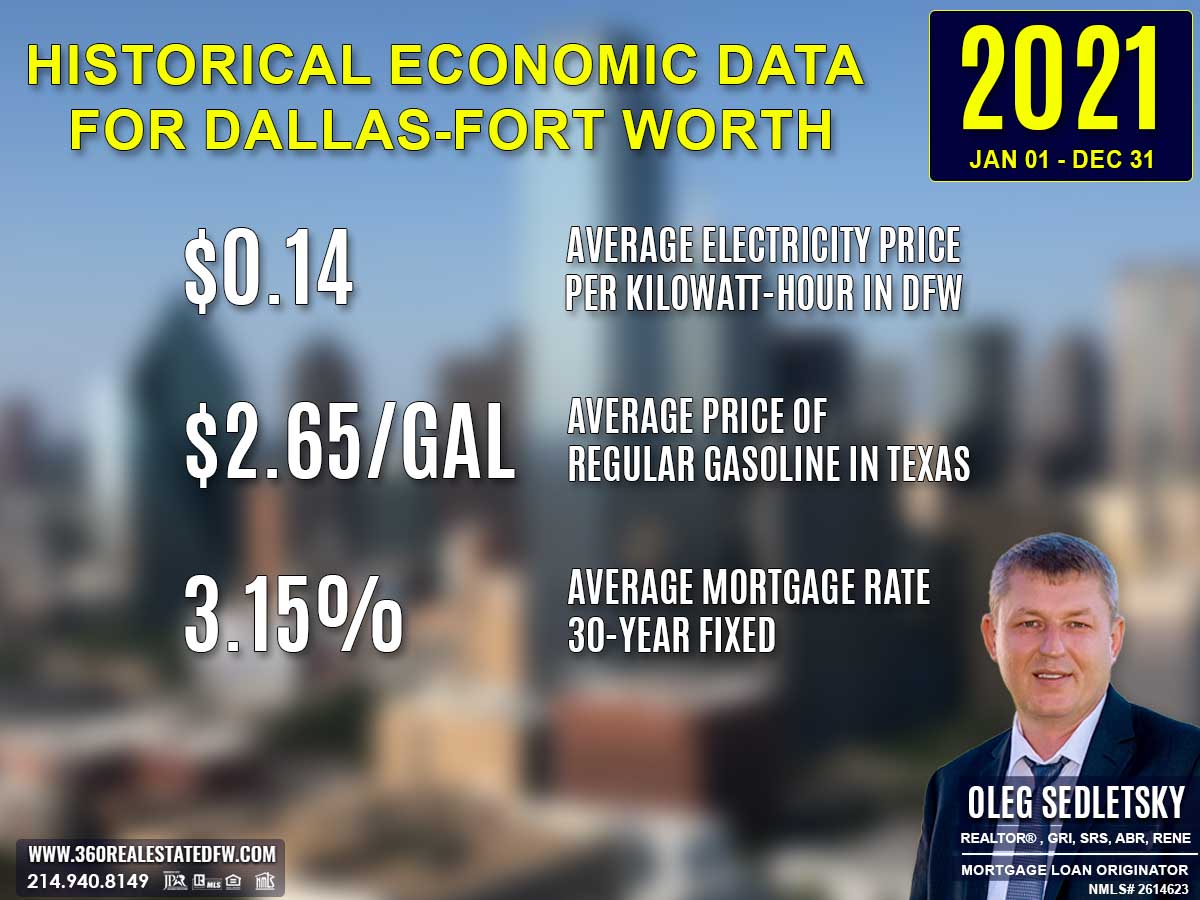
Average Electricity Costs in Dallas-Fort Worth in 2021
Electricity prices rose again to $0.14 per kilowatt-hour in 2021, up from $0.13 in 2020. This upward trend in energy costs likely pushed buyers to prioritize homes with efficient heating and cooling systems. Green-certified homes may have seen increased interest as buyers sought to offset higher utility bills.
Average Price for Regular Gasoline in Texas in 2021
Gas prices climbed to $2.65 per gallon in 2021, up from $1.82 in the prior year. This sharp increase put pressure on household budgets, especially for buyers with long commutes. Urban properties or homes in transit-accessible locations likely became more appealing as buyers aimed to minimize transportation expenses.
Average 30-Year Fixed Mortgage Rate in 2021
The average 30-year fixed mortgage rate dropped slightly to 3.15% in 2021, down from 3.38% in 2020. This decline further fueled homebuying demand, making mortgages more affordable despite rising home prices. Potential homebuyers were strongly advised to secure pre-approval through local mortgage loan originators to enhance their financial readiness during highly competitive conditions.
Curious about today’s mortgage rates and the home you can comfortably afford?
Submit a no-obligation mortgage application today and get pre-approved to determine your budget and take the first step toward homeownership with confidence.
Overview of Differences Between the 2020 and 2021 Real Estate Markets in Prosper, Texas
1. Total Homes Sold
- 2021: 925 homes sold
- 2020: 1,226 homes sold
Difference: Decrease of 301 homes, indicating a contraction in overall market activity.
2. Average Sales Price
- 2021: $732,081
- 2020: $559,224
Difference: Increase of $172,857 or 30.9%, reflecting rising home values despite fewer transactions.
3. Average Price per Square Foot
- 2021: $204.68
- 2020: $156.97
Difference: Increase of $47.71 per sqft, highlighting a significant appreciation in price efficiency.
4. Average Days on Market (DOM)
- 2021: 19 days
- 2020: 66 days
Difference: Improvement of 47 days, showing heightened market velocity and stronger demand for available homes.
5. Close Price to Listing Price (ClsPr/LstPr) Ratio
- 2021: 103.75%
- 2020: 97.76%
Difference: Increase of 5.99%, indicating competitive bidding and buyers paying more than listing prices on average.
6. Homes with Pools
- 2021: 219 homes
- 2020: 212 homes
Difference: Increase of 7 homes, showing consistent demand for leisure-focused amenities.
7. New Construction Homes
- 2021: 177 homes
- 2020: 482 homes
Difference: Decline of 305 homes, suggesting supply chain challenges and reduced development during the second pandemic year.
8. Most Expensive Property Sold
- 2021: $4,950,000 (29,122 sqft, ~6 acres, 9 beds, 11 baths, luxury-exclusive features)
- 2020: $1,950,000 (6,070 sqft, 6.5 acres, 7 beds, 6 baths, multi-generational amenities)
Difference: Increase of $3,000,000 in sale price, with a significantly larger property and exceptional luxury appeal dominating the high-end market.
Trends and Insights
The 2021 market experienced rising home values, faster sales, and heightened demand despite reduced inventory. Financially capable buyers competed fiercely, as reflected in higher closing prices relative to listing prices and shorter timeframes on the market. On the other hand, new construction has slowed considerably, hindered by supply chain disruptions and limited availability of construction crews, further exacerbating the strain on housing supply. Buyers continued to favor properties with pools and luxury features, while top-end sales reached remarkable levels, setting new benchmarks for the Prosper, TX market.
Summary of Real Estate Market Analysis for Prosper, TX in 2021
The 2021 real estate market in Prosper, Texas was a year of swift changes, driven by continued impacts from the second year of the COVID-19 pandemic. HomeBuyers competed fiercely in a low-inventory environment, driving up home prices and reducing days on the market to record lows. Despite challenges, the market demonstrated resilience and adaptability, shaped by shifting buyer preferences, historically low mortgage rates, and the ongoing need for versatile and comfortable living spaces.
Homebuyers and First-Time Homebuyers Perspective
For homebuyers, especially first-time buyers, navigating Prosper’s fast-moving market in 2021 posed significant challenges. Mortgage pre-approval became essential, ensuring buyers were financially prepared to make quick, decisive offers in a highly competitive environment. Additionally, working with a seasoned Realtor proved invaluable. Realtors not only guided buyers through market nuances but also offered the insights needed to identify the right home in the most favorable terms. For first-time buyers, 2021 underscored the importance of understanding financial readiness and leveraging expert advice to secure opportunities amidst fierce competition.
Home-Sellers Perspective
For home sellers, 2021 was a remarkably favorable year, with properties often selling above the asking price and in record time. However, many sellers experienced regret, particularly those who chose not to work with real estate professionals. Without proper marketing strategies, these homes often sold for far less than their full potential. Preparing a home for sale and maximizing its value requires the expertise and strategic approach of a knowledgeable Realtor.
Reflecting on the 2021 Prosper real estate market, it’s evident that Realtors were instrumental in helping sellers achieve success. They offered customized marketing plans, accurate pricing advice, and valuable insights into market trends. By leveraging this expertise, sellers were able to navigate the process smoothly, ensuring their homes stood out to motivated buyers. Professional marketing played a crucial role in securing quick, profitable sales and maximizing outcomes for homeowners.
Final Thoughts
Whether buying or selling, the 2021 real estate market in Prosper, TX demanded informed decision-making and strategic guidance. Homebuyers benefited from expert advice to act quickly in a saturated and competitive market, while sellers thrived with a professional real estate advisor who could optimize their sales strategy. To navigate the intricate dynamics of real estate effectively, partnering with a knowledgeable realtor was imperative for both groups. The year’s trends highlighted the value a committed and experienced agent brings to every transaction.
The Importance of Statistical Data in Prosper, Texas Real Estate Market
Did you know that Appraisers and Realtors rely on historical statistical data to determine a property’s current value?
The data above is just the beginning. This glimpse into the Prosper, Texas real estate market outlines trends but doesn’t capture the full picture. To truly understand the city’s housing market, you’ll need specific insights like zip code analyses, neighborhood breakdowns, and school-district-focused data. Historical trends and comprehensive analyses arm both homebuyers and home sellers with the tools they need to make decisions confidently.
The insights on this page represent just a small part of the comprehensive real estate services I provide to my clients. Whether you’re a buyer aiming to find your dream home or a seller looking to maximize your property’s value, I provide data-backed strategies tailored to your goals.
Reach out today—I’d love to help you achieve success in Prosper’s vibrant housing market!
Unlock Exceptional Service!
Assistance with all your real estate needs in the Dallas-Fort Worth area is just a click or call away. Reach out at 214-940-8149 or connect through the links below.
Meet Your Trusted Realtor and Mortgage Expert in Prosper, Texas!
Oleg Sedletsky REALTOR® in Prosper, Texas. Call/Text 214.940.8149
Greetings! I’m Oleg Sedletsky, and I’m excited to introduce myself as your go-to full-time licensed Texas REALTOR® and Mortgage Loan Originator.
I proudly represent JPAR® – Real Estate Brokerage as a REALTOR® and Utopia Mortgage LLC as a Mortgage Loan Originator! My designations and certifications reflect my dedication to helping you achieve your real estate goals in Prosper, TX and other locations in the vibrant Dallas-Fort Worth area!
With my expertise, I’ll provide you with in-depth resources, including detailed market reports and historical data, to help you make confident, well-informed decisions. Fluent in English, Ukrainian, and Russian, I’m here to guide you through every step of the process with personalized support and dedication.
It’s All About You and Your Real Estate Goals!
My mission is to serve you! With my knowledge and expertise, I’m here to help you achieve all your real estate goals!
I’m passionate about helping homebuyers and home-sellers navigate the exciting real estate landscape in Prosper, Texas! Whether you’re searching for your dream home, exploring land options, or looking for commercial properties, my Real Estate Services have you covered.
Contact me today for all your real estate needs in Prosper, Texas! Call/text 214-940-8149
A Comprehensive Analysis of Single-Family Residential Housing Market in Prosper, TX: 2010 to Present
Discover the trends, stats, and insights shaping Prosper’s real estate market year by year!
2010-2020
Prosper, TX Real Estate Market Report 2010: Analysis and Trends
Prosper, TX Real Estate Market Report 2011: Analysis and Trends
Prosper, TX Real Estate Market Report 2012: Analysis and Trends
Prosper, TX Real Estate Market Report 2013: Analysis and Trends
Prosper, TX Real Estate Market Report 2014: Analysis and Trends
Prosper, TX Real Estate Market Report 2015: Analysis and Trends
Prosper, TX Real Estate Market Report 2016: Analysis and Trends
Prosper, TX Real Estate Market Report 2017: Analysis and Trends
Prosper, TX Real Estate Market Report 2018: Analysis and Trends
Prosper, TX Real Estate Market Report 2019: Analysis and Trends
Prosper, TX Real Estate Market Report 2020: Analysis and Trends
This market analysis is intended solely for educational purposes. This market analysis is based on data sourced from NTREIS, Inc. This analysis is exclusively focused on single-family homes and does not account for other property types. The total number of real estate transactions within the specified period and location may vary. Data accuracy cannot be guaranteed due to potential input errors made by NTREIS users. This market analysis does not account for all new construction home sales. If you need detailed information about recorded property sales or other public records, please contact the appropriate city or county office.
Prosper, TX Real Estate: A Comprehensive Analysis of the 2020 Single-Family Residential Housing Market
The 2020 real estate market in Prosper, Texas was shaped by the unprecedented challenges of the COVID-19 pandemic. Despite the global turmoil, the housing market remained resilient, bolstered by historically low mortgage rates and growing buyer demand. Many homebuyers sought larger homes and properties with outdoor amenities, reflecting a shift toward prioritizing space and comfort during periods of lockdown. These factors drove a substantial increase in transactions and prices, confirming Prosper’s stability as a desirable residential market.
Key Takeaways and Trends from the 2020 Real Estate Market in Prosper, TX
1. Pricing Range
The price range spanned from a modest $142,500 for an entry-level home to $1,950,000 for a luxury estate, displaying the wide variety of options available. This broad range catered to first-time homebuyers and affluent homebuyers.
2. Market Efficiency
The average DOM dropped to 66 days, showcasing improved market efficiency compared to previous years. Sellers achieved a higher ClsPr/LstPr ratio of 97.76%, indicating accurate pricing strategies and strong demand.
3. Unique Outliers
The most expensive home sold, a 7-bedroom property with sprawling acreage and exquisite features, signified continued demand for high-end properties. Meanwhile, COVID-19 motivated more families to seek homes with pools, contributing to a rise in pool-equipped home sales.
4. Mortgage Rates Impact
Mortgage rates fell to an average of 3.38%, historically low levels. This spurred significant buying activity by reducing borrowing costs. The affordability boost attracted many first-time buyers and investors to the market.
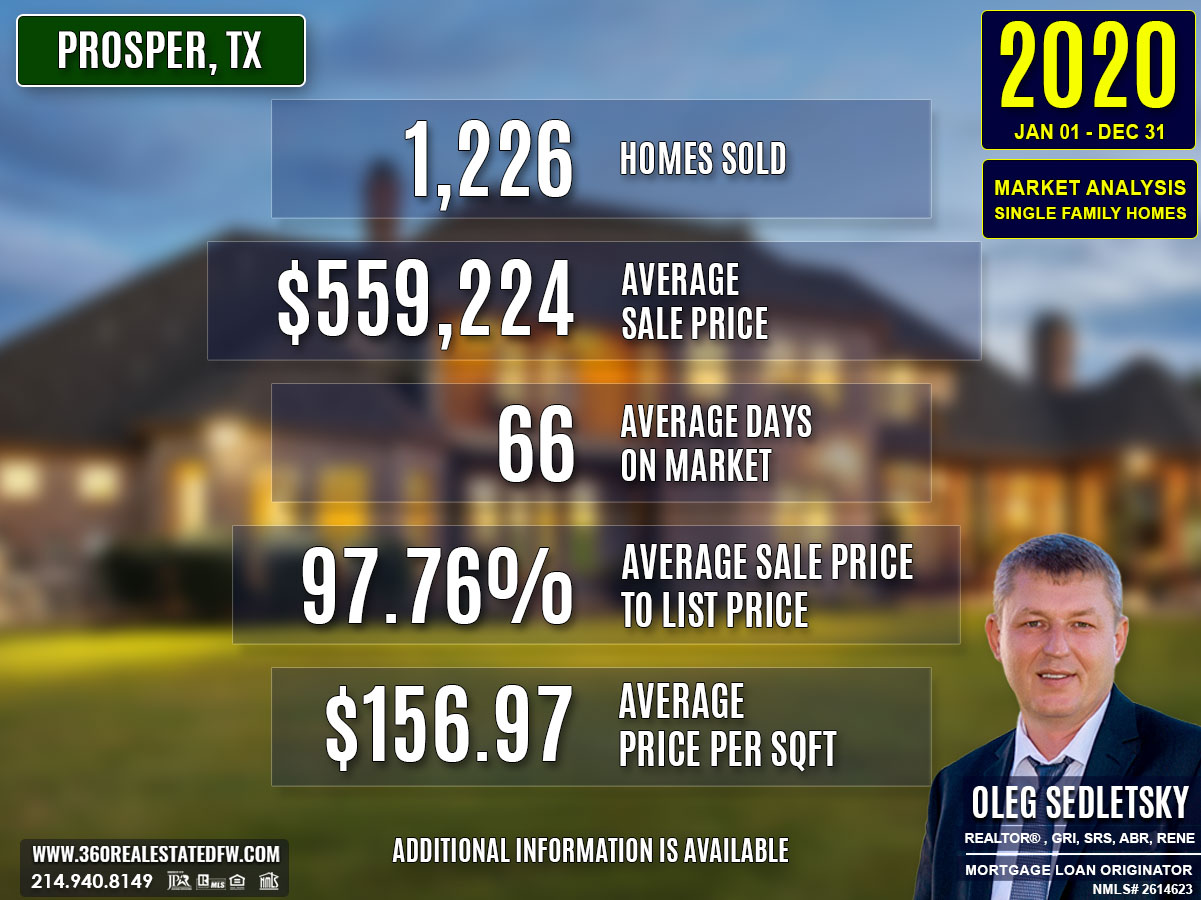
Total Homes Closed
Prosper, TX saw a total of 1,226 closed transactions in 2020, outperforming the previous year’s 1,089 sales. Among these, 212 homes featured pools, showing a rise in demand for properties with outdoor features. Additionally, 482 of the closed sales were new construction homes, slightly fewer than in 2019, possibly due to pandemic-related construction delays.
Property Pricing Insights
- Minimum Price: $142,500
- Maximum Price: $1,950,000
- Average Price: $559,224
- Median Price: $522,547
The increasing average and median prices underscored robust property appreciation, while the wide price range highlighted the market’s diversity.
Property Size and Features
- Average Bedrooms: 4
- Average Bathrooms (Full + Half): 4
- Average Square Footage: 3,552 sq. ft.
- Average Lot Size: 0.335 acres
These metrics reveal a preference for spacious, family-friendly homes with ample interior and exterior areas.
Market Dynamics
- Days on Market (DOM): 66 days
- ClsPr/LstPr Ratio: 97.76%
- ClsPr/OLP Ratio: 96.50%
- Average Price per Square Foot: $156.97
The shortened DOM and higher pricing ratios reflect an increasingly competitive market environment, with home buyers acting quickly to secure valuable properties.
Insights into the Most Expensive Prosper, TX Property Sold in 2020
The year’s most expensive property sale was a remarkable luxury estate, highlighting Prosper’s allure for affluent buyers. This home combined elegance, functionality, and leisure-focused features.
- Price: $1,950,000
- Beds/Baths: 7 beds / 6 baths (all full)
- Square Footage: 6,070 sq. ft.
- Price Per Square Foot: $321.25
- Lot Size: 6.544 acres
- Close Price to Listing Price (ClsPr/LstPr): 92.86%
- Close Price to Original Listing Price (ClsPr/OLP): 92.86%
- Days on Market (DOM): 861 days
- Year Built: 2017
This home featured a private gated entry, large pond with a fountain, waterfall, porte-cochere, a 1000 sq. ft. patio with outdoor kitchen and fire pit, and multi-generational living quarters. Its sale exemplified the sustained interest in high-end properties with expansive land and unique amenities. Despite its lengthy time on the market, it underscored the value of exceptional real estate in Prosper, Texas.
Economic context
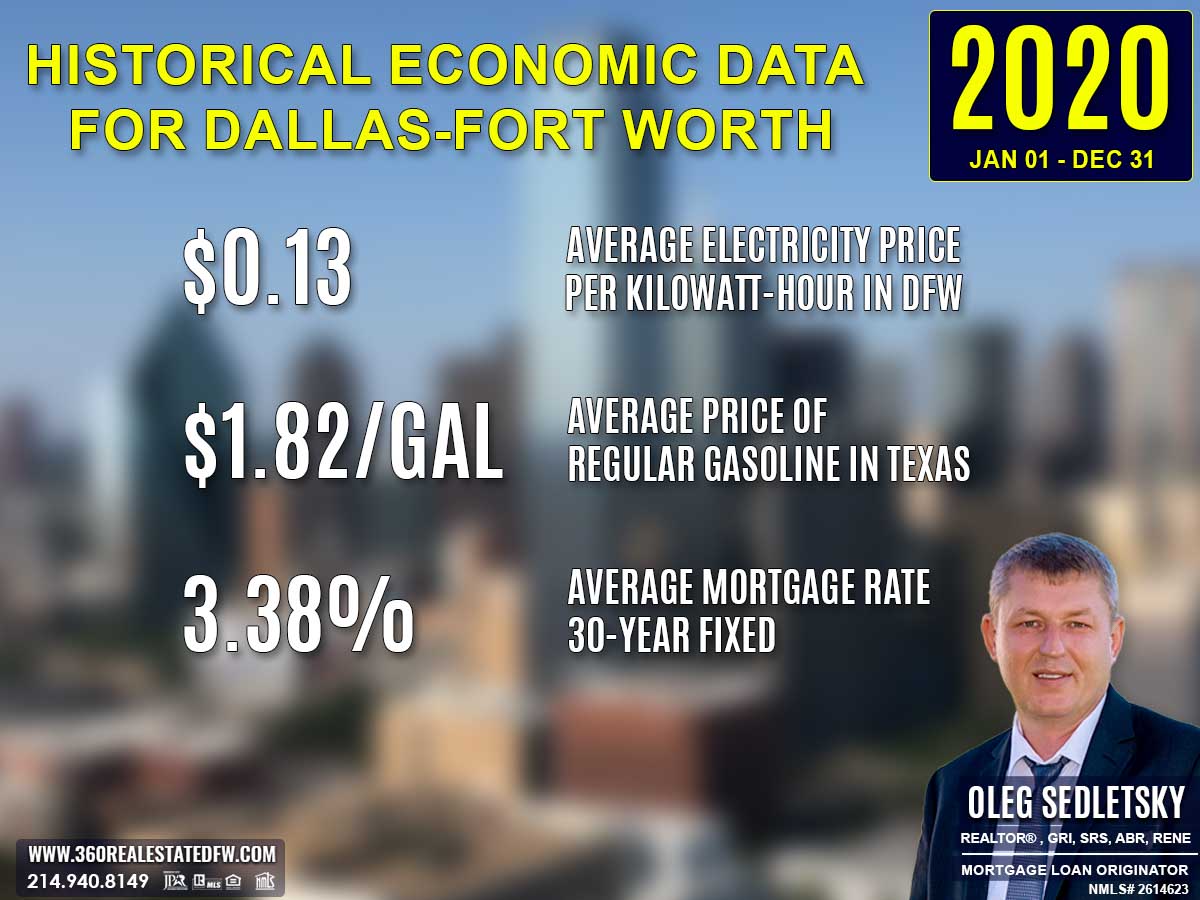
Average Electricity Costs in Dallas-Fort Worth in 2020
Electricity prices returned to $0.13 per kilowatt-hour in 2020, slightly lower than 2019’s $0.14. This small decrease might have supported household budgets as the economy faced numerous uncertainties. Energy savings further highlighted the appeal of efficient homes, adding value to sustainable designs and energy-conscious upgrades.
Average Price for Regular Gasoline in Texas in 2020
Gas prices dipped to $1.82 per gallon in 2020, down significantly from $2.29 in 2019. Lower transportation costs provided financial relief to homebuyers, potentially boosting interest in suburban and rural areas where homes were larger and more affordable. The drop in gas prices gave buyers more flexibility in location choices.
Average 30-Year Fixed Mortgage Rate in 2020
Mortgage rates averaged just 3.38% in 2020, a steep drop from 4.13% the previous year. This marked an historic low, attracting a surge of homebuyers eager to lock in affordable financing. Pre-approval with local mortgage loan originators became an essential first step as buyers navigated increased competition in a hot market.
Curious about today’s mortgage rates and the home you can comfortably afford?
Submit a no-obligation mortgage application today and get pre-approved to determine your budget and take the first step toward homeownership with confidence.
Overview of Differences Between the 2019 and 2020 Real Estate Markets in Prosper, Texas
1. Total Homes Sold
- 2020: 1,226 homes sold
- 2019: 1,089 homes sold
Difference: Increase of 137 homes, indicating robust demand despite pandemic challenges.
2. Average Sales Price
- 2020: $559,224
- 2019: $525,621
Difference: Increase of $33,603, showcasing property value appreciation.
3. Average Price Per Square Foot
- 2020: $156.97
- 2019: $146.98
Difference: Increase of $9.99 per sq. ft., reflecting higher buyer willingness to pay for quality or features.
4. Average Days on Market (DOM)
- 2020: 66 days
- 2019: 93 days
Difference: Homes sold 27 days faster on average in 2020, indicating a more competitive market.
5. Close Price to Listing Price (ClsPr/LstPr) Ratio
- 2020: 97.76%
- 2019: 96.70%
Difference: Slight 1.06% improvement, signaling stronger alignment between seller expectations and buyer offers.
6. Homes with Pools
- 2020: 212 homes
- 2019: 150 homes
Difference: 62 more homes with pools sold in 2020, driven by increased demand for outdoor and leisure amenities.
7. New Construction Homes
- 2020: 482 homes
- 2019: 579 homes
Difference: Decrease of 97 homes, likely due to supply chain disruptions caused by the pandemic.
8. Most Expensive Property Sold
- 2020: $1,950,000 (7 beds, 6 baths, 6,070 sq. ft. on 6.5 acres, with high-end features like a gated entry, outdoor kitchen, and multi-generational living quarters).
- 2019: $3,044,000 (5 beds, 7 baths, 9,016 sq. ft. on 7 acres, with a pool, spa, and tornado shelter).
Difference: The 2020 sale was $1,094,000 lower and smaller in size but represented a shift towards properties emphasizing multi-functional spaces.
Summary of Real Estate Market Analysis for Prosper, TX in 2020
The 2020 real estate market in Prosper, Texas demonstrated resilience in the face of upheaval caused by the global pandemic. COVID-19 reshaped priorities for homebuyers, with many seeking larger spaces and enhanced amenities. With a low average mortgage rate of 3.38%, buyer activity surged, leading to record sales and rising property prices. This dynamic market proved both rewarding and challenging for buyers and sellers as they navigated changing conditions and heightened competition.
Homebuyers and First-Time Homebuyers Perspective
For home buyers, especially first-time homebuyers, 2020 underscored the significance of preparation. Low mortgage rates made ownership more attainable, but competition and rising prices required buyers to act swiftly. Mortgage pre-approval was a vital step, allowing homebuyers to define their budget and strengthen their offers. Partnering with an experienced and knowledgeable Realtor was equally crucial in navigating Prosper’s competitive market. Realtors provided guidance, access to listings, and negotiation expertise to help buyers secure their dream homes amid the year’s unique challenges.
Home-Sellers Perspective
In 2020, home sellers benefited from surging demand, often leading to multiple offers on their properties. Despite this favorable market, 97% of sellers choose to work with a Realtor, relying on their expertise to ensure a successful sale and achieve the best possible value for their homes. Realtors played a key role in strategic pricing and targeted marketing, ensuring properties attracted the right buyers quickly. While the COVID-19 pandemic brought uncertainty, Prosper’s real estate market remained resilient, further bolstering seller confidence.
Final Thoughts
The 2020 real estate market illuminated the importance of adaptability and professional expertise. Both homebuyers and sellers faced unique opportunities and challenges, and collaboration with a skilled Realtor ensured they achieved their real estate goals with ease. Whether navigating bidding wars or pricing a home for maximum appeal, working with a realtor proved invaluable in this exceptional year.
The Importance of Statistical Data in Prosper, Texas Real Estate Market
Did you know that Appraisers and Realtors rely on historical statistical data to determine a property’s current value?
The data above is just the beginning. This glimpse into the Prosper, Texas real estate market outlines trends but doesn’t capture the full picture. To truly understand the city’s housing market, you’ll need specific insights like zip code analyses, neighborhood breakdowns, and school-district-focused data. Historical trends and comprehensive analyses arm both homebuyers and home sellers with the tools they need to make decisions confidently.
The insights on this page represent just a small part of the comprehensive real estate services I provide to my clients. Whether you’re a buyer aiming to find your dream home or a seller looking to maximize your property’s value, I provide data-backed strategies tailored to your goals.
Reach out today—I’d love to help you achieve success in Prosper’s vibrant housing market!
Unlock Exceptional Service!
Assistance with all your real estate needs in the Dallas-Fort Worth area is just a click or call away. Reach out at 214-940-8149 or connect through the links below.
Meet Your Trusted Realtor and Mortgage Expert in Prosper, Texas!
Oleg Sedletsky REALTOR® in Prosper, Texas. Call/Text 214.940.8149
Greetings! I’m Oleg Sedletsky, and I’m excited to introduce myself as your go-to full-time licensed Texas REALTOR® and Mortgage Loan Originator.
I proudly represent JPAR® – Real Estate Brokerage as a REALTOR® and Utopia Mortgage LLC as a Mortgage Loan Originator! My designations and certifications reflect my dedication to helping you achieve your real estate goals in Prosper, TX and other locations in the vibrant Dallas-Fort Worth area!
With my expertise, I’ll provide you with in-depth resources, including detailed market reports and historical data, to help you make confident, well-informed decisions. Fluent in English, Ukrainian, and Russian, I’m here to guide you through every step of the process with personalized support and dedication.
It’s All About You and Your Real Estate Goals!
My mission is to serve you! With my knowledge and expertise, I’m here to help you achieve all your real estate goals!
I’m passionate about helping homebuyers and home-sellers navigate the exciting real estate landscape in Prosper, Texas! Whether you’re searching for your dream home, exploring land options, or looking for commercial properties, my Real Estate Services have you covered.
Contact me today for all your real estate needs in Prosper, Texas! Call/text 214-940-8149
A Comprehensive Analysis of Single-Family Residential Housing Market in Prosper, TX: 2010 to Present
Discover the trends, stats, and insights shaping Prosper’s real estate market year by year!
2010-2020
Prosper, TX Real Estate Market Report 2010: Analysis and Trends
Prosper, TX Real Estate Market Report 2011: Analysis and Trends
Prosper, TX Real Estate Market Report 2012: Analysis and Trends
Prosper, TX Real Estate Market Report 2013: Analysis and Trends
Prosper, TX Real Estate Market Report 2014: Analysis and Trends
Prosper, TX Real Estate Market Report 2015: Analysis and Trends
Prosper, TX Real Estate Market Report 2016: Analysis and Trends
Prosper, TX Real Estate Market Report 2017: Analysis and Trends
Prosper, TX Real Estate Market Report 2018: Analysis and Trends
Prosper, TX Real Estate Market Report 2019: Analysis and Trends
Prosper, TX Real Estate Market Report 2020: Analysis and Trends
This market analysis is intended solely for educational purposes. This market analysis is based on data sourced from NTREIS, Inc. This analysis is exclusively focused on single-family homes and does not account for other property types. The total number of real estate transactions within the specified period and location may vary. Data accuracy cannot be guaranteed due to potential input errors made by NTREIS users. This market analysis does not account for all new construction home sales. If you need detailed information about recorded property sales or other public records, please contact the appropriate city or county office.
Prosper, TX Real Estate: A Comprehensive Analysis of the 2019 Single-Family Residential Housing Market
The 2019 real estate market in Prosper, Texas experienced notable growth and shifting dynamics. With 1,089 closed transactions, the market saw increased activity compared to prior years. Property values climbed modestly, while demand for larger homes with unique amenities such as pools remained steady. Developers continued to fuel inventory growth with nearly 580 new construction homes, marking the year as one of robust opportunity for homebuyers and home sellers
Key Takeaways and Trends from the 2019 Real Estate Market in Prosper, TX
1. Pricing Range
Home prices in Prosper ranged widely, with the most affordable property sold at $200,000 and the most expensive reaching $3,044,000. This price diversity reflects the city’s ability to cater to a broad spectrum of buyers.
2. Market Efficiency
The average DOM increased slightly to 93 days, a shift from the faster-paced 83 days in 2018. However, the ClsPr/LstPr ratio remained stable at 96.70%, demonstrating a still-efficient market where most homes sold close to their listed price.
3. Unique Outliers
The luxury sector took the limelight, with a custom-built property on seven acres selling for over $3 million. Features such as a safe room, pool, and 6-car garage offered a glimpse into Prosper’s high-end market segment and buyer preferences.
4. Mortgage Rates Impact
With an average 30-year fixed mortgage rate of 4.13%, slightly lower than 2018, buyers benefited from enhanced affordability. This likely contributed to the increased home sales and property investments in the city.
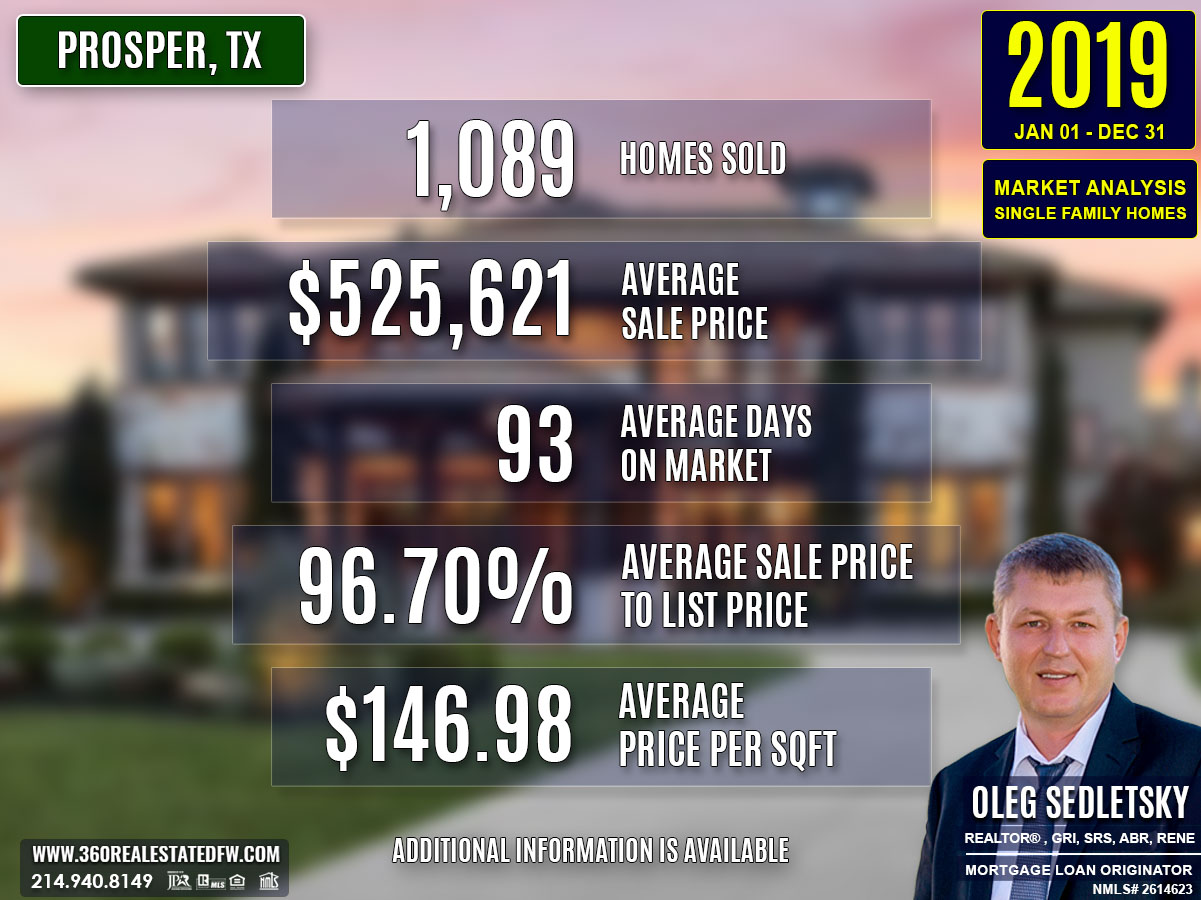
Total Homes Closed
A total of 1,089 residential single-family homes closed in 2019. Of these, 579 were new construction homes, reflecting the city’s ongoing development. Additionally, 150 homes with pools were sold, underscoring the appeal of lifestyle-oriented properties.
Property Pricing Insights
- Minimum Price: $200,000
- Maximum Price: $3,044,000
- Average Price: $525,621
- Median Price: $485,326
This gradual increase in average pricing highlights the sustained value appreciation in Prosper’s real estate market.
Property Size and Features
Homes sold in 2019 featured a mix of layouts and lot sizes:
- Bedrooms: Ranged from 1 to 6
- Bathrooms: 1 to 8, with a mix of full and half-baths
- Square Footage: From 1,091 sq. ft. to 9,016 sq. ft., with an average of 3,551 sq. ft.
- Lot Size varied significantly, with premium lots contributing substantially to a property’s appeal.
These metrics reflect Prosper’s growing inventory of spacious homes designed to align with buyers’ preferences for size and comfort.
Market Dynamics
- Days on Market (DOM): 93 days on average, signaling a balanced market with healthy turnover.
- ClsPr/LstPr Ratio: 96.70%, affirming that sellers priced their homes competitively.
- ClsPr/OLP Ratio: 93.99%, slightly lower than ClsPr/LstPr, likely due to homes with price reductions.
- Average Price per Square Foot: $146.98, showcasing an incremental rise in property values.
Insights into the Most Expensive Prosper, TX Property Sold in 2019
The most expensive property sold in Prosper in 2019 was a unique custom-built home that epitomized luxury and exclusivity.
- Price: $3,044,000
- Beds: 5
- Baths: 7 (5 full, 2 half)
- Square Footage: 9,016 sq. ft.
- Price per Square Foot: $337.62
- Lot Size Area: 7.193 acres
- Days on Market (DOM): 20 days
- ClsPr/LstPr Ratio: 95.57%
- ClsPr/OLP Ratio: 95.57%
- Year Built: 2012
This property boasted amenities like a pool and spa, a tornado shelter, and a 6-car garage with a workshop. Its quick sale in just 20 days, despite the high price tag, demonstrates the strong appeal of unique, feature-rich properties in Prosper’s luxury market.
The sale of this high-value property contributed to raising the average pricing metrics for 2019 and highlighted the continued demand for luxury homes with unmatched amenities. These outliers reinforce the importance of Prosper, TX as a hub for diverse buyer interests.
Economic context

Average Electricity Costs in Dallas-Fort Worth in 2019
The average electricity price in 2019 climbed to $0.14 per kilowatt-hour, up from $0.13 in 2018. This uptick added some pressure on household budgets, further solidifying the need for energy-efficient homes. Properties featuring solar panels or smart home technologies likely gained value as homebuyers sought ways to mitigate rising energy expenses.
Average Price for Regular Gasoline in Texas in 2019
Gas prices fell slightly to $2.29 per gallon in 2019, down from $2.44 in 2018. This small decline brought modest relief to transportation costs and may have encouraged suburban home purchases, where commuting distances tend to be longer. Homebuyers likely balanced fuel costs with home prices when making location decisions.
Average 30-Year Fixed Mortgage Rate in 2019
Mortgage rates averaged 4.13% in 2019, down from 4.70% the year before. This noticeable decline made homeownership more attainable for many homebuyers and likely spurred activity in the housing market. Pre-approvals through local mortgage loan originators remained key for buyers wanting to confidently pursue homes amid favorable rate conditions.
Curious about today’s mortgage rates and the home you can comfortably afford?
Submit a no-obligation mortgage application today and get pre-approved to determine your budget and take the first step toward homeownership with confidence.
Overview of Differences Between the 2018 and 2019 Real Estate Markets in Prosper, Texas
1. Total Homes Sold
2019 recorded 1,089 homes closed, which is an increase of 117 homes compared to 972 in 2018.
2. Average Sales Price
The average sales price rose to $525,621 in 2019, up by $29,948 from $495,673 in 2018, reflecting a continuation of property value growth.
3. Average Price per Square Foot
The average price per square foot increased slightly from $143.23 in 2018 to $146.98 in 2019, showing a modest gain in price per space.
4. Average Days on Market (DOM)
Homes in 2019 spent 93 days on market, which is an uptick of 10 days compared to 83 days in 2018, indicating a slower pace of sales.
5. Close Price to Listing Price (ClsPr/LstPr) Ratio
The ClsPr/LstPr ratio was 96.70% in 2019, slightly higher than 96.26% in 2018, signaling stronger pricing accuracy by sellers.
6. Homes with Pools
Pool-equipped homes saw a slight decline, with 150 sold in 2019, down from 157 in 2018.
7. New Construction Homes
New construction activity gained momentum, rising to 579 homes in 2019, an increase of 55 homes from 524 in 2018.
8. Most Expensive Property Sold
2019: The most expensive property sold for $3,044,000, a custom-built home on 7 acres with 9,016 sq. ft., featuring luxury amenities like a pool, spa, tornado shelter, and 6-car garage.
2018: The top sale was $2,150,000, for a 9,004 sq. ft. home on 3.3 acres, with a pool and scenic views.
The 2019 property not only had a higher sale price but also larger acreage and more premium features, marking an expansion in Prosper’s luxury market.
Summary of Real Estate Market Analysis for Prosper, TX in 2019
The 2019 real estate market in Prosper, Texas showcased vibrant activity with a growing number of transactions, steady price appreciation, and a continued demand for diverse property types. From new construction homes to feature-laden luxury properties, the year reaffirmed Prosper’s versatility as a housing market catering to a wide range of homebuyers and sellers. Stable mortgage rates and a slight increase in Days on Market reflected a balanced market ripe with opportunities for both participants.
Homebuyers and First-Time Homebuyers Perspective
For homebuyers, 2019 underscored the importance of preparation, especially for first-time homebuyers entering an active market. Securing mortgage pre-approval emerged as a crucial step in standing out as a serious buyer and providing clarity on budget constraints. Additionally, working with a knowledgeable realtor became even more essential, not only to identify the best opportunities but also to negotiate effectively in a market where properties were moving steadily. First-time buyers, in particular, benefited from guidance on navigating the complexities of the process, including understanding pricing trends and evaluating properties based on their long-term value.
Home-Sellers Perspective
Home sellers in 2019 leaned heavily on their realtors to craft effective marketing strategies that positioned their properties competitively. From pricing the home right to staging and highlighting unique features, sellers relied on their realtor’s expertise to attract the right buyers. The ability to sell properties close to their listing prices (ClsPr/LstPr at 96.70%) and in reasonable timeframes (93 days on average) demonstrated the impact of well-executed advice and marketing. Market trends also influenced seller decisions, as smaller price reductions and confident pricing strategies reflected the steady buyer demand throughout the year.
Final Thoughts
With Prosper’s diverse offerings and stable market momentum, buyers and sellers alike were able to capitalize on opportunities, paving the way for continued growth in the city’s housing market.
The Importance of Statistical Data in Prosper, Texas Real Estate Market
Did you know that Appraisers and Realtors rely on historical statistical data to determine a property’s current value?
The data above is just the beginning. This glimpse into the Prosper, Texas real estate market outlines trends but doesn’t capture the full picture. To truly understand the city’s housing market, you’ll need specific insights like zip code analyses, neighborhood breakdowns, and school-district-focused data. Historical trends and comprehensive analyses arm both homebuyers and home sellers with the tools they need to make decisions confidently.
The insights on this page represent just a small part of the comprehensive real estate services I provide to my clients. Whether you’re a buyer aiming to find your dream home or a seller looking to maximize your property’s value, I provide data-backed strategies tailored to your goals.
Reach out today—I’d love to help you achieve success in Prosper’s vibrant housing market!
Unlock Exceptional Service!
Assistance with all your real estate needs in the Dallas-Fort Worth area is just a click or call away. Reach out at 214-940-8149 or connect through the links below.
Meet Your Trusted Realtor and Mortgage Expert in Prosper, Texas!
Oleg Sedletsky REALTOR® in Prosper, Texas. Call/Text 214.940.8149
Greetings! I’m Oleg Sedletsky, and I’m excited to introduce myself as your go-to full-time licensed Texas REALTOR® and Mortgage Loan Originator.
I proudly represent JPAR® – Real Estate Brokerage as a REALTOR® and Utopia Mortgage LLC as a Mortgage Loan Originator! My designations and certifications reflect my dedication to helping you achieve your real estate goals in Prosper, TX and other locations in the vibrant Dallas-Fort Worth area!
With my expertise, I’ll provide you with in-depth resources, including detailed market reports and historical data, to help you make confident, well-informed decisions. Fluent in English, Ukrainian, and Russian, I’m here to guide you through every step of the process with personalized support and dedication.
It’s All About You and Your Real Estate Goals!
My mission is to serve you! With my knowledge and expertise, I’m here to help you achieve all your real estate goals!
I’m passionate about helping homebuyers and home-sellers navigate the exciting real estate landscape in Prosper, Texas! Whether you’re searching for your dream home, exploring land options, or looking for commercial properties, my Real Estate Services have you covered.
Contact me today for all your real estate needs in Prosper, Texas! Call/text 214-940-8149
A Comprehensive Analysis of Single-Family Residential Housing Market in Prosper, TX: 2010 to Present
Discover the trends, stats, and insights shaping Prosper’s real estate market year by year!
2010-2020
Prosper, TX Real Estate Market Report 2010: Analysis and Trends
Prosper, TX Real Estate Market Report 2011: Analysis and Trends
Prosper, TX Real Estate Market Report 2012: Analysis and Trends
Prosper, TX Real Estate Market Report 2013: Analysis and Trends
Prosper, TX Real Estate Market Report 2014: Analysis and Trends
Prosper, TX Real Estate Market Report 2015: Analysis and Trends
Prosper, TX Real Estate Market Report 2016: Analysis and Trends
Prosper, TX Real Estate Market Report 2017: Analysis and Trends
Prosper, TX Real Estate Market Report 2018: Analysis and Trends
Prosper, TX Real Estate Market Report 2019: Analysis and Trends
Prosper, TX Real Estate Market Report 2020: Analysis and Trends
This market analysis is intended solely for educational purposes. This market analysis is based on data sourced from NTREIS, Inc. This analysis is exclusively focused on single-family homes and does not account for other property types. The total number of real estate transactions within the specified period and location may vary. Data accuracy cannot be guaranteed due to potential input errors made by NTREIS users. This market analysis does not account for all new construction home sales. If you need detailed information about recorded property sales or other public records, please contact the appropriate city or county office.
Prosper, TX Real Estate: A Comprehensive Analysis of the 2018 Single-Family Residential Housing Market
The 2018 real estate market in Prosper, Texas revealed a vibrant and dynamic environment with 972 closed sales for single-family homes. The year reflected both growth and evolving buyer preferences, with noticeable trends in pricing, home features, and market efficiency. While the average sales price increased compared to prior years, the market dynamics highlighted some unique outliers and the impact of rising mortgage rates.
Key Takeaways and Trends from the 2018 Real Estate Market in Prosper, TX
1. Pricing Range:
Homes sold in 2018 ranged from $170,000 to $2,150,000, with an average price of $495,673. The median price of $460,000 suggests broad affordability amid a competitive market.
2. Market Efficiency:
The average Days on Market (DOM) of 83 days indicates a moderate pace, with most homes closing within about two to three months. Close price to listing price ratios, averaging 96.26%, show a healthy equilibrium between buyers and sellers.
3. Unique Outliers:
The most expensive property sold at $2,150,000 stands out due to its exceptional size, luxury features, and unique location with creek and greenbelt views. These properties often skew averages in the luxury segment.
4. Mortgage Rates Impact:
The average 30-year fixed mortgage rate rose to 4.70% in 2018, higher than the previous year. This increase likely influenced affordability for homebuyers, though overall sales activity remained robust.
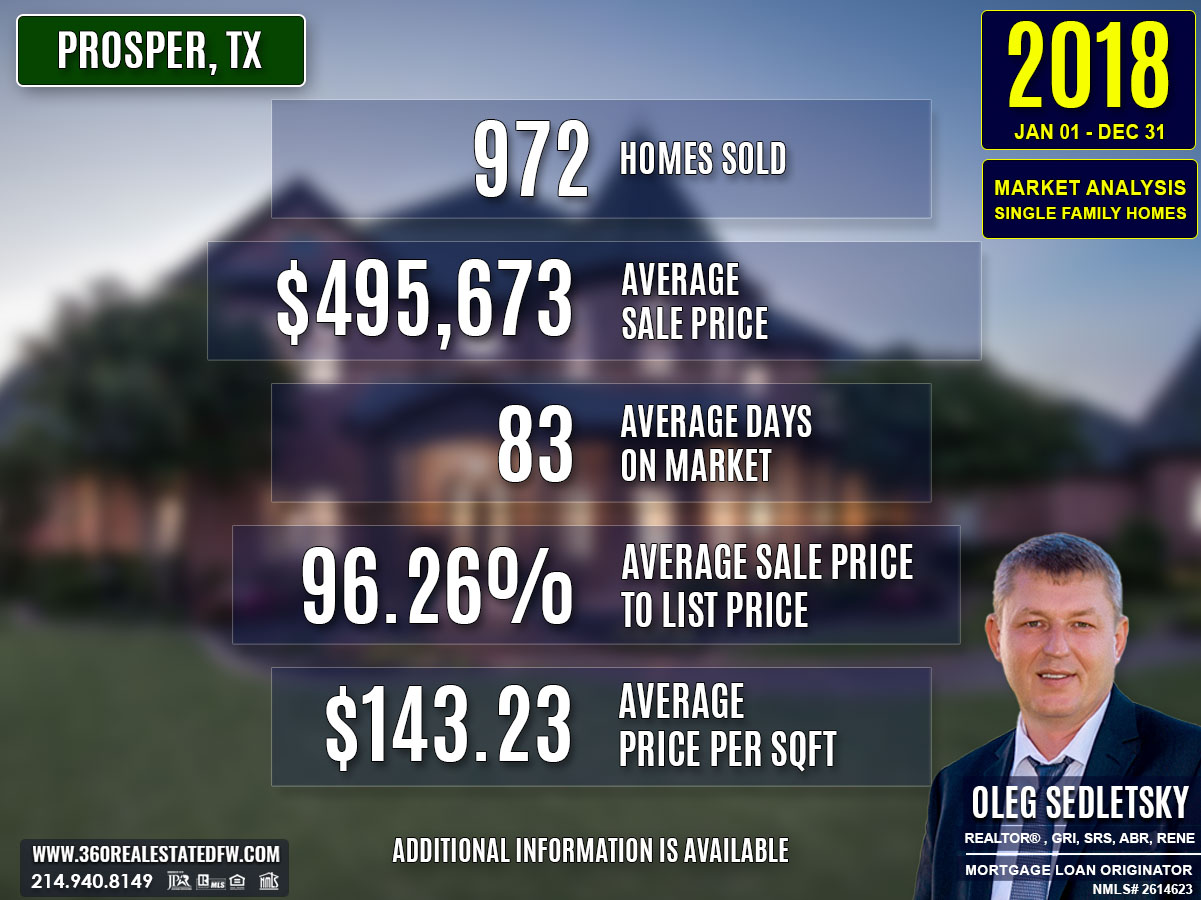
Total Homes Closed
The year ended with 972 closed transactions, demonstrating strong buyer activity. Of these, 524 were new construction homes, and 157 featured pools. These subcategories highlight growing demand for modern builds and homes offering recreational amenities.
Property Pricing Insights
- Minimum Sale Price: $170,000
- Maximum Sale Price: $2,150,000
- Average Sale Price: $495,673
- Median Sale Price: $460,000
The pricing spectrum reflects a mix of affordability and high-end luxury, catering to broad market segments.
Property Size and Features
Bedrooms: Majority of homes had 4 bedrooms.
Bathrooms: A typical property included 4 bathrooms (3 full and 1 half).
Square Footage: Homes ranged from 956 to 11,950 square feet, with an average size of 3,449 square feet.
Lot Size: Lot areas varied widely, with an average of 0.288 acres.
This diversity underscores the appeal of Prosper’s market to both first-time homebuyers and those seeking larger family homes or estates.
Market Dynamics
- Days on Market (DOM): 83 days on average, showing steady demand and reasonable turnover.
- ClsPr/LstPr Ratios: Average ratio of 96.26%, confirming competitive pricing practices.
- ClsPr/OLP Ratios (Close Price to Original Listing Price): 93.79%, reflecting occasional price adjustments during the selling process.
- Average Price per Square Foot: $143.23, illustrating incremental value appreciation.
These figures emphasize a balanced market where sellers negotiate effectively and buyers close transactions within reasonable timeframes.
Insights into the Most Expensive Prosper, TX Property Sold in 2018
The most expensive sale in 2018 was a stunning luxury property that sold for $2,150,000. This home was a true standout in Boban’s market with a combination of high-end features, prime location, and oversized lot.
Key Metrics:
- Price: $2,150,000
- Bedrooms: 5
- Bathrooms: 6 (4 full, 2 half)
- Square Footage: 9,004 square feet
- Price per Square Foot: $238.78
- Lot Size: 3.317 acres
- Days on Market (DOM): 50 days
- ClsPr/LstPr Ratio: 95.56%
- ClsPr/OLP Ratio: 95.56%
- Year Built: 2000
The property’s exceptional value, premium location with water and greenbelt views, and luxurious features—such as an indoor pool complete with a kitchen—have propelled it to the top of the market. While its high price point and quick sale are remarkable, it also highlights the niche but strong demand for luxury homes in Prosper, TX. This outlier could have contributed to a slight skew in average pricing metrics, reinforcing the importance of understanding all market segments.
Economic context
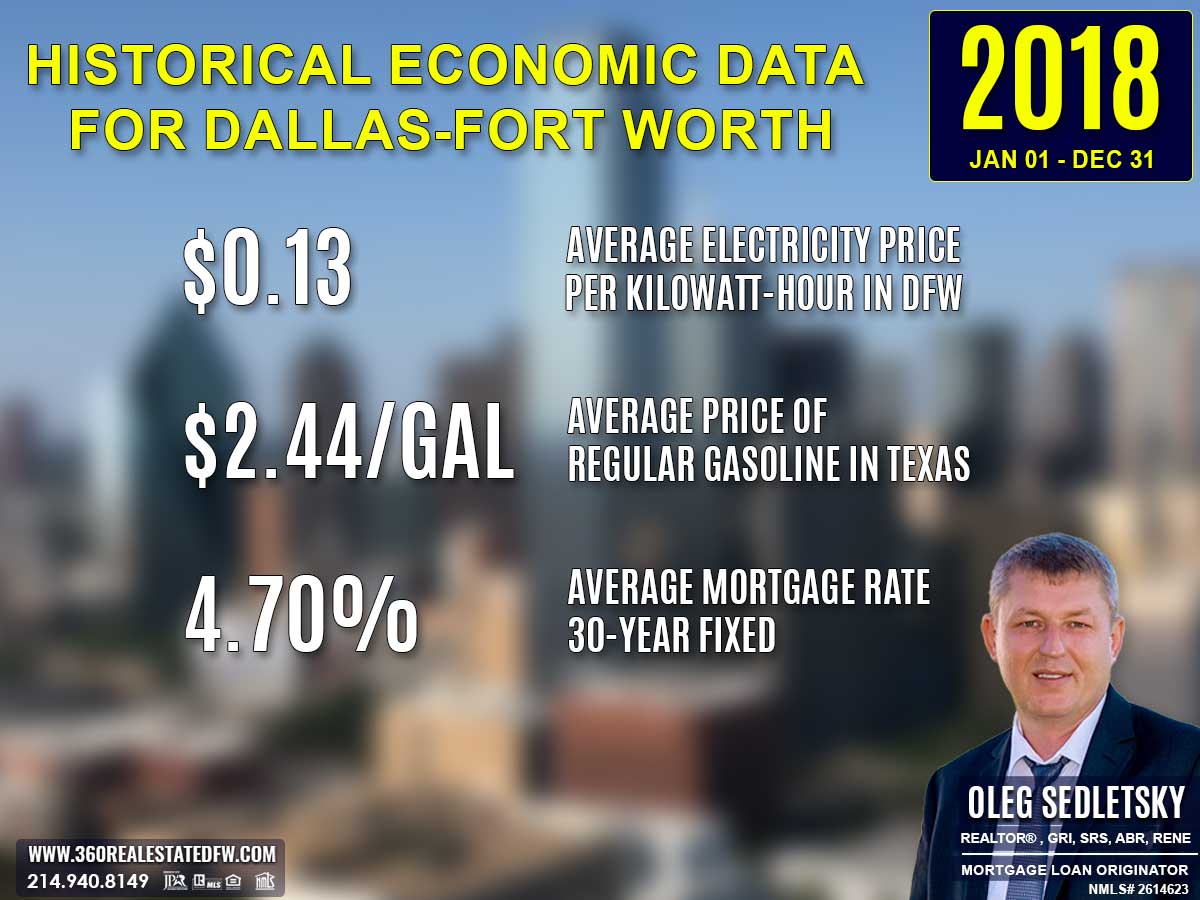
Average Electricity Costs in Dallas-Fort Worth in 2018
Electricity prices increased to $0.13 per kilowatt-hour in 2018, compared to $0.12 in 2017. This climb likely drove demand for energy-efficient housing and renovations, placing greater emphasis on properties with modern upgrades that helped households manage increasing utility costs.
Average Price for Regular Gasoline in Texas in 2018
Gas prices also rose, reaching $2.44 per gallon in 2018, up from $2.19 in 2017. With transportation becoming more expensive, proximity to workplaces and public transportation remained important for homebuyers. Walkable neighborhoods and mixed-use developments gained traction during this period.
Average 30-Year Fixed Mortgage Rate in 2018
Mortgage rates climbed to 4.70% in 2018, from 4.14% in the previous year. For many homebuyers, this level of interest rate signaled urgency to act before rates increased further. Getting pre-approved by a local mortgage loan originator was pivotal for navigating the pressures of a market increasingly shaped by rising rates.
Curious about today’s mortgage rates and the home you can comfortably afford?
Submit a no-obligation mortgage application today and get pre-approved to determine your budget and take the first step toward homeownership with confidence.
Overview of Differences Between the 2017 and 2018 Real Estate Markets in Prosper, Texas
1. Total Homes Sold
2018 saw 972 homes sold, an increase of 79 homes compared to 893 in 2017.
2. Average Sales Price
The average sales price increased slightly, from $483,575 in 2017 to $495,673 in 2018, reflecting steady price appreciation.
3. Average Price per Square Foot
2018’s average price per square foot was $143.23, up from $139.30 in 2017, indicating a modest rise in property values.
4. Average Days on Market (DOM)
Homes took longer to sell in 2018, with an average DOM of 83 days, compared to 73 days in 2017, suggesting slightly slower market movement.
5. Close Price to Listing Price (ClsPr/LstPr) Ratio
The ClsPr/LstPr ratio dipped marginally from 96.91% in 2017 to 96.26% in 2018, hinting at slightly less competitive bidding.
6. Homes with Pools
There was an upswing in demand for homes with pools, with 157 such homes sold in 2018, up from 116 in 2017.
7. New Construction Homes
New construction activity boomed in 2018, with 524 new homes sold, a significant rise from 448 in 2017, showcasing strong developer activity.
8. Most Expensive Property Sold
The most expensive property sold in 2018 was priced at $2,150,000 with 9,004 sqft and unique features like an indoor pool complete with a kitchen, 3.3+ acres with water, creek, and greenbelt views. This surpassed 2017’s most expensive property, which sold for $1,615,000 with 8,477 sqft, featuring a tornado shelter-safe room and beach entry pool.
Key Observations
The market demonstrated growth in price trends, new construction activity, and luxury sales, but a slight slowdown in velocity (DOM). The demand for homes with specific features, like pools, also gained traction, reflecting evolving buyer preferences.
Summary of Real Estate Market Analysis for Prosper, TX in 2018
The 2018 real estate market in Prosper, Texas reflected strong activity, with increased closings, steady pricing growth, and evolving homebuyer preferences. Demand for both new construction homes and properties with recreational amenities like pools remained high. Despite rising mortgage rates, the market proved resilient, offering opportunities for both buyers and sellers in a balanced, competitive environment.
Homebuyers and First-Time Homebuyers Perspective:
For homebuyers, and especially first-time buyers, 2018 presented both challenges and opportunities. Steady price appreciation emphasized the importance of acting quickly on properties, while the wide range of homes available—from affordably priced options to luxury estates—provided choices for various budgets. However, rising mortgage rates could have felt like a hurdle for newcomers. First-time homebuyers especially benefited from working with skilled realtors who not only understood the nuances of Prosper’s market but also guided them in navigating financing options and competitive bidding situations.
Home-Sellers Perspective:
The 2018 market also affirmed the critical role of realtors for home sellers. Sellers relied heavily on expert advice to price their homes accurately amidst shifting market conditions. Realtors provided strategies to maximize exposure through targeted marketing, online listings, and staging recommendations. These efforts ensured sellers connected with the right buyers efficiently, even in a competitive market. The increase in close price to listing price ratios further highlights how professional guidance empowered sellers to achieve strong results during transactions.
Final Thoughts:
Overall, the 2018 real estate market in Prosper, Texas demonstrated growth, adaptability, and opportunities for both buyers and sellers. While mortgage rates and property values trended upward, the market’s resilience was clear in the consistent activity across price ranges and property types.
The Importance of Statistical Data in Prosper, Texas Real Estate Market
Did you know that Appraisers and Realtors rely on historical statistical data to determine a property’s current value?
The data above is just the beginning. This glimpse into the Prosper, Texas real estate market outlines trends but doesn’t capture the full picture. To truly understand the city’s housing market, you’ll need specific insights like zip code analyses, neighborhood breakdowns, and school-district-focused data. Historical trends and comprehensive analyses arm both homebuyers and home sellers with the tools they need to make decisions confidently.
The insights on this page represent just a small part of the comprehensive real estate services I provide to my clients. Whether you’re a buyer aiming to find your dream home or a seller looking to maximize your property’s value, I provide data-backed strategies tailored to your goals.
Reach out today—I’d love to help you achieve success in Prosper’s vibrant housing market!
Unlock Exceptional Service!
Assistance with all your real estate needs in the Dallas-Fort Worth area is just a click or call away. Reach out at 214-940-8149 or connect through the links below.
Meet Your Trusted Realtor and Mortgage Expert in Prosper, Texas!
Oleg Sedletsky REALTOR® in Prosper, Texas. Call/Text 214.940.8149
Greetings! I’m Oleg Sedletsky, and I’m excited to introduce myself as your go-to full-time licensed Texas REALTOR® and Mortgage Loan Originator.
I proudly represent JPAR® – Real Estate Brokerage as a REALTOR® and Utopia Mortgage LLC as a Mortgage Loan Originator! My designations and certifications reflect my dedication to helping you achieve your real estate goals in Prosper, TX and other locations in the vibrant Dallas-Fort Worth area!
With my expertise, I’ll provide you with in-depth resources, including detailed market reports and historical data, to help you make confident, well-informed decisions. Fluent in English, Ukrainian, and Russian, I’m here to guide you through every step of the process with personalized support and dedication.
It’s All About You and Your Real Estate Goals!
My mission is to serve you! With my knowledge and expertise, I’m here to help you achieve all your real estate goals!
I’m passionate about helping homebuyers and home-sellers navigate the exciting real estate landscape in Prosper, Texas! Whether you’re searching for your dream home, exploring land options, or looking for commercial properties, my Real Estate Services have you covered.
Contact me today for all your real estate needs in Prosper, Texas! Call/text 214-940-8149
A Comprehensive Analysis of Single-Family Residential Housing Market in Prosper, TX: 2010 to Present
Discover the trends, stats, and insights shaping Prosper’s real estate market year by year!
2010-2020
Prosper, TX Real Estate Market Report 2010: Analysis and Trends
Prosper, TX Real Estate Market Report 2011: Analysis and Trends
Prosper, TX Real Estate Market Report 2012: Analysis and Trends
Prosper, TX Real Estate Market Report 2013: Analysis and Trends
Prosper, TX Real Estate Market Report 2014: Analysis and Trends
Prosper, TX Real Estate Market Report 2015: Analysis and Trends
Prosper, TX Real Estate Market Report 2016: Analysis and Trends
Prosper, TX Real Estate Market Report 2017: Analysis and Trends
Prosper, TX Real Estate Market Report 2018: Analysis and Trends
Prosper, TX Real Estate Market Report 2019: Analysis and Trends
Prosper, TX Real Estate Market Report 2020: Analysis and Trends
This market analysis is intended solely for educational purposes. This market analysis is based on data sourced from NTREIS, Inc. This analysis is exclusively focused on single-family homes and does not account for other property types. The total number of real estate transactions within the specified period and location may vary. Data accuracy cannot be guaranteed due to potential input errors made by NTREIS users. This market analysis does not account for all new construction home sales. If you need detailed information about recorded property sales or other public records, please contact the appropriate city or county office.