
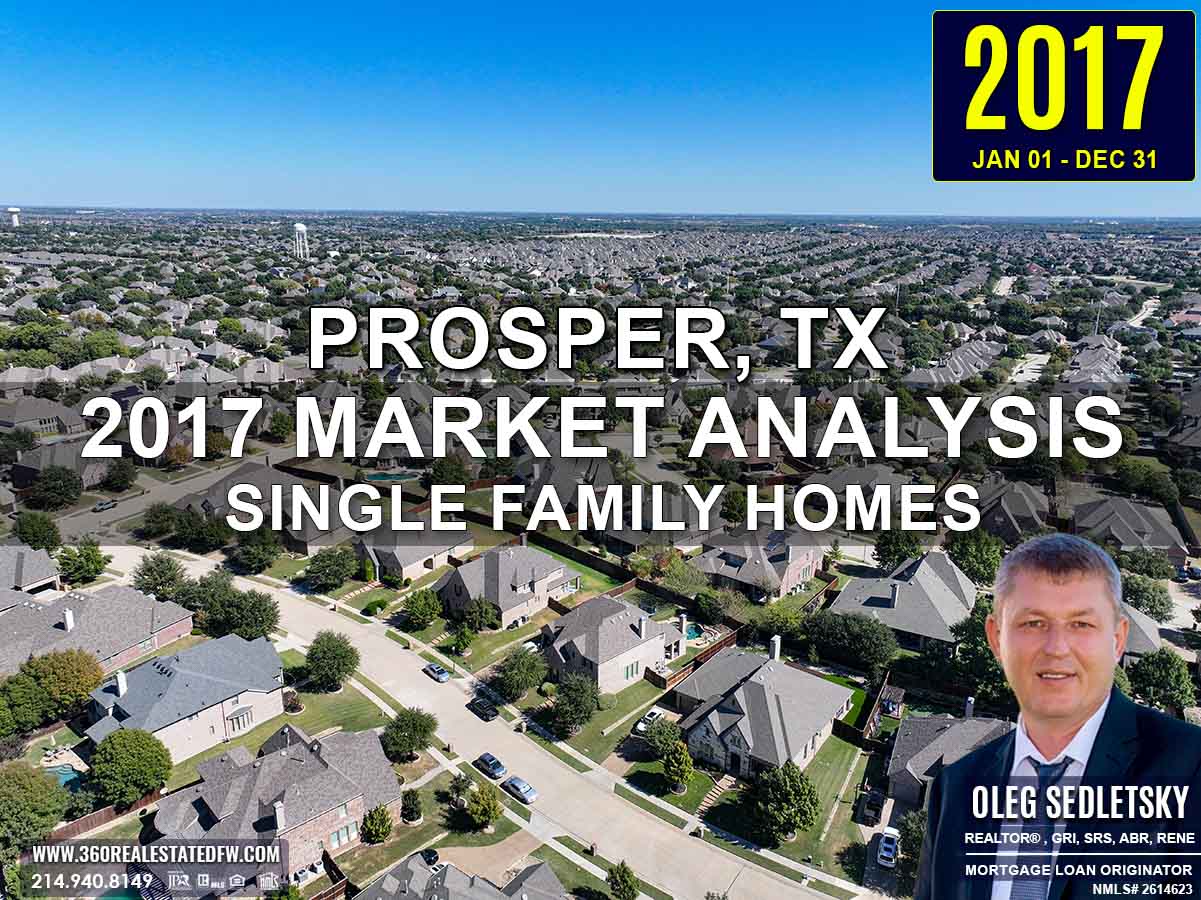
Prosper, TX Real Estate: A Comprehensive Analysis of the 2017 Single-Family Residential Housing Market
The year 2017 proved to be an active and dynamic period for the residential single-family home market in Prosper, Texas. With 893 properties closed, the market displayed varied pricing, efficient sales cycles, and increasing demand for both new builds and unique property features such as swimming pools. This analysis dives into the key metrics and trends that shaped the local real estate market, providing a closer look at pricing, property characteristics, market efficiency, and notable highlights.
Key Takeaways and Trends from the 2017 Real Estate Market in Prosper, TX
1. Pricing Range
The sales prices for residential homes ranged from $185,000 to $1,615,000, with an average of $483,575. This wide range reflects the availability of homes catering to different budgets, from modest dwellings to luxury properties.
2. Market Efficiency
The market demonstrated strong efficiency based on a close price to listing price average of 96.91% and an average DOM of 73. Homes sold quickly, aligning closely with their listing values, suggesting active buyer interest and accurate pricing by sellers.
3. Unique Outliers
The standout property of the year was a luxury two-story home with 8,477 square feet, priced at $1,615,000. Unique features such as a tornado shelter, slate balconies, and a beach entry pool set it apart, significantly influencing the upper boundaries of the market.
4. Mortgage Rates Impact
With an average 30-year fixed mortgage rate of 4.14%, borrowing costs remained moderate in 2017. This favorable rate encouraged buyers to invest, contributing to market movement and demand stability.
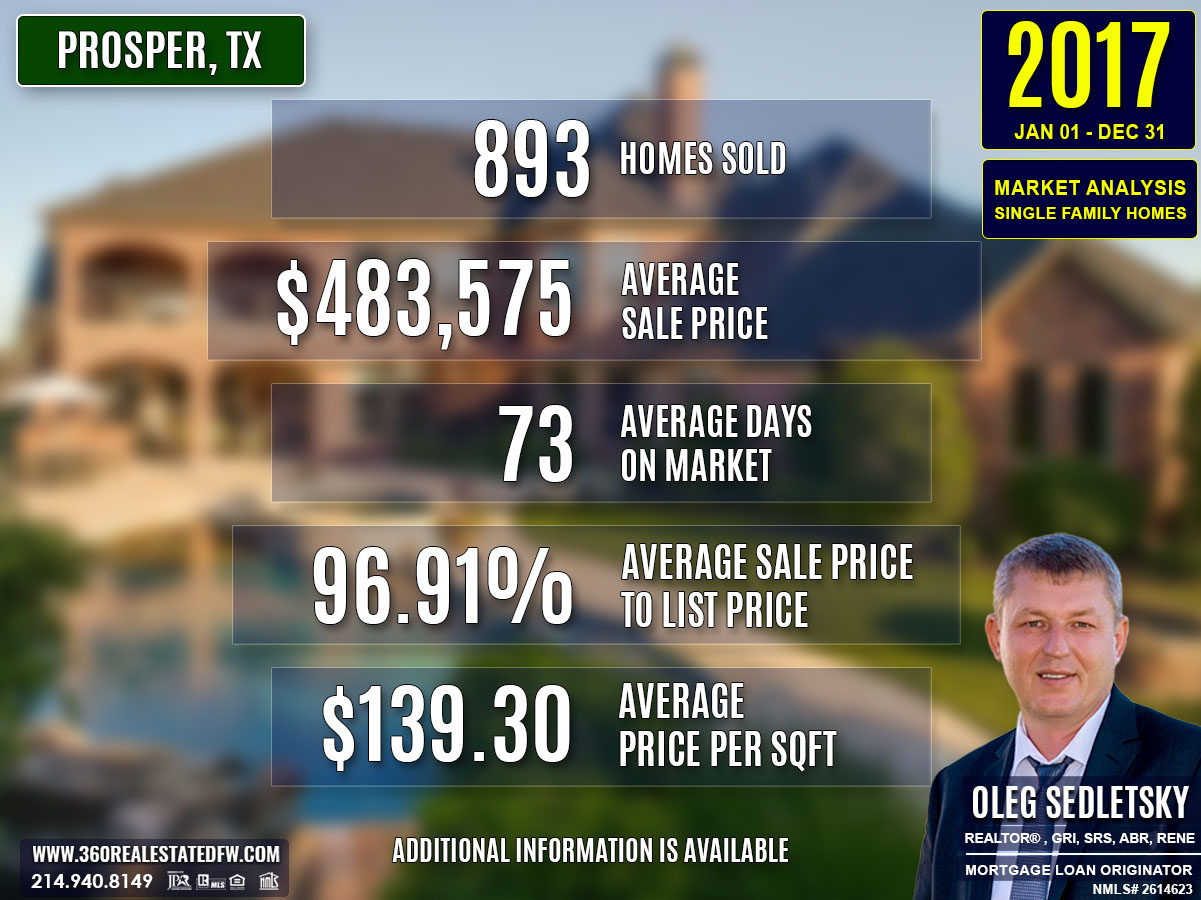
Total Homes Closed
A total of 893 properties were sold in 2017, reflecting a strong local market. Among these, 116 homes featured pools, highlighting the appeal of leisure-oriented amenities. Additionally, 448 newly constructed homes were sold, representing just over half of the total sales, signaling a high demand for modern-built properties.
Property Pricing Insights
- Minimum Price: $185,000
- Maximum Price: $1,615,000
- Average Price: $483,575
- Median Price: $450,000
The market catered to a wide range of buyers, with prices skewed slightly toward new and modern builds, as reflected in the median price of $450,000.
Property Size and Features
- Bedrooms: Ranged from 2 to 6 (average 4)
- Bathrooms: Ranged from 1 to 8 (average 4, with 3 full baths as the median)
- Square Footage: From 876 to 8,477 sq. ft. (average 3,470 sq. ft., median 3,501)
- Lot Size Area: Varied from .000 to 9.08 acres
The data reveals that the majority of homes were midsize, featuring 4 bedrooms and 4 bathrooms on average, with lot sizes varying drastically. Larger luxury homes contributed to upper pricing brackets.
Market Dynamics
- Days on Market (DOM): The average DOM was 73, indicating properties were sold relatively quickly. The median DOM of 49 days further signals that well-priced homes moved rapidly.
- Close Price to Listing Price Ratio (ClsPr/LstPr): At an average of 96.91%, homes typically closed near their original listing prices, showcasing market stability.
- Close Price to Original Listing Price Ratio (ClsPr/OLP): Averaging 94.96%, this metric suggests some price adjustments were made in the market but were not overly significant.
- Average Price per Square Foot: $139.30
Insights into the Most Expensive Prosper, TX Property Sold in 2017
The most expensive home sold in 2017 was a luxurious two-story property with a slew of premium amenities and features. Highlights of the property include:
- Price: $1,615,000
- Beds and Baths: 5 bedrooms, 7 bathrooms (4 full, 3 half)
- Size: 8,477 sq. ft.
- Price per Square Foot: $190.52
- Lot Size: 1.219 acres
- Days on Market (DOM): 284
- ClsPr/LstPr Ratio: 95.01%
- ClsPr/OLP Ratio: 87.30%
- Year Built: 2005
- Unique Features: Tornado shelter, two balconies with slate finishes, and a beach entry pool
Despite its extended time on the market (284 days), this property showcased the cache for high-end residences in Prosper, TX. Its sale influenced the upper spectrum of the market, setting a precedent for luxury pricing and boosting market visibility for similar high-value properties.
Economic context

Average Electricity Costs in Dallas-Fort Worth in 2017
Electricity prices rose to $0.12 per kilowatt-hour in 2017, after a year at $0.11. This small uptick likely reignited interest in smaller homes or energy-efficient features. homebuyers remained cautious about properties with older energy systems, viewing them as less desirable long-term investments.
Average Price for Regular Gasoline in Texas in 2017
Gas prices increased to $2.19 per gallon in 2017, up from $1.91 in 2016. While still relatively affordable, the rise may have led homebuyers to reconsider the financial trade-offs of suburban living. Proximity to public transportation hubs became a more significant factor during housing searches.
Average 30-Year Fixed Mortgage Rate in 2017
Mortgage rates rose to 4.14% in 2017, up from 3.79% the year prior. The return of higher rates reminded homebuyers of the importance of locking in favorable financing terms early. Pre-approval through local mortgage loan originators remained vital to navigating the shifting landscape effectively and with confidence.
Curious about today’s mortgage rates and the home you can comfortably afford?
Submit a no-obligation mortgage application today and get pre-approved to determine your budget and take the first step toward homeownership with confidence.
Overview of Differences Between the 2016 and 2017 Real Estate Markets in Prosper, Texas
The real estate market in Prosper, Texas showed notable growth and changes from 2016 to 2017. Here’s a summary of the key differences and trends:
1. Total Homes Sold:
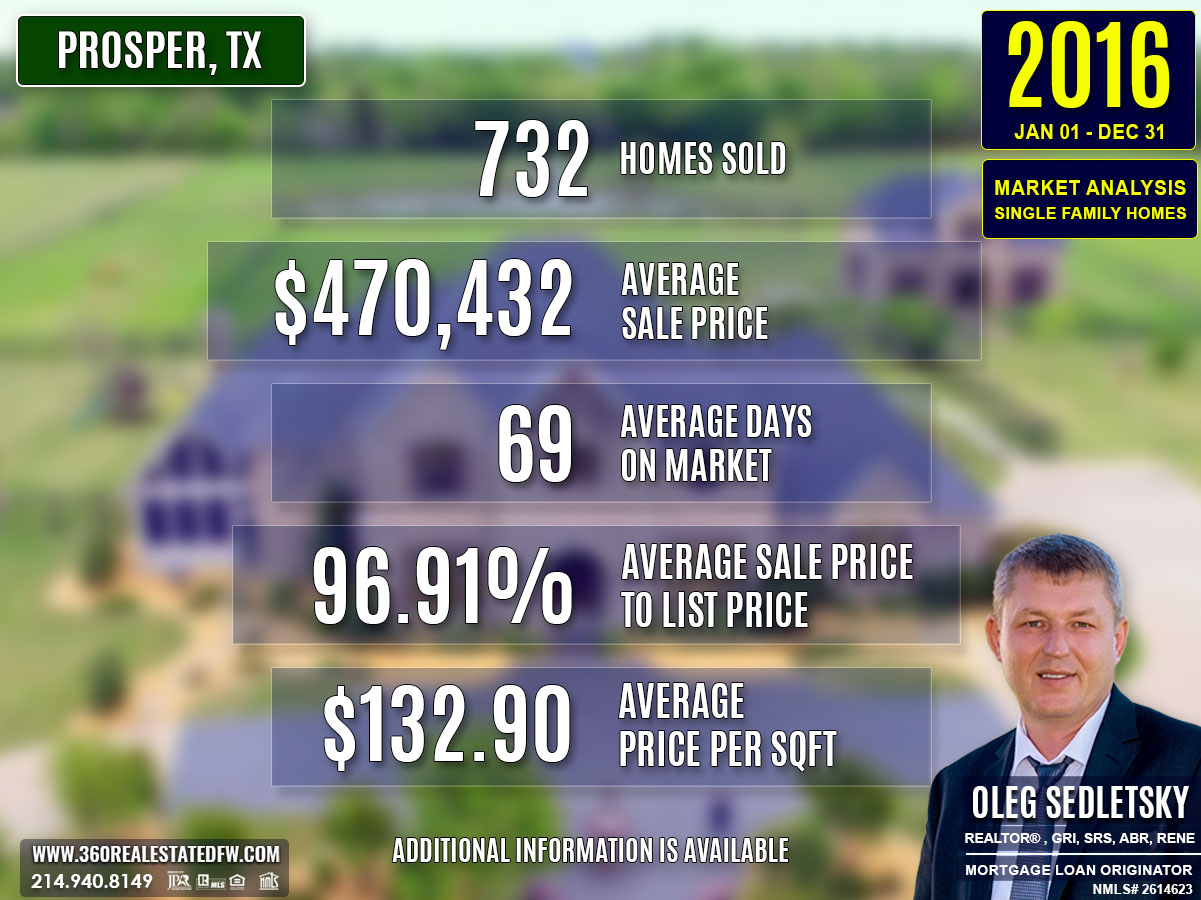
2016 saw 732 closed residential single-family home sales, while 2017 experienced a significant increase to 893 homes sold. This marks an uptick of 161 transactions, suggesting heightened market activity and buyer demand.
2. Average Sales Price:
The average sales price rose modestly from $470,432 in 2016 to $483,575 in 2017, reflecting a steady increase in property values. This growth indicates a robust market with rising property demand and prices.
3. Average Days on Market (DOM):
The average DOM slightly increased from 69 days in 2016 to 73 days in 2017. This minor shift suggests properties were moving at a similar pace, maintaining market efficiency year-over-year.
4. Average Price Per Square Foot:
The average price per square foot climbed from $132.90 in 2016 to $139.30 in 2017, showcasing a continued upward trend in the value of residential real estate.
5. Homes with Pools:
The number of homes sold with pools rose from 100 in 2016 to 116 in 2017, aligning with the increased overall sales volume and a potential growing preference for homes with recreational features.
6. New Construction Homes:
There was a sharp rise in new construction home sales, jumping from 339 in 2016 to 448 in 2017. This boost reflects increased development activity and a strong demand for modern, updated properties.
Most Expensive Property Sold Comparison
2016: The most expensive property sold was listed at $1,850,000, offering 5 beds, 7 baths, 7,904 square feet, and unique features such as guest quarters (Casita) and an outdoor paradise with patios, a fireplace, and a pool/spa. It closed at $234.06 per square foot.
2017: The priciest home sold for $1,615,000 with 5 beds, 7 baths, 8,477 square feet, including high-end features like a tornado shelter, two slate-covered balconies, and a beach-entry pool. It closed at $190.52 per square foot.
While 2017’s most expensive property had a larger square footage, the lower closing price and price per square foot compared to 2016 suggest a possible shift in the luxury segment or market preferences.
Economic Factors
Average 30-year fixed mortgage rates increased from 3.79% in 2016 to 4.14% in 2017. This rise in borrowing costs could have impacted buyers’ purchasing power, though the market remained active.
Gas prices and electricity costs also rose slightly, which might have influenced operating costs or buyer decisions indirectly.
Market Evolution
The real estate market in Prosper, TX demonstrated resilience and growth, with a significant increase in total transactions and property values. The rise in new construction home sales indicates a shift toward modern housing options, while the demand for homes with pools saw steady growth. Slight increases in mortgage rates and utility costs did not deter buyer activity, showcasing a strong and adaptable market. Overall, the year-over-year comparison reveals a maturing real estate market with expanded opportunities for both buyers and sellers.
Summary of Real Estate Market Analysis for Prosper, TX in 2017
The 2017 real estate market in Prosper, TX painted a picture of opportunity and activity. With a total of 893 homes sold, the market was shaped by strong buyer interest, efficient property sales, and a wide pricing range. Both established and first-time buyers found options across various price points, while sellers experienced notable success thanks to strategic pricing and marketing. The year offered balanced momentum for all participants, cementing Prosper’s real estate market as both dynamic and stable.
Homebuyers and First-Time Homebuyers Perspective
For homebuyers, 2017 provided a variety of choices, with prices starting at $185,000 and reaching as high as $1,615,000. The availability of new construction homes was particularly attractive, allowing buyers to target modern builds with updated features. First-time homebuyers benefited from moderate mortgage rates averaging 4.14%, which made the process more financially accessible. The market’s efficiency, as reflected in the average close price to listing price ratio of 96.91%, gave buyers confidence that they were entering a fair and stable environment. Above all, the options available in bedroom and bathroom configurations, as well as lot sizes, allowed buyers to find homes that matched their lifestyles and needs.
Home-Sellers Perspective
For Home Sellers, the market in 2017 underscored the importance of positioning properties competitively. The median days on market (49) and close price to listing price ratio (96.91%) signal that well-priced homes moved quickly and with minimal negotiation. Sellers largely relied on their realtors’ expertise, whether through strategic pricing advice, professional photography to showcase homes, or marketing techniques to attract the right buyers. Realtors played a pivotal role in navigating the complexities of the home selling process, ensuring that homes were not only visible to prospective buyers but also aligned with market trends. Seller confidence was reflected in the overall market dynamics, where even high-end properties found buyers willing to invest.
Final Thoughts
The 2017 residential market in Prosper, Texas demonstrated a healthy balance between buyers’ needs and sellers’ expectations. Favorable mortgage rates played a significant role in encouraging steady buyer activity, while sellers leveraged professional support to achieve favorable outcomes. The market’s diversity in pricing, property types, and features catered to a wide demographic, from first-time buyers seeking affordability to seasoned homeowners pursuing luxury. This balance of supply and demand, coupled with market stability, marked 2017 as a successful year for real estate in Prosper, Texas, setting a strong foundation for the years to come.
The Importance of Statistical Data in Prosper, Texas Real Estate Market
Did you know that Appraisers and Realtors rely on historical statistical data to determine a property’s current value?
The data above is just the beginning. This glimpse into the Prosper, Texas real estate market outlines trends but doesn’t capture the full picture. To truly understand the city’s housing market, you’ll need specific insights like zip code analyses, neighborhood breakdowns, and school-district-focused data. Historical trends and comprehensive analyses arm both homebuyers and home sellers with the tools they need to make decisions confidently.
The insights on this page represent just a small part of the comprehensive real estate services I provide to my clients. Whether you’re a buyer aiming to find your dream home or a seller looking to maximize your property’s value, I provide data-backed strategies tailored to your goals.
Reach out today—I’d love to help you achieve success in Prosper’s vibrant housing market!
Unlock Exceptional Service!
Assistance with all your real estate needs in the Dallas-Fort Worth area is just a click or call away. Reach out at 214-940-8149 or connect through the links below.
Meet Your Trusted Realtor and Mortgage Expert in Prosper, Texas!

Oleg Sedletsky REALTOR® in Prosper, Texas. Call/Text 214.940.8149
Greetings! I’m Oleg Sedletsky, and I’m excited to introduce myself as your go-to full-time licensed Texas REALTOR® and Mortgage Loan Originator.
I proudly represent JPAR® – Real Estate Brokerage as a REALTOR® and Utopia Mortgage LLC as a Mortgage Loan Originator! My designations and certifications reflect my dedication to helping you achieve your real estate goals in Prosper, TX and other locations in the vibrant Dallas-Fort Worth area!
With my expertise, I’ll provide you with in-depth resources, including detailed market reports and historical data, to help you make confident, well-informed decisions. Fluent in English, Ukrainian, and Russian, I’m here to guide you through every step of the process with personalized support and dedication.
It’s All About You and Your Real Estate Goals!
My mission is to serve you! With my knowledge and expertise, I’m here to help you achieve all your real estate goals!
I’m passionate about helping homebuyers and home-sellers navigate the exciting real estate landscape in Prosper, Texas! Whether you’re searching for your dream home, exploring land options, or looking for commercial properties, my Real Estate Services have you covered.
Contact me today for all your real estate needs in Prosper, Texas! Call/text 214-940-8149

A Comprehensive Analysis of Single-Family Residential Housing Market in Prosper, TX: 2010 to Present
Discover the trends, stats, and insights shaping Prosper’s real estate market year by year!
2010-2020
Prosper, TX Real Estate Market Report 2010: Analysis and Trends
Prosper, TX Real Estate Market Report 2011: Analysis and Trends
Prosper, TX Real Estate Market Report 2012: Analysis and Trends
Prosper, TX Real Estate Market Report 2013: Analysis and Trends
Prosper, TX Real Estate Market Report 2014: Analysis and Trends
Prosper, TX Real Estate Market Report 2015: Analysis and Trends
Prosper, TX Real Estate Market Report 2016: Analysis and Trends
Prosper, TX Real Estate Market Report 2017: Analysis and Trends
Prosper, TX Real Estate Market Report 2018: Analysis and Trends
Prosper, TX Real Estate Market Report 2019: Analysis and Trends
Prosper, TX Real Estate Market Report 2020: Analysis and Trends
This market analysis is intended solely for educational purposes. This market analysis is based on data sourced from NTREIS, Inc. This analysis is exclusively focused on single-family homes and does not account for other property types. The total number of real estate transactions within the specified period and location may vary. Data accuracy cannot be guaranteed due to potential input errors made by NTREIS users. This market analysis does not account for all new construction home sales. If you need detailed information about recorded property sales or other public records, please contact the appropriate city or county office.

Prosper, TX Real Estate: A Comprehensive Analysis of the 2016 Single-Family Residential Housing Market
The Prosper, Texas residential real estate market in 2016 exhibited steady growth, marked by increased sales activity and notable dynamics in pricing and property features. Reviewing data from 732 closed transactions provides valuable insights into the evolving preferences of homebuyers and the opportunities for sellers. This report aims to break down key metrics, identify trends, discuss market efficiency, and highlight standout properties that shaped the year’s performance.
Key Takeaways and Trends from the 2016 Real Estate Market in Prosper, TX
1. Pricing Range
Properties in Prosper ranged from $109,000 to $1,850,000 in 2016, with an average sales price of $470,432, showcasing affordability for mid-range buyers and appeal in the luxury sector.
2. Market Efficiency
The average property spent just 69 days on the market, with homes selling at 96.91% of their listing price. This highlights a stable market where well-priced homes moved quickly, offering opportunities for both buyers and sellers.
3. Unique Outliers
In 2016, the real estate market showcased several exceptional properties, including a luxury estate priced at $1.85 million. Similar to trends seen in 2014 and 2015, this estate featured a Casita with a private entrance, catering to the rising demand for multi-generational living. These high-end homes underscored the strength of the luxury market, pushing both average and median price points upward.
4. Mortgage Rates Impact
With average 30-year fixed mortgage rates at 3.79%, buyers benefited from favorable borrowing conditions. These rates played a key role in driving demand, especially for higher-priced homes.
Total Homes Closed
A total of 732 single-family residences closed in 2016, reflecting strong activity in the residential market. Of these, 339 were new construction homes, demonstrating robust development efforts to meet demand. Additionally, 100 homes featured pools, catering to buyers prioritizing lifestyle amenities.
Property Pricing Insights
- Minimum Price: $109,000
- Maximum Price: $1,850,000
- Average Price: $470,432
- Median Price: $440,000
This range reflects a diverse market accommodating various income levels, from entry-level buyers to high-net-worth individuals.
Property Size and Features
- Bedrooms (Avg/Median): 4/4
- Bathrooms (Avg/Median): 4/4
- Square Footage (Avg/Median): 3,506 sq. ft. / 3,562 sq. ft.
- Lot Size (Avg/Median): 0.34 acres / 0.24 acres
The data indicates that the typical Prosper, TX home is spacious, offering four bedrooms and four bathrooms, making it ideal for mid-sized families. Larger lots and spacious interiors underscore the preference for family-oriented living spaces.
Market Dynamics
Days on Market (DOM)
- Minimum: -164 days (due to delayed reporting)
- Maximum: 582 days
- Average: 69 days
Homes moved quickly off the market in 2016, with an average DOM well under 3 months.
ClsPr/LstPr Ratio
- Average Close Price to Listing Price (ClsPr/LstPr): 96.91%
- Average Close Price to Original Listing Price (ClsPr/OLP): 96.69%
Price Per Square Foot
- Minimum: $58.31
- Maximum: $266.46
- Average: $132.90
The high close price ratios signal that buyers were willing to pay close to the asking price, reflecting trust in market value.
Insights into the Most Expensive Prosper, TX Property Sold in 2016
The most expensive property sold in Prosper in 2016 was a stunning luxury estate priced at $1,850,000. This five-bedroom, seven-bathroom home spanned 7,904 sq. ft. on a 2-acre lot, offering an unmatched blend of space, privacy, and premium features.
Key Highlights:
- Price: $1,850,000
- Beds/Baths: 5 beds / 7 baths
- Square Footage: 7,904 sq. ft.
- Price per Sq. Ft.: $234.06
- Lot Size: 2.13 acres
- DOM: 63 days
- ClsPr/LstPr: 88.10%
- ClsPr/OLP: 84.09%
- Year Built: 2008
This property set a benchmark for the luxury market with its energy-efficient design, multi-generational casita, and resort-style backyard featuring two covered patios, a fireplace, and a pool with a spa. Despite being the highest-priced sale, its close price ratio indicates a narrowing gap for luxury demand, suggesting opportunities for attractive high-end pricing.
The sale of this property highlighted the capability of Prosper’s real estate market to draw affluent buyers seeking unique estates. It emphasized the city’s standing as a competitive luxury market while contributing to an overall stabilization of average pricing trends for high-end homes.
Economic context

Average Electricity Costs in Dallas-Fort Worth in 2016
Electricity prices continued to decrease, settling at $0.11 per kilowatt-hour in 2016, down from $0.12 in 2015. This steady decline further incentivized interest in larger homes, which naturally consume more power. The trend also nudged developers to prioritize energy efficiency in new housing projects.
Average Price for Regular Gasoline in Texas in 2016
Gas prices dropped further to $1.91 per gallon in 2016, down from $2.17 in 2015. This decline reduced commuter expenses, inspiring homebuyers to explore housing options further from city centers. Properties in areas with good road infrastructure likely became more desirable, as homebuyers factored in affordable fuel costs.
Average 30-Year Fixed Mortgage Rate in 2016
Mortgage rates fell slightly again, settling at 3.79% in 2016, compared to 3.99% the prior year. This favorable environment for financing encouraged many homebuyers to jump into the market. Getting pre-approved with a local mortgage loan originator ensured buyers could seize opportunities quickly and position themselves in a competitive market.
Curious about today’s mortgage rates and the home you can comfortably afford?
Submit a no-obligation mortgage application today and get pre-approved to determine your budget and take the first step toward homeownership with confidence.
Overview of Differences Between the 2015 and 2016 Real Estate Markets in Prosper, Texas
Sales Volume
The number of homes sold increased from 667 in 2015 to 732 in 2016, reflecting a 9.75% growth in market activity. This highlights a healthier and more dynamic market in 2016.
Pricing
- Minimum Price saw an increase, going from $87,000 in 2015 to $109,000 in 2016.
- Maximum Price decreased slightly, from $2,100,000 in 2015 to $1,850,000 in 2016.
- Average Price increased by 5.64%, rising from $445,343 in 2015 to $470,432 in 2016.
- Median Price also rose from $430,000 in 2015 to $440,000 in 2016, reflecting the steady appreciation of property values.
Property Features
Average Square Footage was slightly smaller in 2016, at 3,506 sqft, compared to 3,539 sqft in 2015.
Lot sizes were more condensed, with 2016 averaging 0.339 acres, compared to 0.478 acres in 2015.
Homes remained consistent in terms of bedrooms (average of 4) and bathrooms (average of 4).
Market Efficiency
Homes sold faster in 2016, with average Days on Market (DOM) decreasing from 84 days in 2015 to 69 days in 2016.
Sellers in 2015 achieved stronger close price performance, with ClsPr/LstPr at 97.37% versus 96.91% in 2016. Similarly, ClsPr/OLP was 97.04% in 2015, outpacing 96.69% in 2016.
Price Per Square Foot
The average price per square foot increased from $124.83 in 2015 to $132.90 in 2016, signaling a 6.47% rise in property values.
The 2016 market outperformed 2015 in terms of sales activity, faster turnover, and rising property values. While lot sizes trended smaller, demand remained robust across price points, solidifying Prosper’s appeal in the real estate landscape.
Summary of Real Estate Market Analysis for Prosper, TX in 2016
The 2016 real estate market in Prosper, Texas was vibrant and diverse, characterized by a higher volume of sales, pricing growth, and improved market efficiency. With 732 homes sold, including significant activity in both new construction and feature-rich properties, the year reinforced Prosper’s appeal for buyers and sellers. Favorable mortgage rates further supported robust market dynamics and encouraged engagement across different price ranges.
Homebuyers and First-Time Homebuyers Perspective
For homebuyers, including those entering the market for the first time, 2016 presented a variety of opportunities to find the perfect home. The wide range of property options—from budget-friendly homes to luxury estates—ensured access to desirable choices for all budgets. However, the competitive market highlighted the value of market insights and skilled guidance. First-time homebuyers, in particular, needed professional expertise to understand trends, negotiate effectively, and make informed decisions.
Home-Sellers’ Perspective
For home sellers, the trend of rising home values and faster sales offered significant advantages. Much of their success was enabled by the expertise of local realtors that played a critical role in advising sellers on pricing strategies and market positioning. Sellers who relied on professional marketing and strategic guidance were not only able to attract the right buyers but also achieve the best possible outcomes during the home selling process.
Final Thoughts
The 2016 market underscored Prosper’s sustained growth and adaptability. Buyers secured investments in a promising market, while sellers maximized their value thanks to strong demand and efficient transaction timeframes. Looking ahead, Prosper, TX is well-positioned for continued growth, offering exciting opportunities for anyone looking to buy or sell in the area.
The Importance of Statistical Data in Prosper, Texas Real Estate Market
Did you know that Appraisers and Realtors rely on historical statistical data to determine a property’s current value?
The data above is just the beginning. This glimpse into the Prosper, Texas real estate market outlines trends but doesn’t capture the full picture. To truly understand the city’s housing market, you’ll need specific insights like zip code analyses, neighborhood breakdowns, and school-district-focused data. Historical trends and comprehensive analyses arm both homebuyers and home sellers with the tools they need to make decisions confidently.
The insights on this page represent just a small part of the comprehensive real estate services I provide to my clients. Whether you’re a buyer aiming to find your dream home or a seller looking to maximize your property’s value, I provide data-backed strategies tailored to your goals.
Reach out today—I’d love to help you achieve success in Prosper’s vibrant housing market!
Unlock Exceptional Service!
Assistance with all your real estate needs in the Dallas-Fort Worth area is just a click or call away. Reach out at 214-940-8149 or connect through the links below.
Meet Your Trusted Realtor and Mortgage Expert in Prosper, Texas!
Oleg Sedletsky REALTOR® in Prosper, Texas. Call/Text 214.940.8149
Greetings! I’m Oleg Sedletsky, and I’m excited to introduce myself as your go-to full-time licensed Texas REALTOR® and Mortgage Loan Originator.
I proudly represent JPAR® – Real Estate Brokerage as a REALTOR® and Utopia Mortgage LLC as a Mortgage Loan Originator! My designations and certifications reflect my dedication to helping you achieve your real estate goals in Prosper, TX and other locations in the vibrant Dallas-Fort Worth area!
With my expertise, I’ll provide you with in-depth resources, including detailed market reports and historical data, to help you make confident, well-informed decisions. Fluent in English, Ukrainian, and Russian, I’m here to guide you through every step of the process with personalized support and dedication.
It’s All About You and Your Real Estate Goals!
My mission is to serve you! With my knowledge and expertise, I’m here to help you achieve all your real estate goals!
I’m passionate about helping homebuyers and home-sellers navigate the exciting real estate landscape in Prosper, Texas! Whether you’re searching for your dream home, exploring land options, or looking for commercial properties, my Real Estate Services have you covered.
Contact me today for all your real estate needs in Prosper, Texas! Call/text 214-940-8149
A Comprehensive Analysis of Single-Family Residential Housing Market in Prosper, TX: 2010 to Present
Discover the trends, stats, and insights shaping Prosper’s real estate market year by year!
2010-2020
Prosper, TX Real Estate Market Report 2010: Analysis and Trends
Prosper, TX Real Estate Market Report 2011: Analysis and Trends
Prosper, TX Real Estate Market Report 2012: Analysis and Trends
Prosper, TX Real Estate Market Report 2013: Analysis and Trends
Prosper, TX Real Estate Market Report 2014: Analysis and Trends
Prosper, TX Real Estate Market Report 2015: Analysis and Trends
Prosper, TX Real Estate Market Report 2016: Analysis and Trends
Prosper, TX Real Estate Market Report 2017: Analysis and Trends
Prosper, TX Real Estate Market Report 2018: Analysis and Trends
Prosper, TX Real Estate Market Report 2019: Analysis and Trends
Prosper, TX Real Estate Market Report 2020: Analysis and Trends
This market analysis is intended solely for educational purposes. This market analysis is based on data sourced from NTREIS, Inc. This analysis is exclusively focused on single-family homes and does not account for other property types. The total number of real estate transactions within the specified period and location may vary. Data accuracy cannot be guaranteed due to potential input errors made by NTREIS users. This market analysis does not account for all new construction home sales. If you need detailed information about recorded property sales or other public records, please contact the appropriate city or county office.
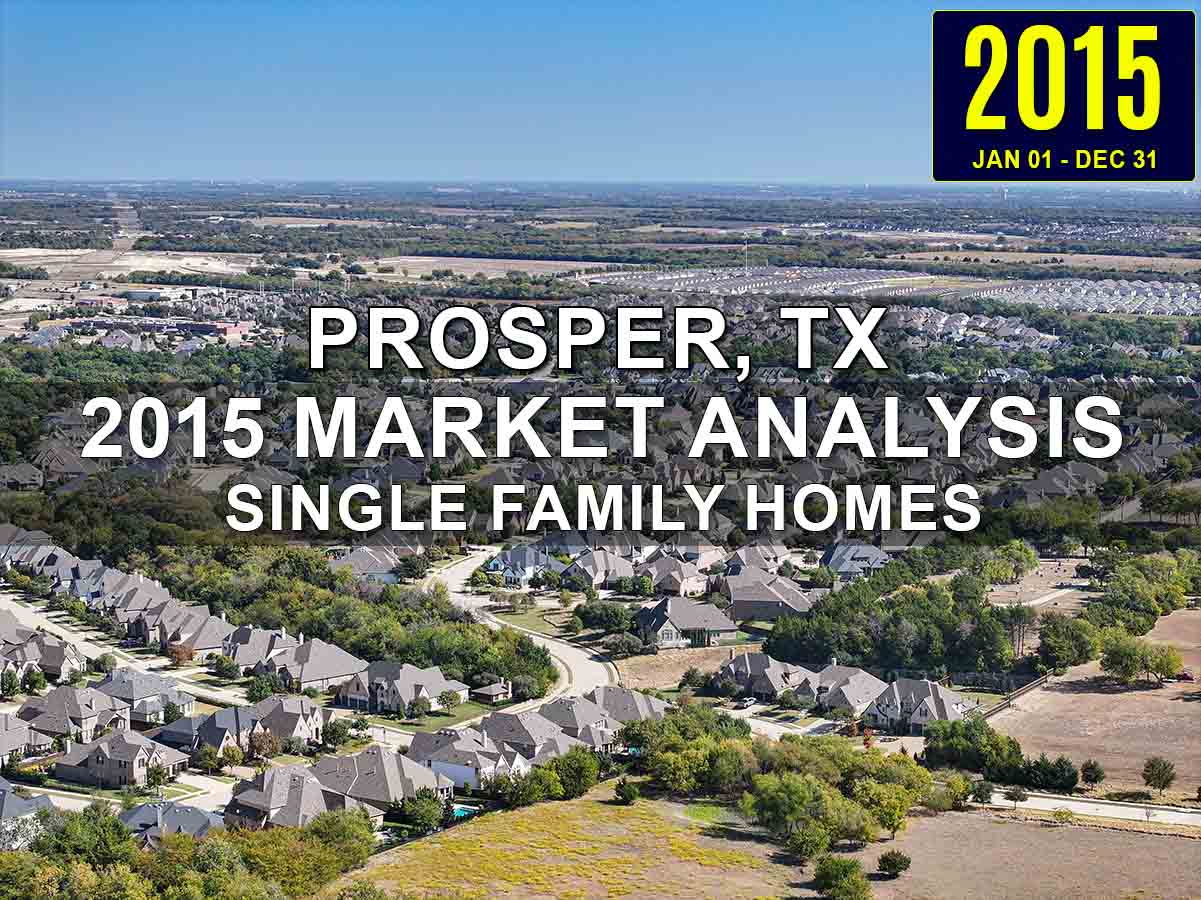
Prosper, TX Real Estate: A Comprehensive Analysis of the 2015 Single-Family Residential Housing Market
The 2015 real estate market in Prosper, Texas demonstrated substantial growth and stability, with increased property values and steady demand. A total of 667 single-family homes closed in this period, reflecting a thriving market supported by diverse inventory and competitive mortgage rates. This analysis provides an in-depth exploration of key market trends, highlighting pricing dynamics, transaction efficiency, and notable outliers that have influenced the Prosper’s real estate landscape.
Key Takeaways and Trends from the 2015 Real Estate Market in Prosper, TX
1. Pricing Range
The pricing spectrum in 2015 was diverse, with sales ranging from $87,000 to an impressive $2.1 million. This range highlights Prosper’s appeal to a broad buyer demographic, from first-time homeowners to luxury segment seekers.
2. Market Efficiency
The average DOM was 84, representing healthy turnover times. Effective pricing and high buyer activity maintained strong ClsPr/LstPr and ClsPr/OLP ratios, both exceeding 97%.
3. Unique Outliers
The most expensive property, sold for $2.1 million, stood out for its impressive size, luxurious features, and unique appeal. Notably, it included a Casita with a private entrance, catering to the demand for multi-generational living. This sale highlighted growing interest in Prosper’s high-end housing market, known for its versatility and premium offerings.
4. Mortgage Rates Impact
With average mortgage rates at 3.99%, financing remained broadly accessible, contributing to stable buyer activity and upward-trending home prices.
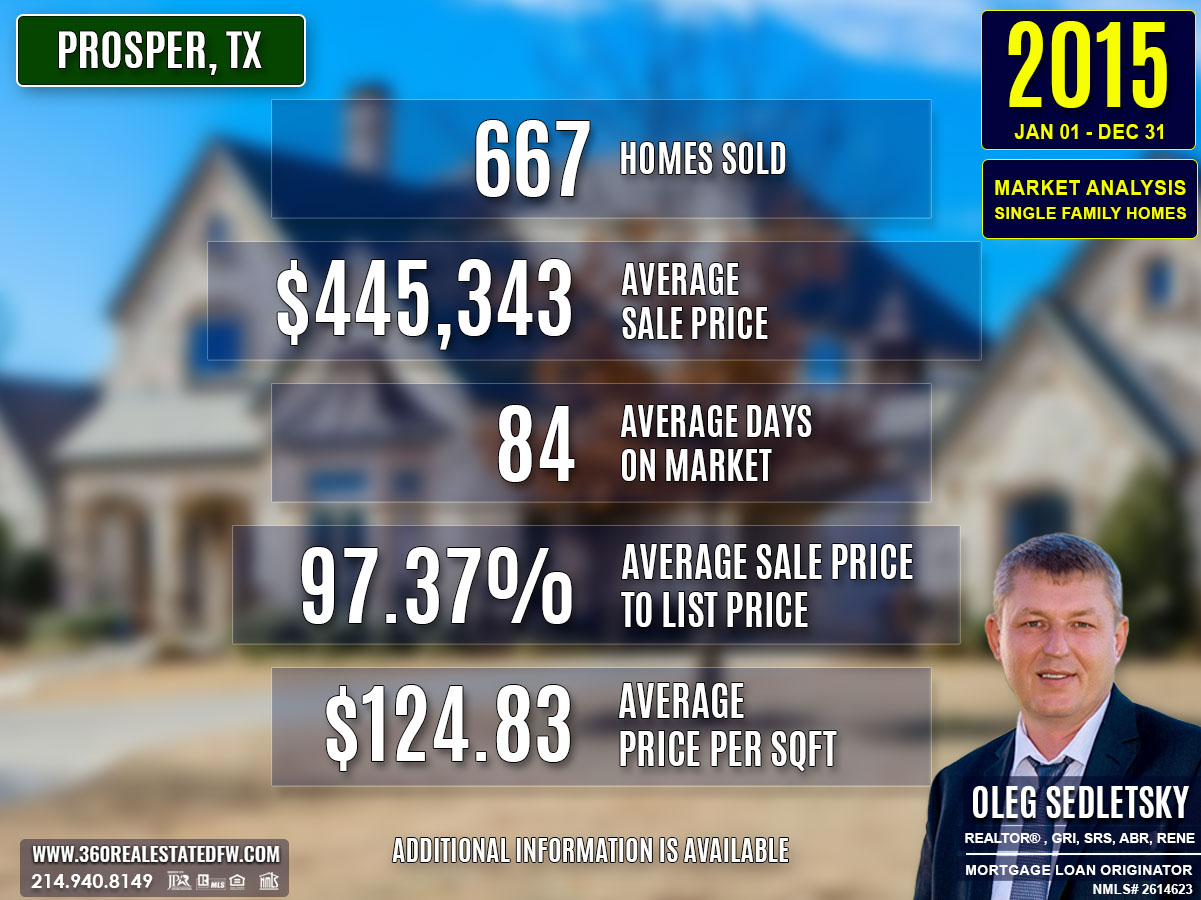
Total Homes Closed
The year saw 667 single-family homes sold. Included in this figure were 272 new construction homes, reflecting Prosper’s booming development sector, and 115 homes with pools, a popular feature among luxury and mid-tier properties.
Property Pricing Insights
- Minimum Price: $87,000
- Maximum Price: $2,100,000
- Average Price: $445,343
- Median Price: $430,000
This spread indicates a balanced market catering to various economic brackets while showing a steady appreciation trend.
Property Size and Features
- Bedrooms (average): 4
- Bathrooms (average): 4, including 3 full and 1 half bath
- Square Footage (Avg): 3,539 sq. ft.
- Lot Size (Avg): 0.478 acres
Larger lot sizes and homes with multiple features, often with luxury amenities, revealed Prosper’s potential as a premium market.
Market Dynamics
- Average DOM: 84 days
- ClsPr/LstPr: 97.37%
- ClsPr/OLP: 97.04%
- Average Price Per Sq. Ft.: $124.83
Homes sold relatively quickly and at optimal pricing, underlining market efficiency and vigorous buyer interest.
Insights into the Most Expensive Prosper, TX Property Sold in 2015
The most expensive property sold in Prosper in 2015 was a luxury estate priced at $2,100,000. This grand home exemplified opulence, combining ample space with premium amenities.
- Beds: 5
- Baths: 8 (6 full, 2 half)
- Square Footage: 7,470 sq. ft.
- Price per Sq. Ft.: $281.12
- Lot Size: 1.53 acres
- Days on Market (DOM): 18 days
- ClsPr/LstPr Ratio: 100%
- ClsPr/OLP Ratio: 100%
- Year Built: 2013
Notable Features:
- 5-car garage with Porte cochere
- Climate-controlled 630 sq. ft. wine room
- Independent Casita with kitchen, bedroom, and bathroom for multi-generational living
This sale validated the strong demand for luxury properties in Prosper, TX, setting a high benchmark for price and features. It highlighted the city’s ability to attract affluent buyers and secure swift transactions, influencing higher expectations in the luxury market.
Economic context
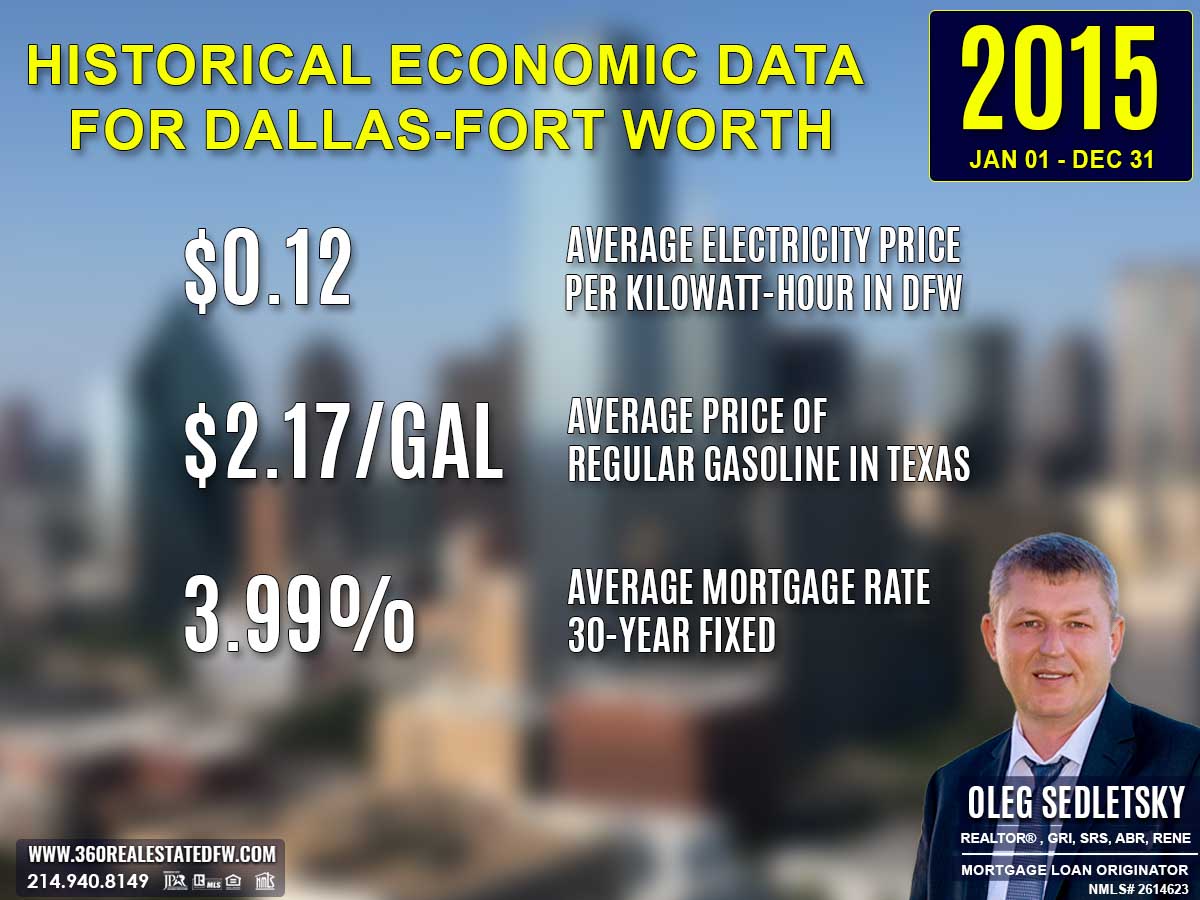
Average Electricity Costs in Dallas-Fort Worth in 2015
Electricity prices dipped to $0.12 per kilowatt-hour in 2015, down from $0.13 in 2014. This small decrease likely provided a bit of financial breathing room to households, which could have been channeled into homeownership costs. Prospective homebuyers looking for energy-friendly homes continued to dominate market trends.
Average Price for Regular Gasoline in Texas in 2015
Gas prices fell significantly to $2.17 per gallon in 2015, down from $3.15 in 2014. Plummeting fuel costs were a game-changer for homebuyers considering longer commutes. Lower transportation expenses made suburban and rural areas increasingly attractive, potentially driving demand for properties in these regions.
Average 30-Year Fixed Mortgage Rate in 2015
Mortgage rates declined slightly to 3.99% in 2015, down from 4.31% in 2014. homebuyers took advantage of this drop to enter the housing market or refinance existing loans for more affordable terms. Partnering with a local mortgage loan originator to secure pre-approval was crucial for those navigating the competitive environment fueled by lower rates.
Curious about today’s mortgage rates and the home you can comfortably afford?
Submit a no-obligation mortgage application today and get pre-approved to determine your budget and take the first step toward homeownership with confidence.
Overview of Differences Between the 2014 and 2015 Real Estate Markets in Prosper, Texas
Volume of Sales
A significant increase in sales occurred, with 667 homes sold in 2015, up from 530 in 2014, marking a 25.85% growth in closed transactions.
Pricing
- Average Price rose from $433,750 in 2014 to $445,343 in 2015, reflecting a more modest 2.6% increase compared to the previous year.
- Minimum Price increased from $76,000 to $87,000, showcasing rising entry-level prices.
- Maximum Price jumped from $1,750,000 to $2,100,000, emphasizing stronger activity in the luxury market.
Market Efficiency
Homes were selling slightly faster in 2015, with 84 average days on market, compared to 90 days in 2014.
The ClsPr/LstPr ratio remained steady, improving marginally from 97% in 2014 to 97.37% in 2015, indicating consistent pricing accuracy and demand.
Property Features
- The average home size grew, with square footage increasing from 3,476 sq. ft. (2014) to 3,539 sq. ft. (2015).
- Lot sizes saw a slight decrease on average, from 0.512 to 0.478 acres, as more homes were built on smaller lots.
- Bedrooms and Bathrooms remained consistent, with an average of 4 bedrooms and 4 bathrooms in both years.
Key Insights
The 2015 market built upon 2014’s solid foundation, with higher sales volume, increased prices, and faster turnover. These trends further underscore Prosper’s appeal to a wide range of buyers and its ability to support robust market dynamics across various property segments.
Summary of Real Estate Market Analysis for Prosper, TX in 2015
The 2015 real estate market in Prosper, TX showcased notable growth and adaptability, building on the successes of the prior year. With 667 homes closed, sales volumes saw a considerable rise, accompanied by modest price increases and improved market efficiency. A mix of upscale properties and diverse inventory captured the attention of buyers across various economic brackets. Favorable mortgage rates and stable demand further shaped the market into a dynamic and equitable environment for both buyers and sellers.
Homebuyers’ Perspective
The increased inventory in 2015, including 272 new construction homes and 115 properties with pools, created diverse options for homebuyers. The average sales price of $445,343 and low mortgage rates (around 3.99%) offered robust opportunities for investment while maintaining long-term affordability. However, with properties selling more quickly at an average of 84 days on market, buyers faced the challenge of acting decisively. Those seeking luxury homes also contended with rising prices in the high-end segment, as seen with the $2.1 million peak property sold. Overall, buyers enjoying the breadth of choice needed to balance their decisions with timely offers.
Home-Sellers’ Perspective
2015 marked an advantageous year for home sellers, driven by high buyer demand and efficient pricing. The year saw a 25.85% increase in closed transactions compared to 2014, signaling an active pool of buyers ready to transact. Sellers benefited from strong market conditions, with properties closing at 97.37% of listing prices on average and many achieving full listing values. Improved turnover times, with less time on the market, also brought faster results. Sellers with unique or luxurious properties found particular success, as the popularity of features like pools, multi-generational casitas, and premium finishes attracted generous offers. Capitalizing on rising values and buyer interest, sellers were well-positioned to maximize profits in Prosper’s favorable market conditions.
The Importance of Statistical Data in Prosper, Texas Real Estate Market
Did you know that Appraisers and Realtors rely on historical statistical data to determine a property’s current value?
The data above is just the beginning. This glimpse into the Prosper, Texas real estate market outlines trends but doesn’t capture the full picture. To truly understand the city’s housing market, you’ll need specific insights like zip code analyses, neighborhood breakdowns, and school-district-focused data. Historical trends and comprehensive analyses arm both homebuyers and home sellers with the tools they need to make decisions confidently.
The insights on this page represent just a small part of the comprehensive real estate services I provide to my clients. Whether you’re a buyer aiming to find your dream home or a seller looking to maximize your property’s value, I provide data-backed strategies tailored to your goals.
Reach out today—I’d love to help you achieve success in Prosper’s vibrant housing market!
Unlock Exceptional Service!
Assistance with all your real estate needs in the Dallas-Fort Worth area is just a click or call away. Reach out at 214-940-8149 or connect through the links below.
Meet Your Trusted Realtor and Mortgage Expert in Prosper, Texas!
Oleg Sedletsky REALTOR® in Prosper, Texas. Call/Text 214.940.8149
Greetings! I’m Oleg Sedletsky, and I’m excited to introduce myself as your go-to full-time licensed Texas REALTOR® and Mortgage Loan Originator.
I proudly represent JPAR® – Real Estate Brokerage as a REALTOR® and Utopia Mortgage LLC as a Mortgage Loan Originator! My designations and certifications reflect my dedication to helping you achieve your real estate goals in Prosper, TX and other locations in the vibrant Dallas-Fort Worth area!
With my expertise, I’ll provide you with in-depth resources, including detailed market reports and historical data, to help you make confident, well-informed decisions. Fluent in English, Ukrainian, and Russian, I’m here to guide you through every step of the process with personalized support and dedication.
It’s All About You and Your Real Estate Goals!
My mission is to serve you! With my knowledge and expertise, I’m here to help you achieve all your real estate goals!
I’m passionate about helping homebuyers and home-sellers navigate the exciting real estate landscape in Prosper, Texas! Whether you’re searching for your dream home, exploring land options, or looking for commercial properties, my Real Estate Services have you covered.
Contact me today for all your real estate needs in Prosper, Texas! Call/text 214-940-8149
A Comprehensive Analysis of Single-Family Residential Housing Market in Prosper, TX: 2010 to Present
Discover the trends, stats, and insights shaping Prosper’s real estate market year by year!
2010-2020
Prosper, TX Real Estate Market Report 2010: Analysis and Trends
Prosper, TX Real Estate Market Report 2011: Analysis and Trends
Prosper, TX Real Estate Market Report 2012: Analysis and Trends
Prosper, TX Real Estate Market Report 2013: Analysis and Trends
Prosper, TX Real Estate Market Report 2014: Analysis and Trends
Prosper, TX Real Estate Market Report 2015: Analysis and Trends
Prosper, TX Real Estate Market Report 2016: Analysis and Trends
Prosper, TX Real Estate Market Report 2017: Analysis and Trends
Prosper, TX Real Estate Market Report 2018: Analysis and Trends
Prosper, TX Real Estate Market Report 2019: Analysis and Trends
Prosper, TX Real Estate Market Report 2020: Analysis and Trends
This market analysis is intended solely for educational purposes. This market analysis is based on data sourced from NTREIS, Inc. This analysis is exclusively focused on single-family homes and does not account for other property types. The total number of real estate transactions within the specified period and location may vary. Data accuracy cannot be guaranteed due to potential input errors made by NTREIS users. This market analysis does not account for all new construction home sales. If you need detailed information about recorded property sales or other public records, please contact the appropriate city or county office.
Prosper, TX Real Estate: A Comprehensive Analysis of the 2014 Single-Family Residential Housing Market
The 2014 real estate market in Prosper, Texas experienced sustained activity, reflecting a healthy demand for residential single-family homes. With 530 properties sold, this analysis offers a detailed look into key market trends, including pricing dynamics, efficiency in transactions, and unique outliers that shaped the market.
Key Takeaways and Trends from the 2014 Real Estate Market in Prosper, TX
Pricing Range
The 2014 market showcased a broad range in pricing, from an entry-level home priced at $127,900 to a stunning $1.75M luxury estate. The average sales price of $402,382 demonstrates a slight increase from 2013, reflecting steady market appreciation.
Market Efficiency
Market efficiency improved, with most properties closing at 97.34% of their listing price and spending an average of only 76 days on the market. These metrics underline a competitive and streamlined market environment.
Unique Outliers
The most expensive home sold this year included a private Casita and luxury features, catering to multi-generational living. Such properties revealed evolving buyer preferences and further specialized the market.
Mortgage Rates Impact
With the 30-year fixed mortgage rate at 4.31%, slightly higher than 2013, affordability tightened moderately. However, this did not deter homebuyers, as sales volume increased by 2% from the previous year.
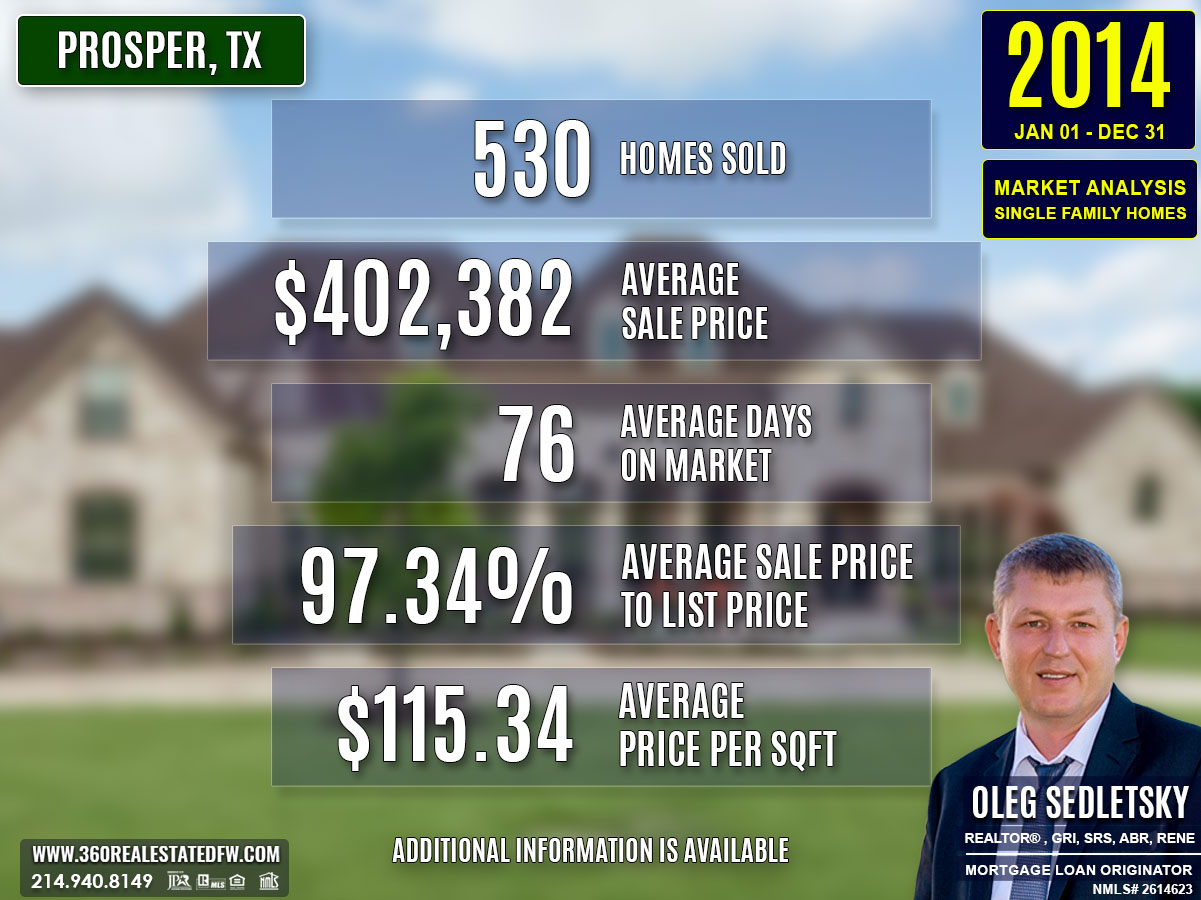
Total Homes Closed
Prosper’s real estate market saw 530 homes sold in 2014, reflecting a 2% increase compared to the previous year. Among these, 90 properties featured pools, showcasing buyer interest in recreational amenities. Additionally, there were 242 new construction homes, contributing heavily to inventory and meeting buyer demand for modern properties.
Property Pricing Insights
- Minimum Price: $127,900
- Maximum Price: $1,750,000
- Average Price: $402,382
- Median Price: $391,091
The pricing spectrum emphasized the diversity in market offerings, from budget-friendly options to high-end, luxury estates.
Property Size and Features
Buyers in 2014 enjoyed a variety of housing options:
- Bedrooms: 4 on average
- Bathrooms: 4 on average, including 3 full baths and 1 half bath
- Square Footage: Average home size of 3,448 sq. ft., with a median of 3,562 sq. ft.
- Lot Size: Properties ranged up to 10.11 acres, reflecting plenty of choices for those seeking expansive or compact spaces.
Market Dynamics
- Days on Market (DOM): Average of 76 days, indicating a slight increase compared to 2013 but still within a competitive range.
- ClsPr/LstPr Ratio: 97.34% demonstrates strong pricing strategies.
- ClsPr/OLP (Original Listing Price): 96.13%, further reinforcing efficient sales outcomes.
- Average Price per Square Foot: $115.34, up from the previous year, highlighting the appreciation of property value.
Insights into the Most Expensive Prosper, TX Property Sold in 2014
The pinnacle of luxury in 2014 was a sprawling estate sold at $1,750,000. Situated on a lot size of 1.183 acres, this property offered privacy and exclusivity. Notably, it achieved a ClsPr/LstPr ratio of 100% and a ClsPr/OLP ratio of 100%, indicating it sold at its full listing and original listing price. Built in 2007, the estate included a private Casita with a kitchenette, large bedroom, and full bath, catering to multi-generational living and luxury buyers.
- Beds: 4
- Baths: 5 (4 full, 1 half)
- Sq. Ft.: 6,045
- Price per Sq. Ft.: $289.50
- Lot Size: 1.183 acres
- DOM: Not specified, indicating a quick move due to demand.
- ClsPr/LstPr Ratio: 100%, marking a direct match between listing and sale prices.
- ClsPr/OLP Ratio: 100%, reflecting the strong desire for such a unique property.
- Year Built: 2007
This sale set a high benchmark, influencing the luxury segment and solidifying the demand for multi-functional, high-end homes.
Economic context
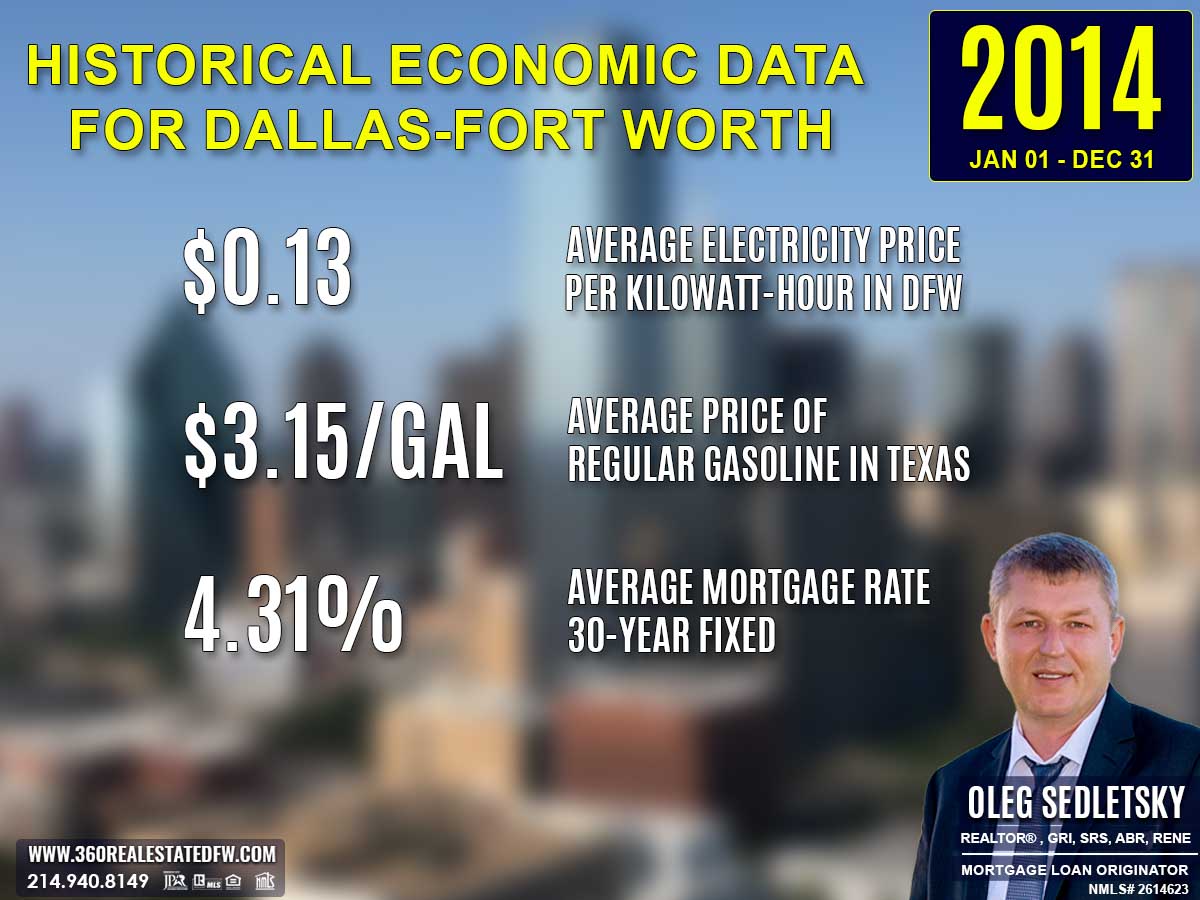
Average Electricity Costs in Dallas-Fort Worth in 2014
Electricity prices rose slightly to $0.13 per kilowatt-hour in 2014, up from $0.12 in 2013. This gradual increase added pressure to household budgets, further emphasizing the demand for energy-efficient properties. Sellers with homes featuring solar panels or updated appliances likely had an edge in the real estate market.
Average Price for Regular Gasoline in Texas in 2014
Gas prices decreased to $3.15 per gallon in 2014, down from $3.32 in 2013. Lower fuel costs may have encouraged homebuyers to look at properties in outer suburban areas, knowing transportation expenses were more manageable. This shift could have spurred demand in regions where homes were larger and more economical than urban alternatives.
Average 30-Year Fixed Mortgage Rate in 2014
Mortgage rates edged up to 4.31% in 2014 from the previous year’s 4.16%. This small increase emphasized the importance of timing in home purchases, as homebuyers aimed to lock in favorable terms before rates rose further. Securing pre-approval with a local mortgage loan originator remained a vital step for buyers to gain financial clarity during the purchasing process.
Curious about today’s mortgage rates and the home you can comfortably afford?
Submit a no-obligation mortgage application today and get pre-approved to determine your budget and take the first step toward homeownership with confidence.
Overview of Differences Between the 2013 and 2014 Real Estate Markets in Prosper, Texas
Volume of Sales
Sales increased from 519 homes in 2013 to 530 homes in 2014, indicating a 2% growth in overall market activity.
Pricing
- Average Price rose from $370,029 in 2013 to $402,382 in 2014, reflecting an appreciation trend.
- Minimum Price increased slightly from $120,000 to $127,900,
- Maximum Price saw a slight decrease from $1.9M in 2013 to $1.75M in 2014, signaling steady luxury market activity.
Market Efficiency
Days on Market (DOM) rose slightly from 67 days in 2013 to 76 days in 2014, indicating a slightly slower market.
The ClsPr/LstPr ratio remained strong at 97.34% in 2014, compared to 98.46% in 2013, showing consistent efficiency and pricing strategies.
Property Features
- Bedrooms and Bathrooms averages remained consistent at 4 each in both years.
- Square Footage slightly rose, with the average property size increasing from 3,385 sq. ft. in 2013 to 3,448 sq. ft. in 2014.
- Lot Size saw a minor adjustment, continuing to provide diverse options for smaller urban properties and expansive lots.
Key Takeaway
The 2014 market built on 2013’s momentum with more homes sold and higher average prices, while maintaining strong market efficiency and balanced property features, reinforcing Prosper’s appeal to a wide range of buyers.
Summary of Real Estate Market Analysis for Prosper, TX in 2014
The 2014 real estate market in Prosper, Texas continued its upward trajectory, showcasing a rise in home sales, increased average prices, and steady market demand. With 530 homes sold, the market proved resilient, balancing competitive pricing and efficient transactions. While the luxury market saw minor recalibration, the overall landscape remained favorable for both buyers and sellers, reflecting a vibrant and stable housing environment.
Homebuyers’ Perspective
Homebuyers in 2014 encountered both opportunities and some challenges. The modest rise in inventory, bolstered by 242 new construction homes, provided a wider selection of modern and family-oriented properties. Pricing trends showed an overall rise in average prices, signaling market appreciation, yet there were still viable entry points, with homes starting as low as $127,900.
Mortgage rates, slightly elevated at 4.31%, posed a mild affordability challenge, but they remained historically low, creating a still-favorable borrowing environment. Buyers needed to act decisively in a market with homes averaging just 76 days on the market while working with knowledgeable agents to secure competitive properties.
Home-Sellers’ Perspective
For home sellers, 2014 presented prime opportunities to capitalize on rising property values and high buyer demand. With average sales prices climbing to $402,382 and 97.34% of listing prices consistently achieved, sellers enjoyed significant leverage in transactions. Homes with unique or modern features, such as pools or ample square footage, were particularly sought after, allowing sellers in these niches to maximize their returns.
Although the average days on market increased slightly, it remained competitive, enabling sellers to secure solid offers within a reasonable timeframe. Efficient pricing and skilled marketing strategies continued to be key for sellers to stand out and achieve optimal results.
Final Thoughts
The 2014 Prosper, TX real estate market offered valuable opportunities for buyers and sellers alike. By staying informed and using the market’s strengths to their advantage, participants were well-poised to achieve their real estate objectives in this dynamic market.
The Importance of Statistical Data in Prosper, Texas Real Estate Market
Did you know that Appraisers and Realtors rely on historical statistical data to determine a property’s current value?
The data above is just the beginning. This glimpse into the Prosper, Texas real estate market outlines trends but doesn’t capture the full picture. To truly understand the city’s housing market, you’ll need specific insights like zip code analyses, neighborhood breakdowns, and school-district-focused data. Historical trends and comprehensive analyses arm both homebuyers and home sellers with the tools they need to make decisions confidently.
The insights on this page represent just a small part of the comprehensive real estate services I provide to my clients. Whether you’re a buyer aiming to find your dream home or a seller looking to maximize your property’s value, I provide data-backed strategies tailored to your goals.
Reach out today—I’d love to help you achieve success in Prosper’s vibrant housing market!
Unlock Exceptional Service!
Assistance with all your real estate needs in the Dallas-Fort Worth area is just a click or call away. Reach out at 214-940-8149 or connect through the links below.
Meet Your Trusted Realtor and Mortgage Expert in Prosper, Texas!
Oleg Sedletsky REALTOR® in Prosper, Texas. Call/Text 214.940.8149
Greetings! I’m Oleg Sedletsky, and I’m excited to introduce myself as your go-to full-time licensed Texas REALTOR® and Mortgage Loan Originator.
I proudly represent JPAR® – Real Estate Brokerage as a REALTOR® and Utopia Mortgage LLC as a Mortgage Loan Originator! My designations and certifications reflect my dedication to helping you achieve your real estate goals in Prosper, TX and other locations in the vibrant Dallas-Fort Worth area!
With my expertise, I’ll provide you with in-depth resources, including detailed market reports and historical data, to help you make confident, well-informed decisions. Fluent in English, Ukrainian, and Russian, I’m here to guide you through every step of the process with personalized support and dedication.
It’s All About You and Your Real Estate Goals!
My mission is to serve you! With my knowledge and expertise, I’m here to help you achieve all your real estate goals!
I’m passionate about helping homebuyers and home-sellers navigate the exciting real estate landscape in Prosper, Texas! Whether you’re searching for your dream home, exploring land options, or looking for commercial properties, my Real Estate Services have you covered.
Contact me today for all your real estate needs in Prosper, Texas! Call/text 214-940-8149
A Comprehensive Analysis of Single-Family Residential Housing Market in Prosper, TX: 2010 to Present
Discover the trends, stats, and insights shaping Prosper’s real estate market year by year!
2010-2020
Prosper, TX Real Estate Market Report 2010: Analysis and Trends
Prosper, TX Real Estate Market Report 2011: Analysis and Trends
Prosper, TX Real Estate Market Report 2012: Analysis and Trends
Prosper, TX Real Estate Market Report 2013: Analysis and Trends
Prosper, TX Real Estate Market Report 2014: Analysis and Trends
Prosper, TX Real Estate Market Report 2015: Analysis and Trends
Prosper, TX Real Estate Market Report 2016: Analysis and Trends
Prosper, TX Real Estate Market Report 2017: Analysis and Trends
Prosper, TX Real Estate Market Report 2018: Analysis and Trends
Prosper, TX Real Estate Market Report 2019: Analysis and Trends
Prosper, TX Real Estate Market Report 2020: Analysis and Trends
This market analysis is intended solely for educational purposes. This market analysis is based on data sourced from NTREIS, Inc. This analysis is exclusively focused on single-family homes and does not account for other property types. The total number of real estate transactions within the specified period and location may vary. Data accuracy cannot be guaranteed due to potential input errors made by NTREIS users. This market analysis does not account for all new construction home sales. If you need detailed information about recorded property sales or other public records, please contact the appropriate city or county office.
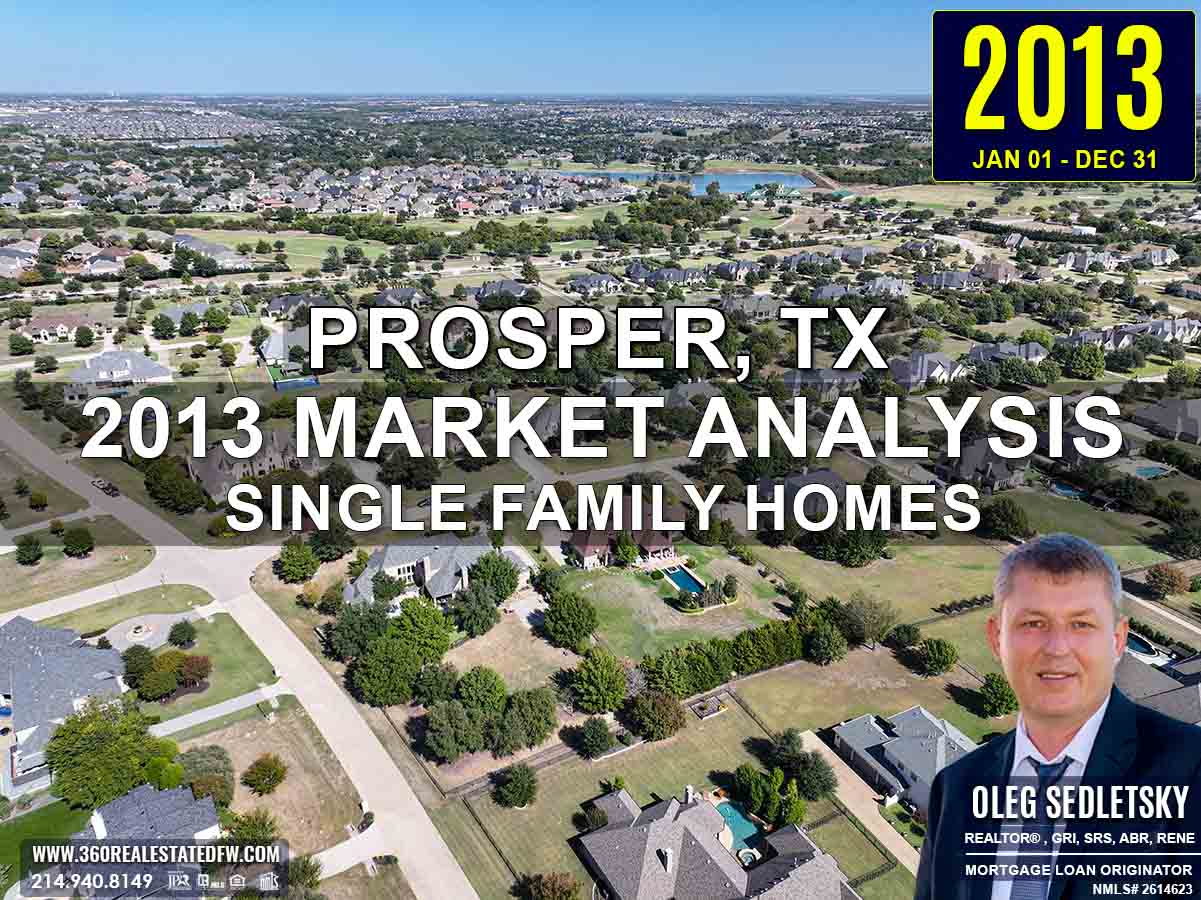
Prosper, TX Real Estate: A Comprehensive Analysis of the 2013 Single-Family Residential Housing Market
The 2013 real estate market in Prosper, Texas witnessed remarkable growth and activity. With 519 single-family homes sold, this year marked increased buyer engagement and larger inventory availability. From dynamic price ranges to outstanding market efficiency and high-value luxury properties, this analysis captures the key insights that shaped the market landscape in 2013.
Key Takeaways and Trends from the 2013 Real Estate Market in Prosper, TX
1. Pricing Range
Prices varied significantly, ranging from $85,000 for entry-level homes to $1,900,000 for a luxury estate. This range reflects Prosper’s diverse market and broad appeal to different buyer demographics.
2. Market Efficiency
Market efficiency improved drastically, with a higher average ClsPr/LstPr ratio of 98.46% and faster turnover times, as the average DOM reduced to just 67 days.
3. Unique Outliers
The most expensive property of 2013, with expansive wooded acreage, a six-car garage, and luxury features, stood out as a unique highlight at $1,900,000.
4. Mortgage Rates Impact
The rise in mortgage rates to 4.16% created marginal cost increases for buyers but did not hinder the surge in home sales or price growth.
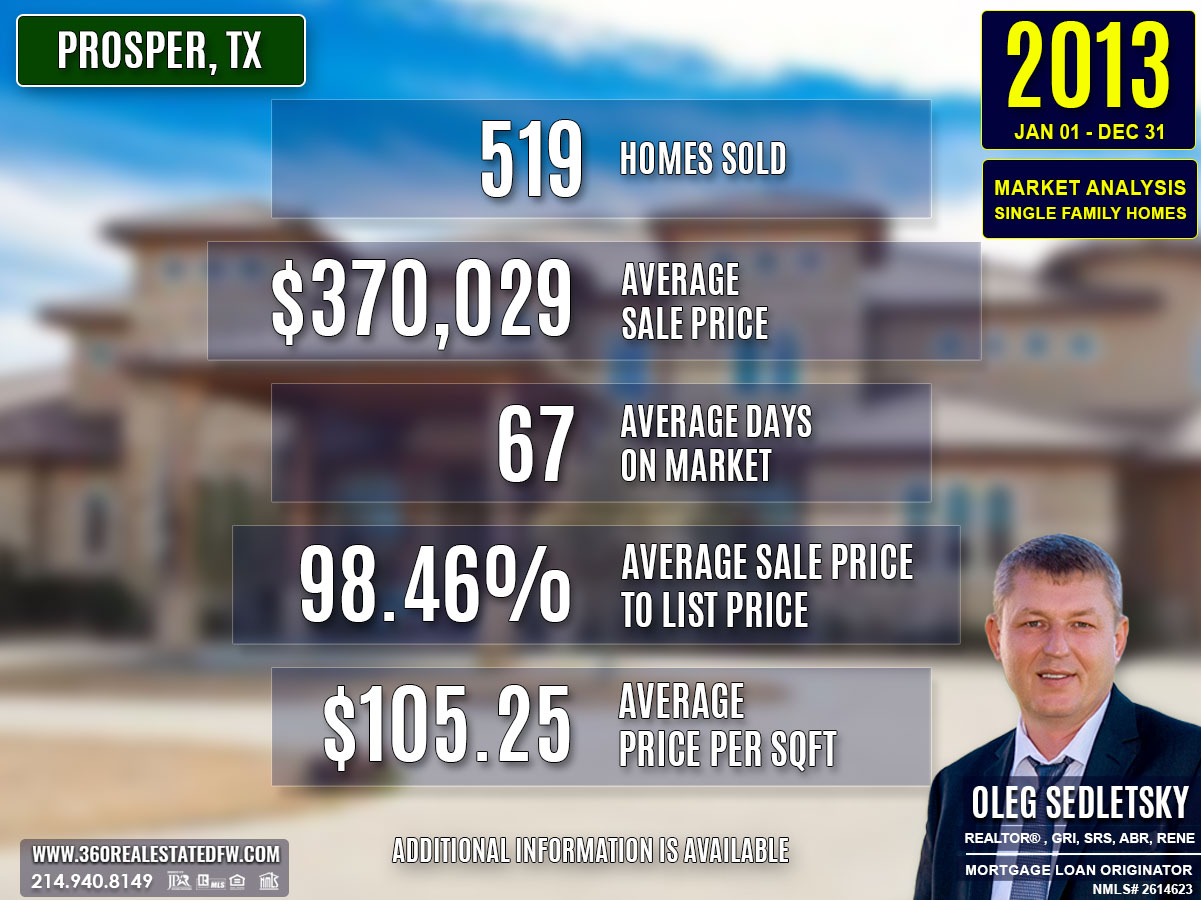
Total Homes Closed
The year ended with the successful closure of 519 single-family homes, a substantial 37% increase in sales over 2012. Among these sales, buyers showed a strong affinity for the 221 new construction homes, while 72 homes featured private pools, highlighting desirable amenities.
Property Pricing Insights
- Minimum Price: $85,000
- Maximum Price: $1,900,000
- Average Price: $370,029
- Median Price: $355,000
The higher maximum price and average price both showcase increased demand across all price levels.
Property Size and Features
- Bedrooms: Homes ranged between 2 and 6 bedrooms, with an average of 4 bedrooms.
- Bathrooms: Properties featured 1 to 8 bathrooms, while the average home included 4 bathrooms.
- Square Footage: Total living areas ranged between 882 sq. ft to an expansive 9,451 sq. ft., with the median size being 3,541 sq. ft.
- Lot Sizes: Properties ranged from compact city lots to a vast 10-acre wooded estate.
Market Dynamics
- Days on Market (DOM) averaged only 67 days, representing a significant improvement in sales speed compared to 87 days in 2012.
- ClsPr/LstPr ratio rose to 98.46%, reflecting improved alignment between listing and closing prices.
- ClsPr/OLP ratio increased to 97.45%, indicating accurate initial pricing strategies.
- Average Price per SqFt climbed to $105.25, showcasing an appreciation in property value.
Insights into the Most Expensive Prosper, TX Property Sold in 2013
The most luxurious property sold in 2013 made a lasting impression on Prosper’s real estate market:
- Price: $1,900,000
- Beds: 5
- Baths: 8 (5 full, 3 half)
- Square Footage: 9,451 sq. ft.
- Price per SqFt: $201.04
- Lot Size: 10 acres
- Days on Market (DOM): 115 days
- ClsPr/LstPr Ratio: 82.61%
- ClsPr/OLP Ratio: 82.61%
- Year Built: 2008
Its premium features, such as a six-car garage and a private pool, captured the upper echelon of buyer interest. Though slightly overlisted, the sale of this estate magnifies the evolving demand for unique and expansive luxury homes.
Economic context

Average Electricity Costs in Dallas-Fort Worth in 2013
Electricity prices increased to $0.12 per kilowatt-hour in 2013, compared to $0.11 in 2012. This slight rise might have led consumers to reassess their energy usage and consider more energy-efficient homes. Real estate agents likely saw growing interest in properties with features like modern insulation or smart energy systems, which could offset rising utility expenses.
Average Price for Regular Gasoline in Texas in 2013
Gas prices decreased to $3.32 per gallon in 2013, down slightly from $3.42 in 2012. This minor drop helped ease transportation costs for homebuyers. With slightly lower fuel expenses, potential buyers may have been more open to properties in suburban areas, especially if housing prices were more competitive than in urban locations.
Average 30-Year Fixed Mortgage Rate in 2013
Mortgage rates inched up to 4.16% in 2013 from 3.88% in the prior year. While the increase wasn’t drastic, it may have nudged some homebuyers to act sooner rather than later to secure financing. Homebuyers are encouraged to work with local mortgage loan originators to ensure they understand their borrowing capabilities and can lock in competitive rates with ease.
Curious about today’s mortgage rates and the home you can comfortably afford?
Submit a no-obligation mortgage application today and get pre-approved to determine your budget and take the first step toward homeownership with confidence.
Overview of Differences Between the 2012 and 2013 Real Estate Markets in Prosper, Texas
Volume of Sales
Sales increased significantly from 378 homes in 2012 to 519 homes in 2013, marking a 37% growth in activity.
Pricing
- Average Price rose from $343,523 in 2012 to $370,029 in 2013, showcasing market appreciation.
- Minimum Price dropped slightly from $116,375 in 2012 to $85,000 in 2013, expanding affordability for entry-level homes.
- Maximum Price more than doubled, jumping from $970,000 in 2012 to $1,900,000 in 2013, driven by premium luxury properties.
Market Efficiency
Homes spent an average of 67 days on market (DOM) in 2013, a sharp improvement from 87 days in 2012, highlighting quicker sales.
The ClsPr/LstPr ratio improved from 96.86% in 2012 to 98.46% in 2013, reflecting better alignment between listing and closing prices.
Property Features
- The average number of bedrooms and bathrooms remained consistent, at 4 bedrooms and 4 bathrooms.
- Square footage showed minor differences, with a median of 3,541 sq. ft. in 2013 compared to 3,591 sq. ft. in 2012.
- Largest lot size grew from 6.29 acres in 2012 to an expansive 10 acres in 2013, showcasing availability of larger properties.
Key Takeaway
The 2013 market stood out for its higher sales volume, significant luxury home transactions, and improved market efficiency, setting new benchmarks in Prosper’s real estate landscape.
Summary of Real Estate Market Analysis for Prosper, TX in 2013
The 2013 real estate market in Prosper, Texas demonstrated substantial growth and resilience, driven by higher sales volumes, rising prices, and faster transactions. With 519 homes sold, an increase of 37% from the previous year, the market was vibrant and efficient. Buyers benefited from diverse options ranging from modest starter homes to luxurious estates, while sellers enjoyed strong demand and competitive pricing.
Homebuyers’ Perspective
The increased inventory in 2013 provided homebuyers with a mix of opportunities and challenges. The market offered a wider range of properties, with new construction homes and luxury options becoming more available. However, the rise in average home prices to $370,029 meant buyers needed to act decisively, especially with homes spending an average of just 67 days on the market.
While mortgage rates increased slightly to 4.16%, the market’s competitiveness and varied inventory ensured buyers could still find properties suited to their needs. Whether seeking starter homes or expansive estates, buyers benefited from a dynamic market ready to accommodate a variety of preferences. Strategic planning and the guidance of an experienced realtor could make the process smoother and help secure the best opportunities.
Home-Sellers’ Perspective
For home sellers, 2013 was a golden year to put properties on the market. With demand at a peak and homes selling faster than in 2012, sellers had the upper hand. The improved close price to listing price ratio of 98.46% reflected the accurate pricing strategies being employed, while the uptick in property value, as seen in the average price per square foot of $105.25, favored seller returns.
The luxury market also soared, with properties like the record-breaking $1.9 million estate showcasing the appetite for premium homes. Sellers who leveraged this demand and effectively highlighted their property features were able to capitalize on the year’s market trends. Engaging a realtor with a deep understanding of the local market could further amplify these advantages, ensuring properties received maximum exposure and competitive offers.
Final Thoughts
Overall, 2013 in Prosper, TX was a year of opportunity for both buyers and sellers. With careful planning, an informed approach, and expert guidance, participants in the market were well-positioned to achieve their real estate goals.
The Importance of Statistical Data in Prosper, Texas Real Estate Market
Did you know that Appraisers and Realtors rely on historical statistical data to determine a property’s current value?
The data above is just the beginning. This glimpse into the Prosper, Texas real estate market outlines trends but doesn’t capture the full picture. To truly understand the city’s housing market, you’ll need specific insights like zip code analyses, neighborhood breakdowns, and school-district-focused data. Historical trends and comprehensive analyses arm both homebuyers and home sellers with the tools they need to make decisions confidently.
The insights on this page represent just a small part of the comprehensive real estate services I provide to my clients. Whether you’re a buyer aiming to find your dream home or a seller looking to maximize your property’s value, I provide data-backed strategies tailored to your goals.
Reach out today—I’d love to help you achieve success in Prosper’s vibrant housing market!
Unlock Exceptional Service!
Assistance with all your real estate needs in the Dallas-Fort Worth area is just a click or call away. Reach out at 214-940-8149 or connect through the links below.
Meet Your Trusted Realtor and Mortgage Expert in Prosper, Texas!
Oleg Sedletsky REALTOR® in Prosper, Texas. Call/Text 214.940.8149
Greetings! I’m Oleg Sedletsky, and I’m excited to introduce myself as your go-to full-time licensed Texas REALTOR® and Mortgage Loan Originator.
I proudly represent JPAR® – Real Estate Brokerage as a REALTOR® and Utopia Mortgage LLC as a Mortgage Loan Originator! My designations and certifications reflect my dedication to helping you achieve your real estate goals in Prosper, TX and other locations in the vibrant Dallas-Fort Worth area!
With my expertise, I’ll provide you with in-depth resources, including detailed market reports and historical data, to help you make confident, well-informed decisions. Fluent in English, Ukrainian, and Russian, I’m here to guide you through every step of the process with personalized support and dedication.
It’s All About You and Your Real Estate Goals!
My mission is to serve you! With my knowledge and expertise, I’m here to help you achieve all your real estate goals!
I’m passionate about helping homebuyers and home-sellers navigate the exciting real estate landscape in Prosper, Texas! Whether you’re searching for your dream home, exploring land options, or looking for commercial properties, my Real Estate Services have you covered.
Contact me today for all your real estate needs in Prosper, Texas! Call/text 214-940-8149
A Comprehensive Analysis of Single-Family Residential Housing Market in Prosper, TX: 2010 to Present
Discover the trends, stats, and insights shaping Prosper’s real estate market year by year!
2010-2020
Prosper, TX Real Estate Market Report 2010: Analysis and Trends
Prosper, TX Real Estate Market Report 2011: Analysis and Trends
Prosper, TX Real Estate Market Report 2012: Analysis and Trends
Prosper, TX Real Estate Market Report 2013: Analysis and Trends
Prosper, TX Real Estate Market Report 2014: Analysis and Trends
Prosper, TX Real Estate Market Report 2015: Analysis and Trends
Prosper, TX Real Estate Market Report 2016: Analysis and Trends
Prosper, TX Real Estate Market Report 2017: Analysis and Trends
Prosper, TX Real Estate Market Report 2018: Analysis and Trends
Prosper, TX Real Estate Market Report 2019: Analysis and Trends
Prosper, TX Real Estate Market Report 2020: Analysis and Trends
This market analysis is intended solely for educational purposes. This market analysis is based on data sourced from NTREIS, Inc. This analysis is exclusively focused on single-family homes and does not account for other property types. The total number of real estate transactions within the specified period and location may vary. Data accuracy cannot be guaranteed due to potential input errors made by NTREIS users. This market analysis does not account for all new construction home sales. If you need detailed information about recorded property sales or other public records, please contact the appropriate city or county office.
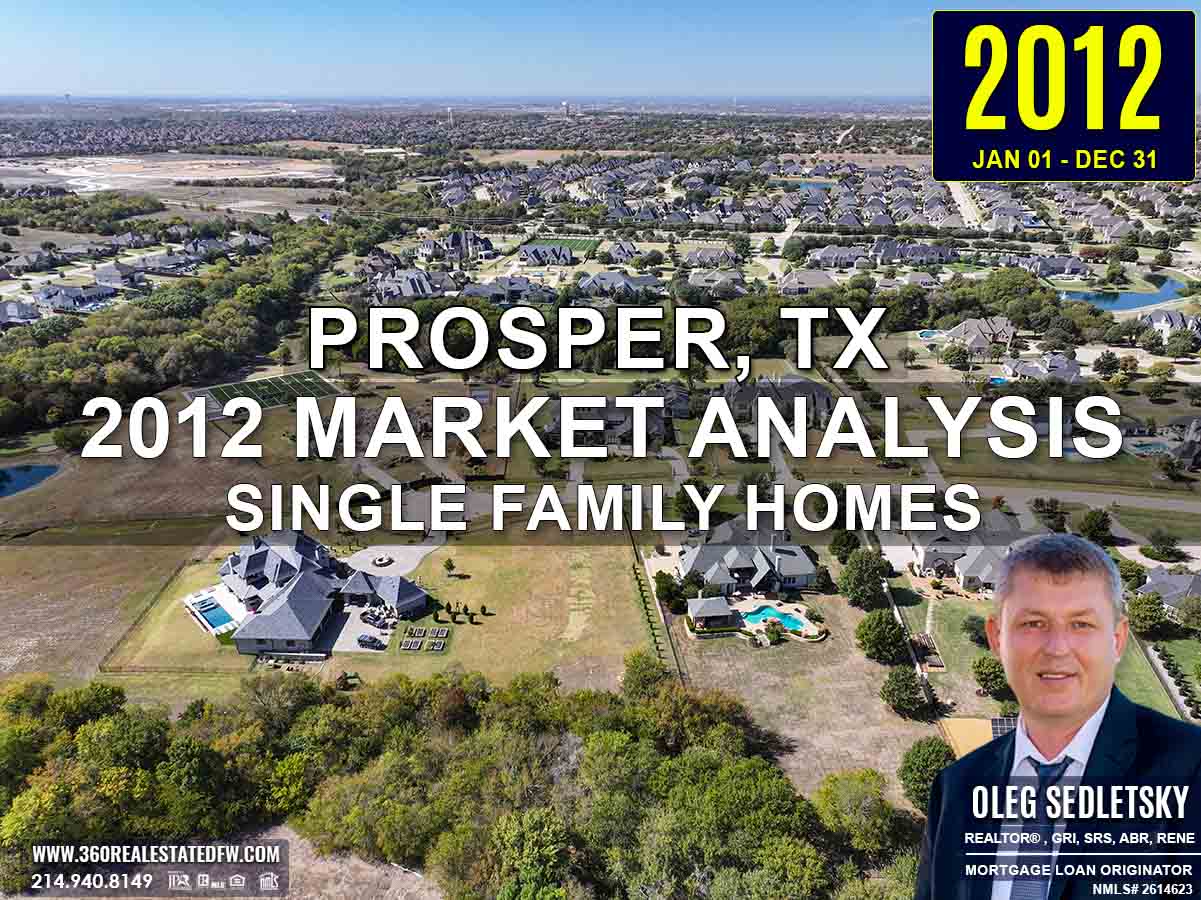
Prosper, TX Real Estate: A Comprehensive Analysis of the 2012 Single-Family Residential Housing Market
The 2012 real estate market in Prosper, Texas was a year of notable growth and dynamic trends. Closing with an impressive number of deals and stronger market efficiency, this year set a benchmark in both property diversity and buyer activity. This detailed analysis provides insights into these trends and their relevance in understanding Prosper’s housing market trajectory.
Key Takeaways and Trends from the 2012 Real Estate Market in Prosper, TX
1. Pricing Range
The price spectrum expanded in 2012, with homes ranging from $116,375 to $970,000. The maximum sale price decreased from 2011’s $1,499,000 but still highlights a premium market segment’s presence.
2. Market Efficiency
The market demonstrated efficiency with a slightly higher ClsPr/LstPr ratio of 96.86% and fewer average days on market (87), reflecting enhanced competitiveness across different price tiers.
3. Unique Outliers
The most expensive property stood out with luxury features like a climate-controlled 4-car garage, outdoor living spaces, a pool, spa, and a 50×32 four-stall barn, set on a 6.29-acre lot. This property underscores the appeal of high-end amenities in Prosper.
4. Mortgage Rates Impact
Favorable mortgage rates (3.88%) enhanced buyer affordability, fostering higher sales volume and expanding opportunities for more buyers in the market.
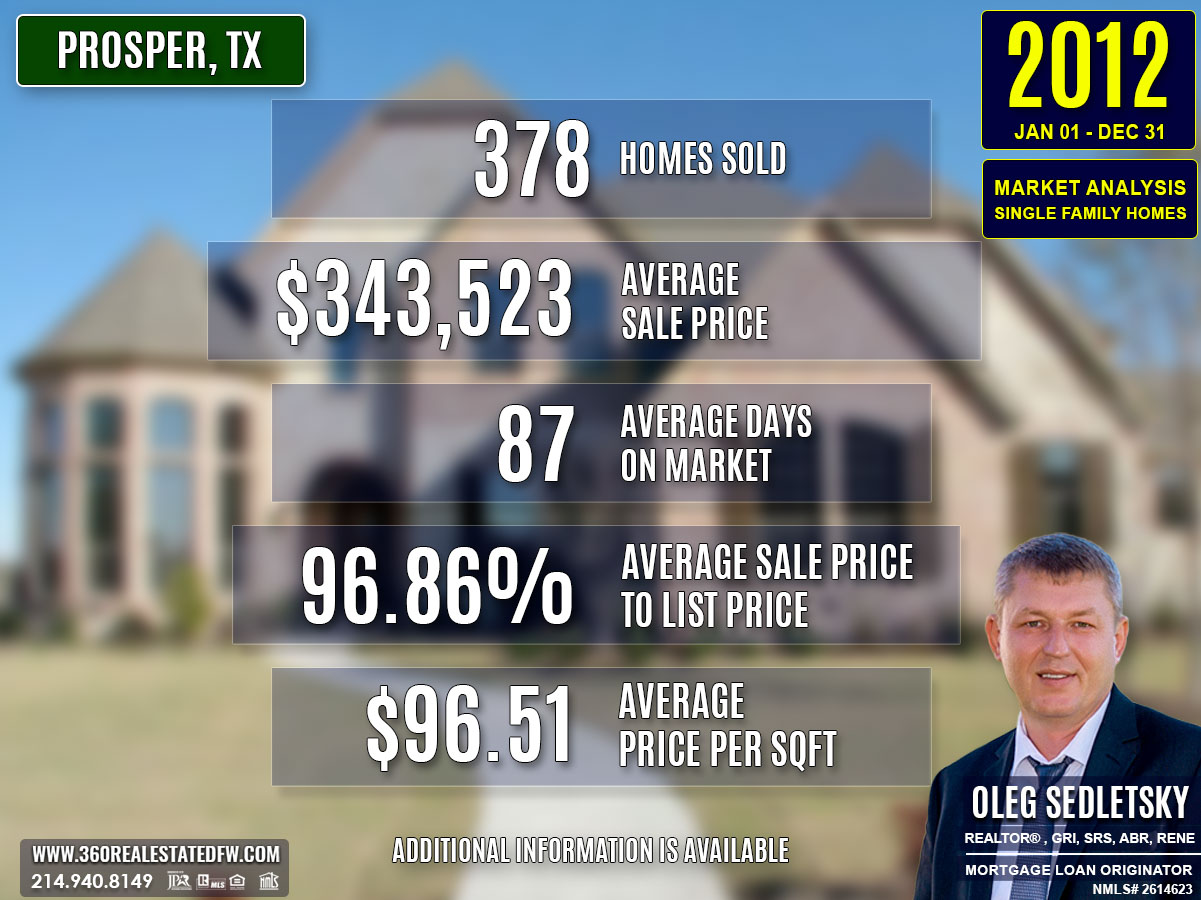
Total Homes Closed
A total of 378 residential single-family homes were closed, reflecting a 36% rise from the previous year. Of these, 205 were new construction properties, representing modern build options for homebuyers. Additionally, 55 homes featured pools, catering to lifestyle-focused buyers.
Property Pricing Insights
- Minimum Price: $116,375
- Maximum Price: $970,000
- Average Price: $343,523
- Median Price: $322,550
Property Size and Features
- Bedrooms: Properties had between 3 and 6 bedrooms, with an average of 4.
- Bathrooms: Ranged from 2 to 9, averaging 4 bathrooms.
- Square Footage: Properties spanned from 1,768 up to 6,295 square feet, with a median size of 3,591 sq. ft.
- Lot Size: Lot areas ranged from smaller urban parcels to expansive plots of 6.29 acres.
Market Dynamics
- Days on Market (DOM) averaged 87 days, marking faster sales compared to 2011’s 93 days.
- ClsPr/LstPr (Close Price to Listing Price): 96.86%, an improvement over 2011.
- ClsPr/OLP (Close Price to Original Listing Price): 93.72%, reflecting more accurate list pricing from sellers.
- Average Price per SqFt rose slightly to $96.51, indicating steady demand and value maintenance.
Insights into the Most Expensive Prosper, TX Property Sold in 2012
The most expensive property sold in 2012 showcases luxury living and extensive amenities, contributing significantly to the year’s market dynamics.
- Price: $970,000
- Beds: 4
- Baths: 5 (4 full, 1 half)
- Square Footage: 5,037 sq. ft.
- Price per SqFt: $192.57
- Lot Size: 6.29 acres
- Days on Market (DOM): 24
- ClsPr/LstPr Ratio: 97.49%
- ClsPr/OLP Ratio: 97.49%
- Year Built: 2002
This property’s quick sale at near-list price illustrates strong demand for premium, amenity-rich homes in Prosper.
Economic context

Average Electricity Costs in Dallas-Fort Worth in 2012
Electricity prices remained steady at $0.11 per kilowatt-hour in 2012, unchanged from 2011. This stability helped maintain predictability in household budgets, supporting steady investment in real estate. homebuyers could better evaluate prospective homes based on fixed utility costs, encouraging confident decision-making.
Average Price for Regular Gasoline in Texas in 2012
Gas prices rose slightly to $3.42 per gallon in 2012, up from $3.37 in 2011. homebuyers continued to prioritize location and proximity to public transit or work, as elevated gas prices increased commuting expenses. Properties in walkable neighborhoods likely gained more attention during this period.
Average 30-Year Fixed Mortgage Rate in 2012
Mortgage rates dropped significantly to 3.88% in 2012, down from 4.65% the previous year. This marked a historic low that spurred homebuyer activity, particularly for those locking in long-term affordability. Pre-approvals through local mortgage loan originators became an invaluable step in maximizing homebuyer advantages amidst this rate decline.
Curious about today’s mortgage rates and the home you can comfortably afford?
Submit a no-obligation mortgage application today and get pre-approved to determine your budget and take the first step toward homeownership with confidence.
Overview of Differences Between the 2011 and 2012 Real Estate Markets in Prosper, Texas
Volume of Sales
Sales saw a notable increase, with 378 homes sold in 2012, compared to 279 homes in 2011, indicating a rise in buyer activity and market demand.
Pricing
- Average Sales Price slightly decreased from $347,939 in 2011 to $343,523 in 2012, reflecting market stability despite overall growth.
- Minimum Price dropped from $150,000 in 2011 to $116,375 in 2012, offering more entry-level options for buyers.
- Maximum Price declined from $1.49M in 2011 to $970,000 in 2012, reflecting fewer ultra-luxury transactions.
Market Efficiency
The average days on market (DOM) improved, decreasing from 93 days in 2011 to 87 days in 2012, showcasing a faster-moving market.
The close price to listing price ratio (ClsPr/LstPr) rose slightly from 95.58% in 2011 to 96.86% in 2012, indicating tighter alignment between seller expectations and buyer offers.
Property Features
- The average home size experienced a small decline, with 3,516 sq. ft. in 2012 compared to 3,659 sq. ft. in 2011, showing a shift toward moderately sized homes.
- Bedroom and bathroom counts remained consistent at an average of 4 bedrooms and 4 bathrooms.
- Lot sizes remained steady, averaging around 0.4 acres, balancing space with practicality.
This comparison highlights a maturing market with increased sales activity, improved efficiency, and slightly reduced pricing, catering to a broader range of buyers while maintaining core property features.
Summary of Real Estate Market Analysis for Prosper, TX in 2012
The 2012 real estate market in Prosper, Texas showcased a dynamic and competitive landscape. With a significant increase in sales activity, lower mortgage rates, and a wide array of property options, it was a year marked by growth and opportunity. Both homebuyers and home-sellers faced unique challenges and advantages as market trends influenced decisions and outcomes. Below, we present insights to help each group better understand the opportunities 2012 brought forward.
Homebuyers Perspective
For homebuyers, 2012 offered a promising yet competitive environment. The year boasted historically low mortgage rates of 3.88%, making homeownership more affordable. The broad pricing spectrum, ranging from entry-level homes at $116,375 to luxury estates at $970,000, ensured there were opportunities for a variety of budgets. However, the relatively fast-moving market, with homes spending an average of just 87 days on the market, required buyers to act quickly.
To succeed, buyers needed to leverage expertise and market insights. Partnering with a knowledgeable real estate professional allowed them to identify properties aligning with their needs and budget while navigating competition effectively.
Home Sellers Perspective
For home-sellers, 2012 presented an optimistic market landscape. The increased buyer demand and enhanced close-to-list price ratio of 96.86% signaled a healthy appetite for fairly priced and well-presented properties. Additionally, homes sold faster than in the previous year, with a median of 55 days on the market, showcasing growing efficiency.
Sellers, however, faced challenges in the upper-tier luxury segment, as maximum sales prices experienced a decline. Highlighting unique property attributes, such as pools, acreage, or modern amenities, and strategically pricing their homes were crucial steps to attract buyers in this competitive environment. Those who partnered with a skilled realtor maximized their chances of securing favorable outcomes and shorter sale timelines.
Final Thoughts
Both homebuyers and home-sellers were positioned for success in Prosper’s 2012 market, provided they adapted to these evolving dynamics. A well-informed strategy, guided by local real estate expertise, allowed both parties to seize the opportunities available in the year’s robust and active housing market.
The Importance of Statistical Data in Prosper, Texas Real Estate Market
Did you know that Appraisers and Realtors rely on historical statistical data to determine a property’s current value?
The data above is just the beginning. This glimpse into the Prosper, Texas real estate market outlines trends but doesn’t capture the full picture. To truly understand the city’s housing market, you’ll need specific insights like zip code analyses, neighborhood breakdowns, and school-district-focused data. Historical trends and comprehensive analyses arm both homebuyers and home sellers with the tools they need to make decisions confidently.
The insights on this page represent just a small part of the comprehensive real estate services I provide to my clients. Whether you’re a buyer aiming to find your dream home or a seller looking to maximize your property’s value, I provide data-backed strategies tailored to your goals.
Reach out today—I’d love to help you achieve success in Prosper’s vibrant housing market!
Unlock Exceptional Service!
Assistance with all your real estate needs in the Dallas-Fort Worth area is just a click or call away. Reach out at 214-940-8149 or connect through the links below.
Meet Your Trusted Realtor and Mortgage Expert in Prosper, Texas!
Oleg Sedletsky REALTOR® in Prosper, Texas. Call/Text 214.940.8149
Greetings! I’m Oleg Sedletsky, and I’m excited to introduce myself as your go-to full-time licensed Texas REALTOR® and Mortgage Loan Originator.
I proudly represent JPAR® – Real Estate Brokerage as a REALTOR® and Utopia Mortgage LLC as a Mortgage Loan Originator! My designations and certifications reflect my dedication to helping you achieve your real estate goals in Prosper, TX and other locations in the vibrant Dallas-Fort Worth area!
With my expertise, I’ll provide you with in-depth resources, including detailed market reports and historical data, to help you make confident, well-informed decisions. Fluent in English, Ukrainian, and Russian, I’m here to guide you through every step of the process with personalized support and dedication.
It’s All About You and Your Real Estate Goals!
My mission is to serve you! With my knowledge and expertise, I’m here to help you achieve all your real estate goals!
I’m passionate about helping homebuyers and home-sellers navigate the exciting real estate landscape in Prosper, Texas! Whether you’re searching for your dream home, exploring land options, or looking for commercial properties, my Real Estate Services have you covered.
Contact me today for all your real estate needs in Prosper, Texas! Call/text 214-940-8149
A Comprehensive Analysis of Single-Family Residential Housing Market in Prosper, TX: 2010 to Present
Discover the trends, stats, and insights shaping Prosper’s real estate market year by year!
2010-2020
Prosper, TX Real Estate Market Report 2010: Analysis and Trends
Prosper, TX Real Estate Market Report 2011: Analysis and Trends
Prosper, TX Real Estate Market Report 2012: Analysis and Trends
Prosper, TX Real Estate Market Report 2013: Analysis and Trends
Prosper, TX Real Estate Market Report 2014: Analysis and Trends
Prosper, TX Real Estate Market Report 2015: Analysis and Trends
Prosper, TX Real Estate Market Report 2016: Analysis and Trends
Prosper, TX Real Estate Market Report 2017: Analysis and Trends
Prosper, TX Real Estate Market Report 2018: Analysis and Trends
Prosper, TX Real Estate Market Report 2019: Analysis and Trends
Prosper, TX Real Estate Market Report 2020: Analysis and Trends
This market analysis is intended solely for educational purposes. This market analysis is based on data sourced from NTREIS, Inc. This analysis is exclusively focused on single-family homes and does not account for other property types. The total number of real estate transactions within the specified period and location may vary. Data accuracy cannot be guaranteed due to potential input errors made by NTREIS users. This market analysis does not account for all new construction home sales. If you need detailed information about recorded property sales or other public records, please contact the appropriate city or county office.
Prosper, TX Real Estate: A Comprehensive Analysis of the 2011 Single-Family Residential Housing Market
The 2011 real estate market in Prosper, Texas showed an increase in activity and intriguing market dynamics compared to the prior year. With 279 single-family homes sold, representing a 21% jump in sales volume, the market offered varied opportunities for buyers and sellers. This analysis explores key data points, trends, and the implications of market shifts to give you a clearer picture of what 2011 brought to Prosper’s housing sector.
Key Takeaways and Trends from the 2011 Real Estate Market in Prosper, TX
1. Pricing Range
Home prices ranged significantly, from $98,000 to $1,499,000, which highlighted an increase in luxury home activity compared to the previous year. This showed not only diversity in the Prosper, TX housing market but also an inclination towards higher-end properties.
2. Market Efficiency
The average close price to listing price ratio of 95.58% indicated strong buyer interest, although slightly less efficient than the prior year. Median DOM at 72 days remained in line with a generally healthy market turnover.
3. Unique Outliers
The most expensive property of the year sold for nearly $1.5 million, boasting custom luxury features like expansive square footage, a prime lot, and opulent design elements that positioned it far above the market average.
4. Mortgage Rates Impact
With the average 30-year fixed mortgage rate ticking down to 4.65%, buyers likely found slightly greater affordability. However, increases in gas prices and other economic factors might have tempered some of the positive impact of lower mortgage rates.
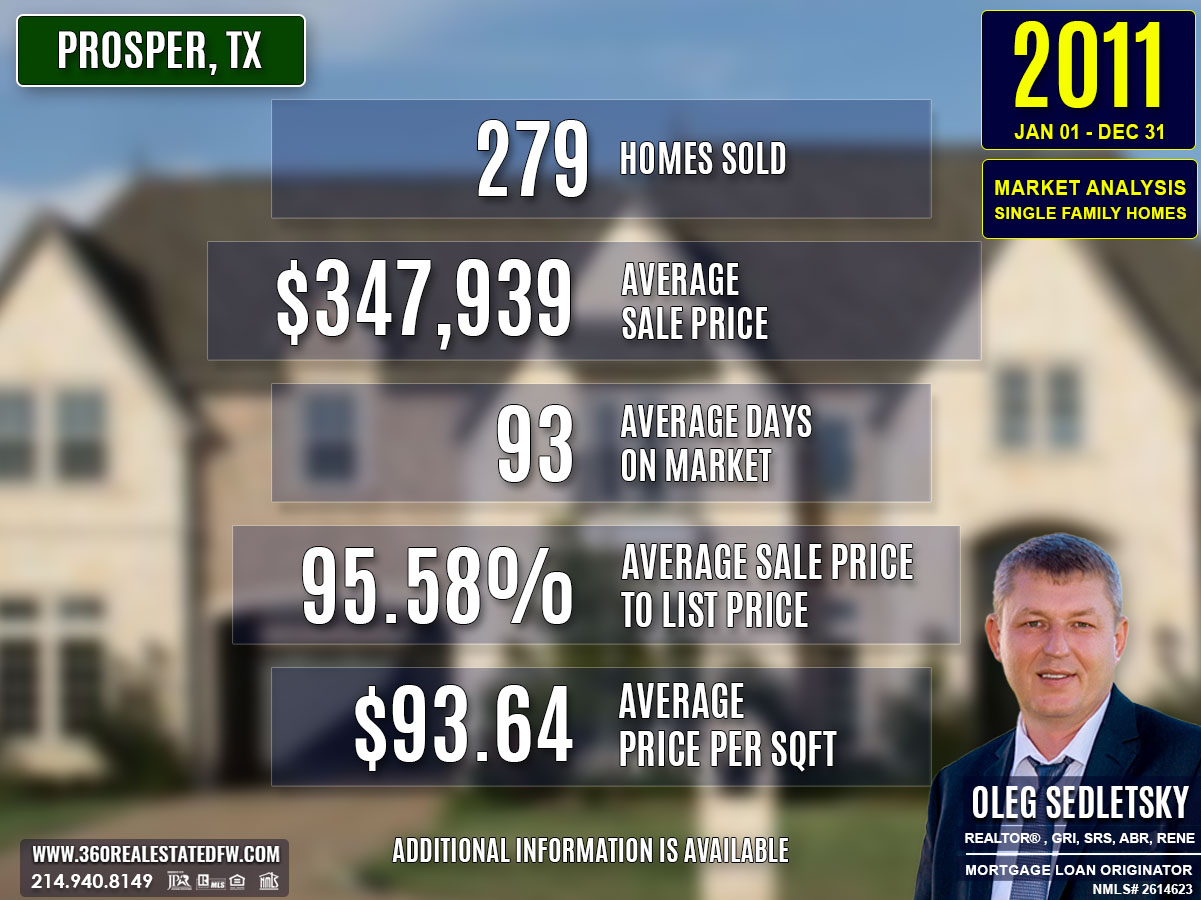
Total Homes Closed
A total of 279 single-family homes closed in Prosper in 2011, marking a 21% rise from 2010’s total of 231 homes. This increase could signal greater buyer confidence and activity in the market.
New Construction Homes: 157 new homes were sold, illustrating a significant 78% increase from the prior year and underscoring the city’s focus on growth and development.
Homes with Pools: 41 properties featured pools, slightly fewer than the previous year but still a notable option for buyers seeking luxury amenities.
Property Pricing Insights
- Minimum Price: $98,000
- Maximum Price: $1,499,000
- Average Price: $347,939
- Median Price: $310,000
The year witnessed diversification in pricing, with both entry-level affordability and record-breaking luxury transactions shaping the market’s trajectory.
Property Size and Features
- Bedrooms & Bathrooms: On average, homes featured 4 bedrooms and 4 bathrooms, maintaining similarities to the previous year.
- Square Footage: Properties ranged from 1,355 sq. ft. to 11,950 sq. ft., with an average of 3,659 sq. ft., slightly higher than in 2010.
- Lot Size: Lot sizes remained similar, with the largest lot at 5.625 acres, indicating a balance between urban and suburban appeal.
Market Dynamics
- Days on Market (DOM): The average DOM was 93 days, a marginal improvement from 97 days in 2010.
- ClsPr/LstPr & ClsPr/OLP Ratios: The average close price to listing price ratio was 95.58%, reflecting a slight dip from 96.82% in 2010. The close price to original listing price stood at 92.10%, indicating sellers were adjusting initial pricing more frequently.
- Average Price Per Square Foot: $93.64, signaling a slight drop in price relative to property size compared to the prior year ($96.47).
Insights into the Most Expensive Prosper, TX Property Sold in 2011
The most expensive property sold in 2011 was an opulent 4-bedroom, 5-bathroom estate spanning 5,972 sq. ft. This luxury home brought sophistication and grandeur to the Prosper market, exemplified through its premium design and ideal location. Key metrics for this standout home include:
- Sold Price: $1,499,000
- Price Per Square Foot: $251.00
- Lot Size: 3.081 acres
- Days on Market (DOM): 143 days
- ClsPr/LstPr & ClsPr/OLP Ratios: Both at 100%, showing excellent pricing alignment.
- Year Built: 2001
The sale of this estate elevated market benchmarks for 2011, showcasing Prosper’s capacity to attract high-end buyers and developers willing to invest in luxury offerings.
Economic context

Average Electricity Costs in Dallas-Fort Worth in 2011
Electricity prices dipped again to $0.11 per kilowatt-hour in 2011, down from $0.12 in 2010. This slight drop continued to help households manage their budgets with more flexibility for discretionary spending or home-related investments. The lower cost of utilities could boost the appeal of larger homes that might otherwise consume more electricity.
Average Price for Regular Gasoline in Texas in 2011
Gas prices rose noticeably to $3.37 per gallon in 2011, up from $2.64 in 2010. The steep increase likely caused homebuyers to favor properties closer to work or transit hubs. homebuyers in suburban or rural areas likely faced greater challenges due to higher commuting costs.
Average 30-Year Fixed Mortgage Rate in 2011
Mortgage rates dropped further to 4.65% in 2011 from 4.86% in the prior year. This ongoing trend of declining rates supported affordability and encouraged activity among homebuyers. First-time buyers were reminded to get pre-approved through local mortgage loan originators to better understand their purchasing power.
Curious about today’s mortgage rates and the home you can comfortably afford?
Submit a no-obligation mortgage application today and get pre-approved to determine your budget and take the first step toward homeownership with confidence.
Overview of Differences Between the 2010 and 2011 Real Estate Markets in Prosper, Texas
Volume of Sales
The number of homes sold rose notably, from 231 in 2010 to 279 in 2011, reflecting increased buyer activity and market demand (a 21% increase).
Pricing
- Average Price decreased slightly, from $354,201 in 2010 to $347,939 in 2011, signaling stable yet slightly softer pricing trends.
- Minimum Price increased marginally, from $97,000 to $98,000, suggesting a small rise in the entry-level sector.
- Maximum Price surged from $875,000 in 2010 to a record $1,499,000 in 2011, driven by luxury market expansion.
Market Efficiency
Close Price to Listing Price Ratio slipped slightly from 96.82% in 2010 to 95.58% in 2011, indicating minor market adjustments.
Days on Market (DOM) improved, dropping from 97 days to 93 days, showing a quicker market turnover.
Property Features
- Average property sizes saw modest growth, with 3,610 sq. ft. in 2010 increasing to 3,659 sq. ft. in 2011.
- Maximum square footage jumped significantly, from 7,262 sq. ft. to 11,950 sq. ft., a reflection of high-end properties entering the market.
- Bedroom and bathroom averages remained consistent, at 4 bedrooms and 4 bathrooms.
- Lot sizes stayed relatively constant, with slight fluctuations in maximum acreage.
The comparison highlights a more dynamic market in 2011, with increased sales, a rise in luxury property activity, and faster market movements while maintaining consistency in property features.
Summary of Real Estate Market Analysis for Prosper, TX in 2011
The 2011 real estate market in Prosper, Texas presented unique opportunities and challenges for both homebuyers and home-sellers.
Homebuyers’ Perspective
For homebuyers, the year offered a significant range of options, from affordable starter homes to high-end luxury properties. The increase in new construction sales delivered an appealing variety for buyers seeking modern homes. With mortgage rates at an average of 4.65%, affordability was within reach for many, though rising gas prices and other economic factors required buyers to carefully assess their budgets. Faster market turnover emphasized the need for quick decision-making to secure desirable properties.
Home-Sellers’ Perspective
For home sellers, the market conditions reinforced the importance of strategic pricing. The slight dip in close price to listing price ratios and the close price to original listing price trends indicated that overpricing often resulted in price adjustments and extended days on market. However, sellers who priced appropriately benefited from efficient sales and strong demand, especially for well-maintained or luxury properties.
The Importance of Statistical Data in Prosper, Texas Real Estate Market
Did you know that Appraisers and Realtors rely on historical statistical data to determine a property’s current value?
The data above is just the beginning. This glimpse into the Prosper, Texas real estate market outlines trends but doesn’t capture the full picture. To truly understand the city’s housing market, you’ll need specific insights like zip code analyses, neighborhood breakdowns, and school-district-focused data. Historical trends and comprehensive analyses arm both homebuyers and home sellers with the tools they need to make decisions confidently.
The insights on this page represent just a small part of the comprehensive real estate services I provide to my clients. Whether you’re a buyer aiming to find your dream home or a seller looking to maximize your property’s value, I provide data-backed strategies tailored to your goals.
Reach out today—I’d love to help you achieve success in Prosper’s vibrant housing market!
Unlock Exceptional Service!
Assistance with all your real estate needs in the Dallas-Fort Worth area is just a click or call away. Reach out at 214-940-8149 or connect through the links below.
Meet Your Trusted Realtor and Mortgage Expert in Prosper, Texas!
Oleg Sedletsky REALTOR® in Prosper, Texas. Call/Text 214.940.8149
Greetings! I’m Oleg Sedletsky, and I’m excited to introduce myself as your go-to full-time licensed Texas REALTOR® and Mortgage Loan Originator.
I proudly represent JPAR® – Real Estate Brokerage as a REALTOR® and Utopia Mortgage LLC as a Mortgage Loan Originator! My designations and certifications reflect my dedication to helping you achieve your real estate goals in Prosper, TX and other locations in the vibrant Dallas-Fort Worth area!
With my expertise, I’ll provide you with in-depth resources, including detailed market reports and historical data, to help you make confident, well-informed decisions. Fluent in English, Ukrainian, and Russian, I’m here to guide you through every step of the process with personalized support and dedication.
It’s All About You and Your Real Estate Goals!
My mission is to serve you! With my knowledge and expertise, I’m here to help you achieve all your real estate goals!
I’m passionate about helping homebuyers and home-sellers navigate the exciting real estate landscape in Prosper, Texas! Whether you’re searching for your dream home, exploring land options, or looking for commercial properties, my Real Estate Services have you covered.
Contact me today for all your real estate needs in Prosper, Texas! Call/text 214-940-8149
A Comprehensive Analysis of Single-Family Residential Housing Market in Prosper, TX: 2010 to Present
Discover the trends, stats, and insights shaping Prosper’s real estate market year by year!
2010-2020
Prosper, TX Real Estate Market Report 2010: Analysis and Trends
Prosper, TX Real Estate Market Report 2011: Analysis and Trends
Prosper, TX Real Estate Market Report 2012: Analysis and Trends
Prosper, TX Real Estate Market Report 2013: Analysis and Trends
Prosper, TX Real Estate Market Report 2014: Analysis and Trends
Prosper, TX Real Estate Market Report 2015: Analysis and Trends
Prosper, TX Real Estate Market Report 2016: Analysis and Trends
Prosper, TX Real Estate Market Report 2017: Analysis and Trends
Prosper, TX Real Estate Market Report 2018: Analysis and Trends
Prosper, TX Real Estate Market Report 2019: Analysis and Trends
Prosper, TX Real Estate Market Report 2020: Analysis and Trends
This market analysis is intended solely for educational purposes. This market analysis is based on data sourced from NTREIS, Inc. This analysis is exclusively focused on single-family homes and does not account for other property types. The total number of real estate transactions within the specified period and location may vary. Data accuracy cannot be guaranteed due to potential input errors made by NTREIS users. This market analysis does not account for all new construction home sales. If you need detailed information about recorded property sales or other public records, please contact the appropriate city or county office.
Prosper, TX Real Estate: A Comprehensive Analysis of the 2010 Single-Family Residential Housing Market
The real estate market of 2010 in Prosper reflected a dynamic period for residential single-family homes. This analysis provides valuable insights into pricing trends, home features, and market performance, allowing us to better grasp the area’s real estate landscape. Whether you’re buying or selling property, understanding these trends is crucial to make informed decisions.
Key Takeaways and Trends from the 2010 Real Estate Market in Prosper, TX
Pricing Range
Prosper’s market offered diverse price points, with properties selling between $97,000 and $875,000. This wide range catered to buyers of all budgets while showcasing a significant demand for higher-end properties.
Market Efficiency
Homes sold at an average of 96.82% of their listing price, demonstrating a balanced market with little room for aggressive negotiations. The median Days on Market (DOM) of just 63 days also indicated relatively quick turnarounds for most sales.
Unique Outliers
The most expensive property sold at $875,000 set itself apart with luxury features like beamed ceilings, four fireplaces, and an outdoor living area with a pool. Such unique properties add flair to the market but remain exceptions rather than the norm.
Mortgage Rates Impact
The average 30-year fixed mortgage rate in 2010 was 4.86%. While modestly competitive, these rates played a role in affordability and homebuyer confidence, influencing purchasing power across all demographics.
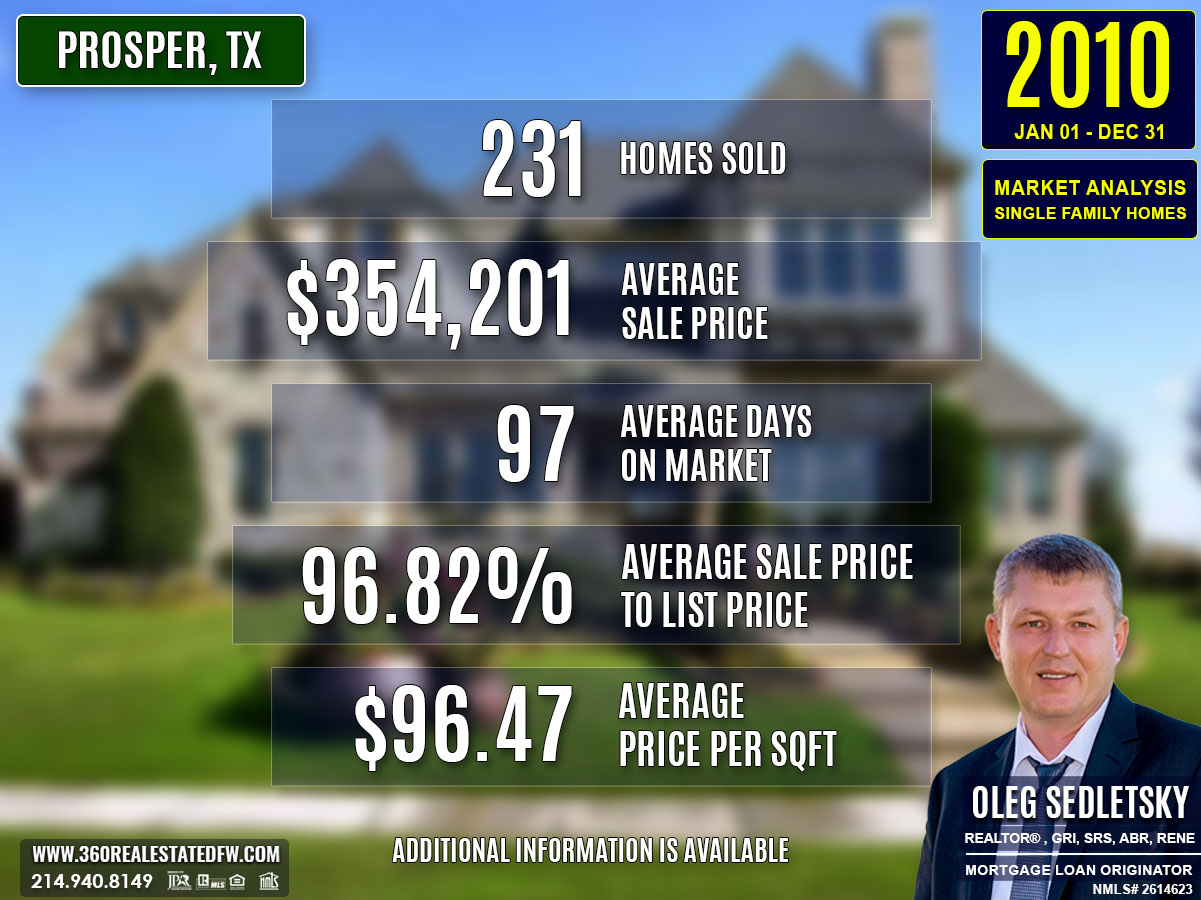
Total Homes Closed
A total of 231 homes were closed in Prosper, TX in 2010. Notably, 88 homes were new constructions, reflecting an active development market. Additionally, 48 homes featured pools, meeting the demand for lifestyle-oriented buyers.
Property Pricing Insights
- Minimum Price: $97,000
- Maximum Price: $875,000
- Average Price: $354,201
- Median Price: $325,000
Pricing data shows that while the majority of properties were in the mid-range, both entry-level and luxury homes found buyers.
Property Size and Features
- Bedrooms & Bathrooms: Most homes averaged 4 bedrooms and 4 bathrooms, making them suitable for families.
- Square Footage: Homes ranged from 876 sq. ft. to 7,262 sq. ft., with an average of 3,610 sq. ft.
- Lot Size: Though lot sizes varied significantly, most of them featured manageable spaces suitable for urban living. The largest lot was nearly 5 acres.
Market Dynamics
- Days on Market (DOM): Homes averaged 97 days from listing to closing, though the median DOM stood lower at 63 days, showing faster sales for prime properties.
- Average ClsPr/LstPr & ClsPr/OLP Ratios: Properties sold at 96.82% of their listing price on average and 93.56% of the original listing price, reflecting realistic pricing strategies by sellers.
- Average Price Per Square Foot: $96.47, a key metric for evaluating property value.
Insights into the Most Expensive Prosper, TX Property Sold in 2010
One standout property in Prosper sold for $875,000. This 5-bedroom, 8-bathroom home boasted a sprawling 5,400 sq. ft. of luxury living space and offered several high-end amenities, including:
- Price Per Square Foot: $162.04
- Lot Size: 0.349 acres
- Days on Market (DOM): 30 days
- ClsPr/LstPr & ClsPr/OLP Ratios: Both 100%, indicating market-aligned pricing.
- Year Built: 2008
Featuring an outdoor courtyard, four fireplaces, and custom craftsmanship, this property set a high benchmark for luxury homes and enhanced market visibility in the upscale category.
The sale of such a premium home demonstrates Prosper’s potential appeal to affluent buyers. While a unique case, it drives interest in similar properties and attracts developers aiming to meet high-end market demand.
Economic context
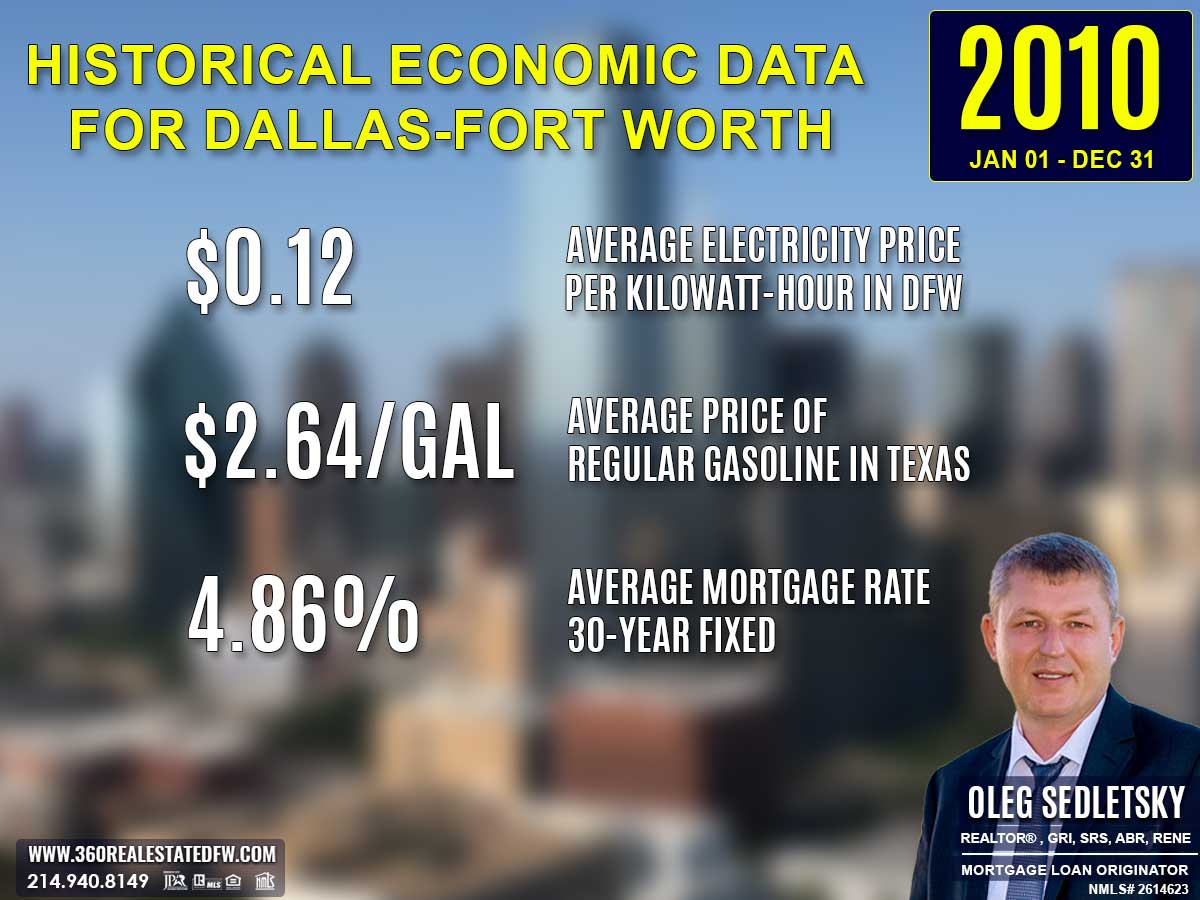
Average Electricity Costs in Dallas-Fort Worth in 2010
Electricity costs decreased further to $0.12 per kilowatt-hour in 2010, down from $0.13 in 2009. The drop allowed households to manage monthly budgets a bit more effectively. For real estate, affordability in utility costs could make energy-conscious homes an easier sell, particularly as homebuyers explored long-term cost savings.
Average Price for Regular Gasoline in Texas in 2010
Gasoline prices rebounded slightly, averaging $2.64 per gallon in 2010, compared to $2.21 in 2009. The rise in fuel costs likely pushed many homebuyers to evaluate commute expenses alongside their home budgets. Urban areas and transit-centered communities may have seen increased interest as reliable transport options became a key factor.
Average 30-Year Fixed Mortgage Rate in 2010
Mortgage rates declined further to 4.86% in 2010, offering favorable conditions for potential homebuyers. This drop made monthly payments more manageable and contributed to a gradual recovery in the housing market. Pre-approvals with local mortgage loan originators were essential for homebuyers to confidently pursue homes in competitive markets.
Curious about today’s mortgage rates and the home you can comfortably afford?
Submit a no-obligation mortgage application today and get pre-approved to determine your budget and take the first step toward homeownership with confidence.
Summary of Real Estate Market Analysis for Prosper, TX in 2010
The 2010 real estate market in Prosper, Texas offered a range of opportunities for both homebuyers and sellers, each facing unique considerations.
Homebuyers’ Perspective
For homebuyers, the market provided a wide variety of options, from affordable homes to luxury properties. The presence of new construction homes (38% of total sales) and homes with pools catered to specific lifestyle desires. With average mortgage rates of 4.86% and homes selling quickly, buyers needed to act decisively while remaining mindful of competitive price points. The data shows that smart decisions were rewarded, especially for those who focused on well-priced properties with added value.
Home Sellers’ Perspective
For home-sellers, the high close price-to-list price ratio (96.82%) reflected a market where realistic pricing strategies often led to successful outcomes. This efficiency, coupled with the median days on market at just 63 days, demonstrated that properly prepared and marketed homes could sell quickly. However, overpricing posed risks, as indicated by the slightly lower close price-to-original listing price ratio (93.56%). Sellers who accurately gauged buyer demand and aligned their expectations with market dynamics reaped the maximum rewards.
The Importance of Statistical Data in Prosper, Texas Real Estate Market
Did you know that Appraisers and Realtors rely on historical statistical data to determine a property’s current value?
The data above is just the beginning. This glimpse into the Prosper, Texas real estate market outlines trends but doesn’t capture the full picture. To truly understand the city’s housing market, you’ll need specific insights like zip code analyses, neighborhood breakdowns, and school-district-focused data. Historical trends and comprehensive analyses arm both homebuyers and home sellers with the tools they need to make decisions confidently.
The insights on this page represent just a small part of the comprehensive real estate services I provide to my clients. Whether you’re a buyer aiming to find your dream home or a seller looking to maximize your property’s value, I provide data-backed strategies tailored to your goals.
Reach out today—I’d love to help you achieve success in Prosper’s vibrant housing market!
Unlock Exceptional Service!
Assistance with all your real estate needs in the Dallas-Fort Worth area is just a click or call away. Reach out at 214-940-8149 or connect through the links below.
Meet Your Trusted Realtor and Mortgage Expert in Prosper, Texas!
Oleg Sedletsky REALTOR® in Prosper, Texas. Call/Text 214.940.8149
Greetings! I’m Oleg Sedletsky, and I’m excited to introduce myself as your go-to full-time licensed Texas REALTOR® and Mortgage Loan Originator.
I proudly represent JPAR® – Real Estate Brokerage as a REALTOR® and Utopia Mortgage LLC as a Mortgage Loan Originator! My designations and certifications reflect my dedication to helping you achieve your real estate goals in Prosper, TX and other locations in the vibrant Dallas-Fort Worth area!
With my expertise, I’ll provide you with in-depth resources, including detailed market reports and historical data, to help you make confident, well-informed decisions. Fluent in English, Ukrainian, and Russian, I’m here to guide you through every step of the process with personalized support and dedication.
It’s All About You and Your Real Estate Goals!
My mission is to serve you! With my knowledge and expertise, I’m here to help you achieve all your real estate goals!
I’m passionate about helping homebuyers and home-sellers navigate the exciting real estate landscape in Prosper, Texas! Whether you’re searching for your dream home, exploring land options, or looking for commercial properties, my Real Estate Services have you covered.
Contact me today for all your real estate needs in Prosper, Texas! Call/text 214-940-8149
A Comprehensive Analysis of Single-Family Residential Housing Market in Prosper, TX: 2010 to Present
Discover the trends, stats, and insights shaping Prosper’s real estate market year by year!
2010-2020
Prosper, TX Real Estate Market Report 2010: Analysis and Trends
Prosper, TX Real Estate Market Report 2011: Analysis and Trends
Prosper, TX Real Estate Market Report 2012: Analysis and Trends
Prosper, TX Real Estate Market Report 2013: Analysis and Trends
Prosper, TX Real Estate Market Report 2014: Analysis and Trends
Prosper, TX Real Estate Market Report 2015: Analysis and Trends
Prosper, TX Real Estate Market Report 2016: Analysis and Trends
Prosper, TX Real Estate Market Report 2017: Analysis and Trends
Prosper, TX Real Estate Market Report 2018: Analysis and Trends
Prosper, TX Real Estate Market Report 2019: Analysis and Trends
Prosper, TX Real Estate Market Report 2020: Analysis and Trends
This market analysis is intended solely for educational purposes. This market analysis is based on data sourced from NTREIS, Inc. This analysis is exclusively focused on single-family homes and does not account for other property types. The total number of real estate transactions within the specified period and location may vary. Data accuracy cannot be guaranteed due to potential input errors made by NTREIS users. This market analysis does not account for all new construction home sales. If you need detailed information about recorded property sales or other public records, please contact the appropriate city or county office.
Princeton, TX Real Estate: A Comprehensive Analysis of the 2024 Single-Family Residential Housing Market
The 2024 real estate market in Princeton, Texas showcased resilience and adaptability. With 1,497 single-family homes sold, new constructions played a notable role, accounting for two-thirds of the total sales. However, the market saw slightly lower average prices compared to previous years. Economic conditions, including a 6.90% average mortgage rate and modest decreases in gas and energy costs, influenced buyer and seller behaviors.
Key Takeaways and Trends from Princeton’s 2024 Real Estate Market
Pricing Range: Prices remained stable, with affordability benefiting from lower maximum prices but consistent averages.
Market Efficiency: A slower market demanded patience, with both DOM and pricing ratios reflecting a more balanced playing field for buyers and sellers.
Unique Outliers: The significant rise in new construction home sales, coupled with a modest uptick in homes featuring pools, reflects evolving buyer preferences and greater inventory availability..
Mortgage Rates Impact: The decrease in mortgage rates to 6.90%, though modest, provided slight relief for buyers, encouraging continued engagement, particularly in new constructions.
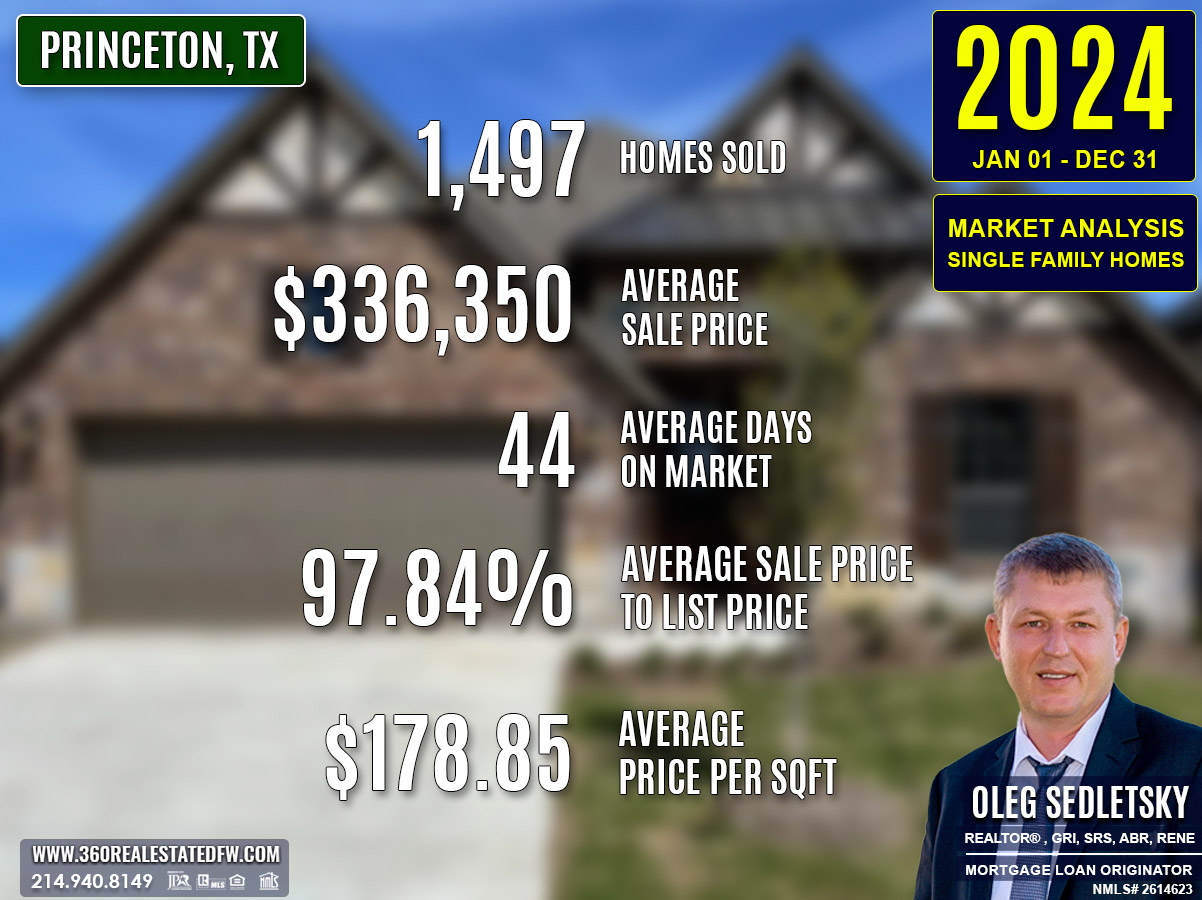
Total Homes Closed
A total of 1,497 homes were closed in 2024, marking a significant increase in activity.
New construction homes accounted for 989 sales, displaying robust growth in this category.
Homes with pools numbered at 12 properties, sustaining interest in leisure-friendly amenities.
Property Pricing Insights
The market saw a narrowing price range compared to 2023, with reduced maximum prices but consistent availability of budget-friendly options for buyers.
- Minimum Price: $95,000
- Maximum Price: $895,000
- Average Price: $336,350
- Median Price: $332,500
Property Size and Features
- Bedrooms ranged from 2 to 6, averaging 4 per home.
- Bathrooms ranged from 1 to 5, with an average of 2 bathrooms.
- Square Footage varied between 768 and 4,006 sqft, with an average of 1,922 sqft.
- Lot Sizes ranged from compact at 0.001 acres to 8.434 acres, averaging 0.181 acres, highlighting a preference for smaller properties.
Market Dynamics
- Days on Market (DOM) has risen to an average of 44 days, with a maximum of 439 days, highlighting a continued slowdown in transaction activity.
- Average ClsPr/LstPr Ratio was 97.84%, reflecting steady buyer-seller negotiations compared to 2023.
- Average ClsPr/OLP Ratio held firm at 96.15%, reinforcing stable listing strategies.
- Average Price Per SqFt was $178.85, a slight decrease from 2023, indicating affordability gains.
Insights into the Most Expensive Princeton, TX Property Sold in 2024
The most expensive home sold in 2024 was a 4-bed, 2-bath property built in 2007, situated on a generous 4.625-acre lot.
Key Highlights:
- Price: $895,000
- Square Footage: 2,145 sqft
- Price Per SqFt: $417.25
- Lot Size: 4.625 acres
- Days on Market (DOM): 7
- ClsPr/LstPr and ClsPr/OLP Ratios: 96.24%
- Year Built: 2007
This property stood out for its spacious lot and luxury finish, making it a unique transaction in a year with tempered high-end activity. It underscored the demand for well-maintained, expansive homes offering value for the price.
Economic context
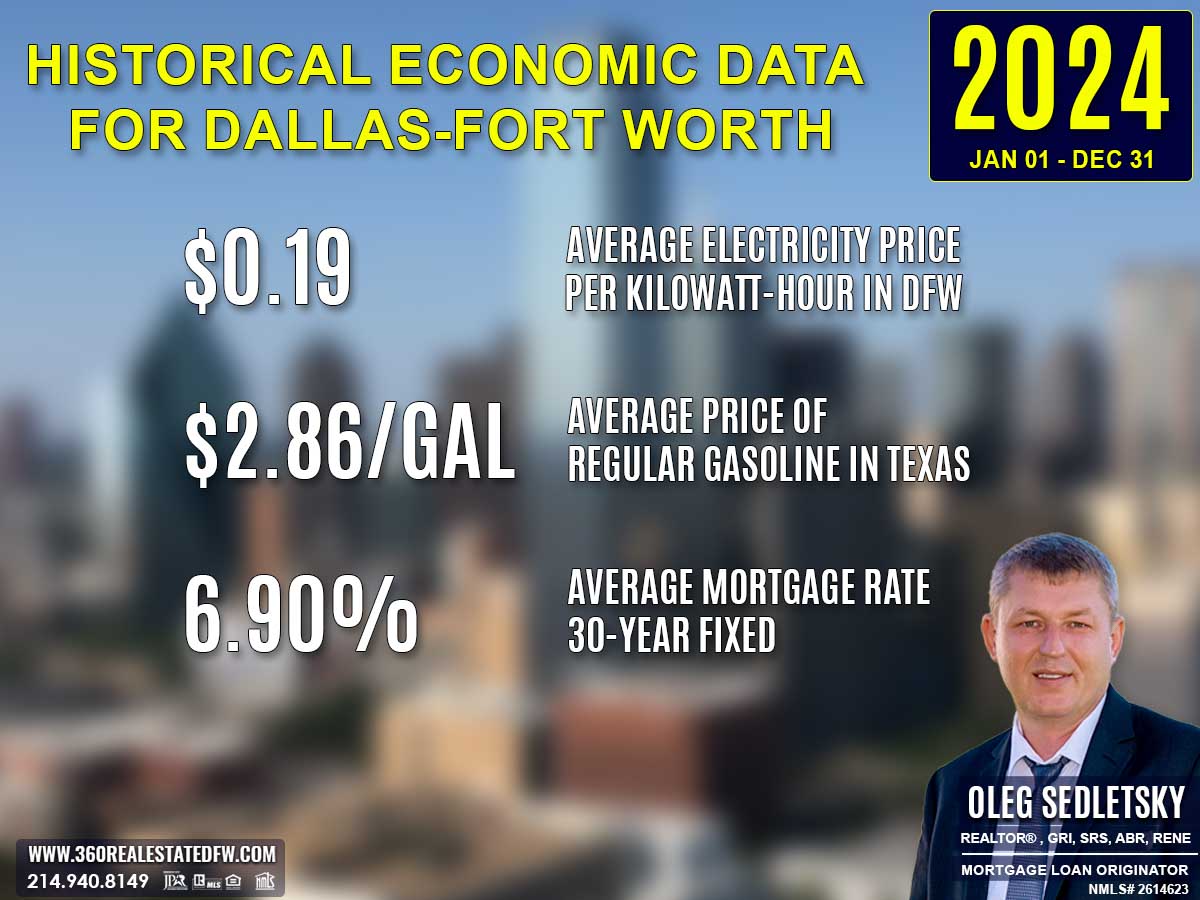
Average Electricity Costs in Dallas-Fort Worth in 2024
Electricity prices rose again to $0.19 per kilowatt-hour in 2024, up from $0.17 in 2023. The steady rise in energy costs underscored the growing value of homes equipped with renewable energy solutions. Energy-conscious designs likely remained a key factor in real estate market trends.
Average Price for Regular Gasoline in Texas in 2024
Gas prices settled slightly lower at $2.86 per gallon in 2024, down from $3.06 in 2023. This decrease, while modest, might have encouraged more exploratory behavior from buyers considering homes in more distant locations. The reduced cost of transportation relieved some financial stress for commuting.
Average 30-Year Fixed Mortgage Rate in 2024
The average 30-year fixed mortgage rate fell marginally to 6.90% in 2024, down from 7.00% in 2023. While still elevated, this slight decline could provide homebuyers with additional opportunities to re-enter the market. Pre-approvals with a local mortgage loan originator remained critical in helping buyers react quickly to evolving financial conditions and maintain a competitive edge.
Curious about today’s mortgage rates and the home you can comfortably afford?
Submit a no-obligation mortgage application today and get pre-approved to determine your budget and take the first step toward homeownership with confidence.
Overview of Differences Between the 2023 and 2024 Real Estate Markets in Princeton, Texas
Volume of Sales
The real estate market in Bobak experienced a significant rise in activity with 1,497 homes sold in 2024, compared to 961 homes sold in 2023—a 56% increase.
Pricing
- Minimum Price fell from $115,000 in 2023 to $95,000 in 2024, indicating more budget-friendly options.
- Maximum Price dropped sharply from $1,550,000 to $895,000.
- Average Price saw a slight dip, moving from $346,690 in 2023 to $336,350 in 2024.
- Median Price was marginally lower, from $334,690 to $332,500.
Market Efficiency
Days on Market (DOM) increased from 35 days to 44 days, reflecting slower transaction speeds.
The Average ClsPr/LstPr Ratio remained relatively stable, dropping slightly from 98.18% in 2023 to 97.84%.
The Average ClsPr/OLP Ratio also held steady, moving from 96.37% in 2023 to 96.15% in 2024.
Property Features
The average square footage increased slightly from 1,901 sqft to 1,922 sqft, while lot sizes shrank modestly.
New construction homes surged, rising from 565 in 2023 to 989 in 2024, signaling strong growth in this category.
Homes with pools increased marginally, from 10 in 2023 to 12 in 2024.
Economic Context
The average 30-year fixed mortgage rate decreased modestly from 7.00% to 6.90%, offering slight relief to buyers. Reductions in energy and gas costs also contributed to a more manageable economic environment for buyers and sellers alike.
Overall, 2024 saw an increase in activity and inventory, greater affordability, and a focus on new constructions, though the slower market dynamics required more patience from participants.
Summary of Real Estate Market Analysis for Princeton, TX in 2024
The 2024 real estate market in Princeton, Texas presented a dynamic yet challenging environment, with significant shifts impacting both homebuyers and home-sellers.
Homebuyers’ Perspective
For homebuyers, the market leaned heavily in their favor. A disproportionate number of new construction homes—nearly two-thirds of total home sales—created plenty of options for those seeking modern, move-in-ready properties. Builders further sweetened the deal with extensive incentives, ranging from flexible financing to added upgrades, making new construction homes especially attractive. These factors, paired with marginally lower preowned home prices, opened opportunities for buyers to negotiate and achieve greater value. This abundance of inventory, combined with softer price points, pointed to a market where patience and research could lead to excellent deals.
Home-Sellers’ Perspective
Conversely, home-sellers, particularly those with preowned homes, faced mounting challenges. The overwhelming supply of affordable new construction homes—loaded with builder incentives—created stiff competition that preowned homes struggled to match. This dynamic exerted downward pressure on preowned home prices, making it crucial for sellers to adapt. Strategic pricing became essential, as overpricing reduced the likelihood of attracting buyers in a market that offered newer alternatives. Additionally, investing in home improvements, staging, and enhanced curb appeal grew more important for sellers aiming to compete effectively.
Overall, the 2024 market was shaped by significant disruptions brought on by the rise of new constructions and evolving buyer preferences. Homebuyers celebrated a wealth of attractive options, while home-sellers were encouraged to adapt their strategies to successfully capture interest in a highly competitive market.
The Importance of Statistical Data in Princeton, Texas Real Estate Market
Did you know that appraisers and Realtors rely on historical statistical data to determine a property’s current value?
Analyzing historical market data is essential for making informed decisions in today’s real estate market. Examining past trends provides valuable insights that facilitate accurate pricing, more strategic negotiations, and a comprehensive understanding of market dynamics. By understanding market dynamics, both homebuyers and home-sellers can leverage the conditions to achieve their goals.
Unlock Exceptional Service!
Assistance with all your real estate needs in the Dallas-Fort Worth area is just a click or call away. Reach out at 214-940-8149 or connect through the links below.

Greetings! I’m Oleg Sedletsky, and I’m excited to introduce myself as your go-to full-time licensed Texas REALTOR® and Mortgage Loan Originator.
I proudly represent JPAR® – Real Estate Brokerage as a REALTOR® and Utopia Mortgage LLC as a Mortgage Loan Originator! My designations and certifications reflect my dedication to helping you achieve your real estate goals in Princeton, TX and other locations in the vibrant Dallas-Fort Worth area!
My commitment to ongoing professional development means I’m always enhancing my skills to serve you better. You can count on me as your trusted expert throughout your real estate journey. Plus, I’m fluent in English, Ukrainian, and Russian and ready to assist you every step of the way!
It’s All About You and Your Real Estate Goals!
My mission is to serve you! With my knowledge and expertise, I’m here to help you achieve all your real estate goals!
I’m passionate about helping buyers and sellers navigate the exciting real estate landscape in Princeton, Texas! Whether you’re searching for your dream home, exploring land options, or looking for commercial properties, my Real Estate Services have you covered.
Contact me today for all your real estate needs in Princeton, Texas! Call/text 214-940-8149
A Comprehensive Analysis of Single-Family Residential Housing Market in Princeton, TX: 2010 to Present
Discover the trends, stats, and insights shaping Princeton’s real estate market year by year!
2010-2020
Princeton, TX Real Estate Market Report 2010: Analysis and Trends
Princeton, TX Real Estate Market Report 2011: Analysis and Trends
Princeton, TX Real Estate Market Report 2012: Analysis and Trends
Princeton, TX Real Estate Market Report 2013: Analysis and Trends
Princeton, TX Real Estate Market Report 2014: Analysis and Trends
Princeton, TX Real Estate Market Report 2015: Analysis and Trends
Princeton, TX Real Estate Market Report 2016: Analysis and Trends
Princeton, TX Real Estate Market Report 2017: Analysis and Trends
Princeton, TX Real Estate Market Report 2018: Analysis and Trends
Princeton, TX Real Estate Market Report 2019: Analysis and Trends
Princeton, TX Real Estate Market Report 2020: Analysis and Trends
This market analysis is intended solely for educational purposes. This market analysis is based on data sourced from NTREIS, Inc. This analysis is exclusively focused on single-family homes and does not account for other property types. The total number of real estate transactions within the specified period and location may vary. Data accuracy cannot be guaranteed due to potential input errors made by NTREIS users. This market analysis does not account for all new construction home sales. If you need detailed information about recorded property sales or other public records, please contact the appropriate city or county office.
Princeton, TX Real Estate: A Comprehensive Analysis of the 2023 Single-Family Residential Housing Market
In 2023, the Princeton, Texas real estate market was defined by climbing mortgage rates, with the average rate for a 30-year fixed mortgage reaching 7% and elevated utility costs ($0.17 per kilowatt-hour electricity). These economic pressures tested affordability but spurred demand for energy-efficient and modern homes, particularly new construction properties. Despite financial hurdles, the market remained vibrant, with 961 homes sold and a broad price range catering to both entry-level and luxury buyers.
Key Takeaways and Trends from Princeton’s 2023 Real Estate Market
Pricing Range: The market showcased a wide range, from $115,000 for entry-level homes to luxurious properties priced over $1.5 million.
Market Efficiency: The 35-day average DOM and 98.18% close-to-list price ratio indicated a moderately steady market where buyers had some negotiating power, yet properties moved relatively quickly.
Unique Outliers: Notable outliers included ultra-affordable smaller homes and extravagant estates with pools, suggesting demand across all buyer segments.
Mortgage Rates Impact: The 7% average 30-year fixed mortgage rate pushed affordability concerns for entry-level buyers, while incentivizing cash buyers and those seeking efficient, newly-built homes.
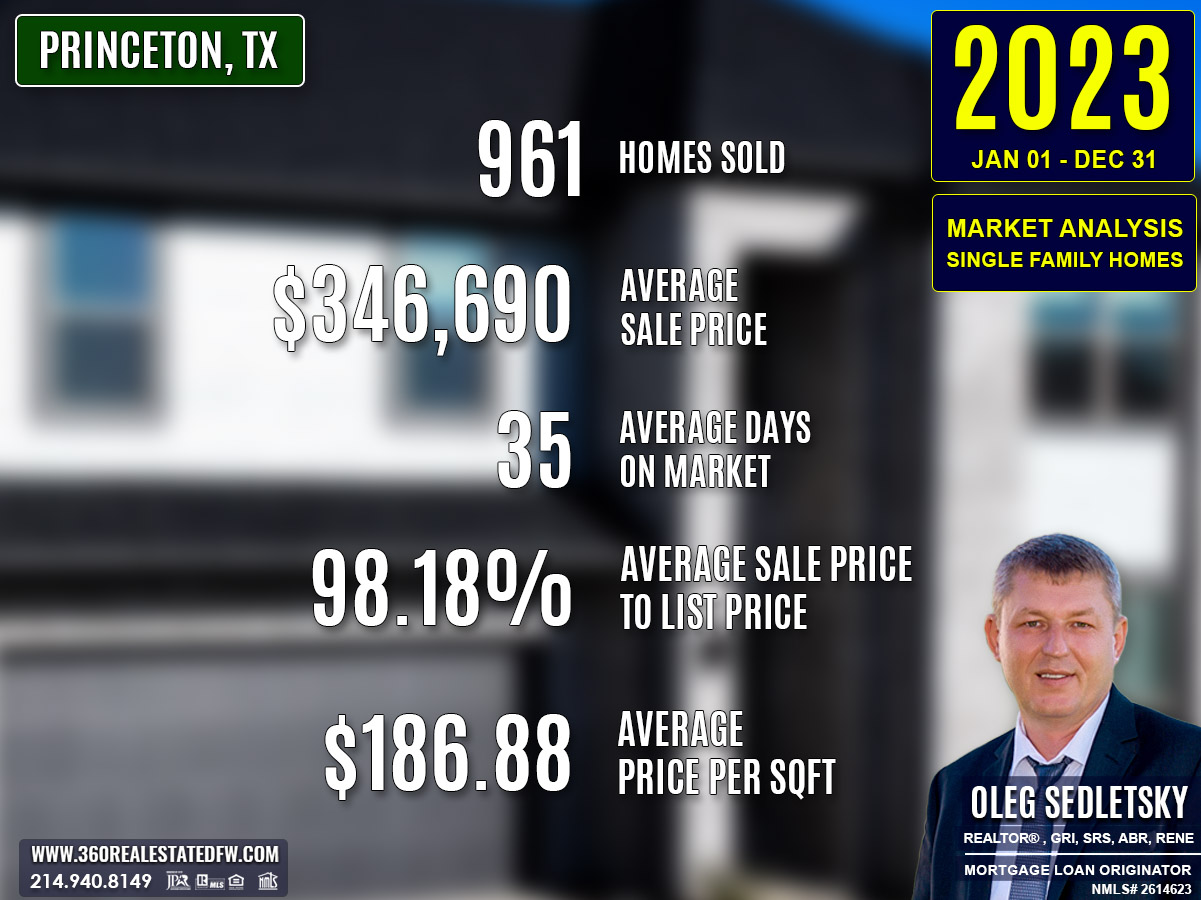
Total Homes Closed
A total of 961 homes were sold in 2023. Of these, 565 were new construction homes, signaling strong demand for modern, energy-efficient builds. Additionally, 10 homes featured pools, demonstrating consistent interest in lifestyle-enhancing properties.
Property Pricing Insights
- Minimum Price: $115,000
- Maximum Price: $1,550,000
- Average Price: $346,690
- Median Price: $334,690
While most homes sold within the mid-range, the presence of high-end properties pushed the upper limits of the market.
Property Size and Features
- Bedrooms: Ranged from 1 to 6; average was 4 bedrooms.
- Bathrooms: Ranged from 1 to 7; average was 2 bathrooms.
- Square Footage: Ranged from 480 sqft to 6,180 sqft; average was 1,901 sqft.
- Lot Size: Ranged from 0.001 acres to 14.34 acres; average lot size was 0.237 acres.
The market offered a wide variety of options, catering to small families and buyers seeking expansive estates.
Market Dynamics
- Days on Market: Ranged from 0 to 311 days, with an average of 35 days and a median of 19 days, indicating a moderately-paced market.
- ClsPr/LstPr Ratio: Averaged 98.18%, suggesting homes commonly sold slightly below the asking price.
- ClsPr/OLP Ratio: Averaged 96.37%, showing some price reductions during the sales process.
- Price per Square Foot: Averaged $186.88, reflecting the market’s overall value relative to property size.
The balance between buyer urgency and seller pricing strategies defined the market’s dynamics.
Insights into the Most Expensive Princeton, TX Property Sold in 2023
A remarkable 5-bedroom, 7-bathroom home topped the 2023 market with a sale price of $1,550,000. Built in 2007, this luxury property offered 6,180 square feet of living space on a 1.370-acre lot, complete with a pool. At a price of $250.81 per square foot, the home represented high-end living, featuring upscale finishes and ample space for entertainment. While it lingered for 69 days on market, it sold with a ClsPr/LstPr (close price to listing price) ratio of 91.18% and a ClsPr/OLP (close price to original listing price) ratio of 79.49%, indicating price adjustments during the listing process.
Key Highlights:
- Price: $1,550,000
- Beds/Baths: 5 bedrooms, 7 bathrooms
- Square Footage: 6,180 sqft
- Price/SqFt: $250.81
- Lot Size: 1.370 acres
- DOM: 69 days
- ClsPr/LstPr Ratio: 91.18%
- ClsPr/OLP Ratio: 79.49%
- Year Built: 2007
This property demonstrated the resilience of the luxury segment in Princeton, TX, even amidst economic pressures.
Economic context

Average Electricity Costs in Dallas-Fort Worth in 2023
Electricity prices dropped slightly to $0.17 per kilowatt-hour in 2023, compared to $0.18 in 2022. While this small decrease provided some relief, energy-efficient homes remained a top priority for homebuyers. Such features offered long-term cost savings that appealed to budget-conscious households.
Average Price for Regular Gasoline in Texas in 2023
Gas prices fell to $3.06 per gallon in 2023, down from $3.47 the previous year. This decline could have renewed interest in suburban properties by making commutes more affordable. homebuyers may have placed higher importance on access to amenities and infrastructure to balance the potential for rising future gas prices.
Average 30-Year Fixed Mortgage Rate in 2023
Mortgage rates increased to 7.00% in 2023, up sharply from 5.53% the prior year. This jump added significant pressure to affordability and homebuyers’ decision-making. Pre-approvals through local mortgage loan originators became essential in helping buyers secure competitive rates and stay within budget during challenging conditions.
Curious about today’s mortgage rates and the home you can comfortably afford?
Submit a no-obligation mortgage application today and get pre-approved to determine your budget and take the first step toward homeownership with confidence.
Overview of Differences Between the 2022 and 2023 Real Estate Markets in Princeton, Texas
Volume of Sales
Sales volume increased significantly from 690 homes in 2022 to 961 homes in 2023, marking a 39% growth.
Pricing
- Minimum Price decreased from $135,000 (2022) to $115,000 (2023), signaling more budget-friendly options entering the market.
- Maximum Price slightly dropped from $1,600,000 (2022) to $1,550,000 (2023), indicating stabilization in the luxury market.
- Average Price fell from $369,296 to $346,690, reflecting eased buyer spending amidst economic pressures.
- Median Price also dropped from $351,996 to $334,690, showing a broader downward adjustment across the market.
Market Efficiency
- Days on Market (DOM) rose from 21 days (2022) to 35 days (2023), pointing to slower transaction speeds.
- ClsPr/LstPr Ratio decreased from 101.63% (2022) to 98.18% (2023), signifying reduced competitiveness in offers.
- ClsPr/OLP Ratio dropped from 100.40% to 96.37%, indicating increased room for buyer negotiation.
Property Features
- Average Square Footage: Slight increase from 1,869 sqft (2022) to 1,901 sqft (2023) reflects a preference for larger homes.
- Lot Size: Averaged at 0.237 acres (2023) compared to 0.422 acres (2022), highlighting a shift toward more compact lots.
- Homes with Pools: Declined from 17 (2022) to 10 (2023), suggesting less focus on leisure amenities.
- New Construction Homes: Surged from 249 (2022) to 565 (2023), showcasing a booming construction market catering to demand.
Economic Context
The average 30-year fixed mortgage rate spiked from 5.53% (2022) to 7.00% (2023), significantly impacting affordability for buyers.
Decreases in electricity ($0.18 to $0.17 per kilowatt hour) and gas prices ($3.47 to $3.06) slightly eased utility costs, but the steep mortgage rate increase likely outweighed these savings.
These shifts illustrate a transitioning market in 2023, with increased housing supply softening prices amidst higher borrowing costs. The rise in new constructions pointed to efforts to meet buyer demand despite the economic challenges.
Summary of Real Estate Market Analysis for Princeton, TX in 2023
The 2023 real estate market in Princeton, TX reflected significant shifts, offering distinct opportunities and challenges for both homebuyers and home-sellers.
Homebuyers’ Perspective
For homebuyers, the year presented a mix of hurdles and prospects. The sharp rise in mortgage rates to 7.00% significantly impacted affordability, making cautious financial planning essential. However, a notable increase in new construction homes—565 in total—provided a range of modern options, often appealing with enhanced features and the allure of energy-efficiency. Additionally, a slight decrease in average home prices, with the median dropping to $334,690, offered some relief, especially to buyers navigating tighter budgets. The longer Days on Market (DOM), averaging 35 days, created room for negotiation, allowing buyers to approach purchases with more patience and confidence. This environment rewarded strategic offers and value-conscious decisions, especially in a market becoming less competitive.
Home-Sellers’ Perspective
For home-sellers, 2023 posed new challenges requiring a more thoughtful approach. Properties averaged longer DOM compared to the previous year, stretching from 21 to 35 days, an indication that buyers were more deliberate and thorough in their decision-making. Furthermore, the close-to-list price ratio declined to 98.18%, reflecting a slight softening in buyer enthusiasm compared to 2022’s high of 101.63%. Sellers had to lean on competitive pricing strategies, professional staging, and marketing to stand out in a calmer market. Yet, opportunities abounded for those selling newer or larger properties, as demand for spacious homes and contemporary features remained strong. Sellers who understood these trends and adapted quickly were better positioned to capture buyer interest and achieve favorable outcomes.
Both homebuyers and home-sellers navigated a transitioning market in 2023, balancing economic headwinds and emerging opportunities. The year demanded decisiveness but also clarity, making adaptability the key to success for all parties.
The Importance of Statistical Data in Princeton, Texas Real Estate Market
Did you know that appraisers and Realtors rely on historical statistical data to determine a property’s current value?
Analyzing historical market data is essential for making informed decisions in today’s real estate market. Examining past trends provides valuable insights that facilitate accurate pricing, more strategic negotiations, and a comprehensive understanding of market dynamics. By understanding market dynamics, both homebuyers and home-sellers can leverage the conditions to achieve their goals.
Unlock Exceptional Service!
Assistance with all your real estate needs in the Dallas-Fort Worth area is just a click or call away. Reach out at 214-940-8149 or connect through the links below.
Greetings! I’m Oleg Sedletsky, and I’m excited to introduce myself as your go-to full-time licensed Texas REALTOR® and Mortgage Loan Originator.
I proudly represent JPAR® – Real Estate Brokerage as a REALTOR® and Utopia Mortgage LLC as a Mortgage Loan Originator! My designations and certifications reflect my dedication to helping you achieve your real estate goals in Princeton, TX and other locations in the vibrant Dallas-Fort Worth area!
My commitment to ongoing professional development means I’m always enhancing my skills to serve you better. You can count on me as your trusted expert throughout your real estate journey. Plus, I’m fluent in English, Ukrainian, and Russian and ready to assist you every step of the way!
It’s All About You and Your Real Estate Goals!
My mission is to serve you! With my knowledge and expertise, I’m here to help you achieve all your real estate goals!
I’m passionate about helping buyers and sellers navigate the exciting real estate landscape in Princeton, Texas! Whether you’re searching for your dream home, exploring land options, or looking for commercial properties, my Real Estate Services have you covered.
Contact me today for all your real estate needs in Princeton, Texas! Call/text 214-940-8149
A Comprehensive Analysis of Single-Family Residential Housing Market in Princeton, TX: 2010 to Present
Discover the trends, stats, and insights shaping Princeton’s real estate market year by year!
2010-2020
Princeton, TX Real Estate Market Report 2010: Analysis and Trends
Princeton, TX Real Estate Market Report 2011: Analysis and Trends
Princeton, TX Real Estate Market Report 2012: Analysis and Trends
Princeton, TX Real Estate Market Report 2013: Analysis and Trends
Princeton, TX Real Estate Market Report 2014: Analysis and Trends
Princeton, TX Real Estate Market Report 2015: Analysis and Trends
Princeton, TX Real Estate Market Report 2016: Analysis and Trends
Princeton, TX Real Estate Market Report 2017: Analysis and Trends
Princeton, TX Real Estate Market Report 2018: Analysis and Trends
Princeton, TX Real Estate Market Report 2019: Analysis and Trends
Princeton, TX Real Estate Market Report 2020: Analysis and Trends
This market analysis is intended solely for educational purposes. This market analysis is based on data sourced from NTREIS, Inc. This analysis is exclusively focused on single-family homes and does not account for other property types. The total number of real estate transactions within the specified period and location may vary. Data accuracy cannot be guaranteed due to potential input errors made by NTREIS users. This market analysis does not account for all new construction home sales. If you need detailed information about recorded property sales or other public records, please contact the appropriate city or county office.