

Lucas, TX Real Estate: A Comprehensive Analysis of the 2017 Single-Family Residential Housing Market
The 2017 real estate market in Lucas Texas, experienced significant growth and success, with exceptional performance in both new construction and high-value transactions. A mix of classic homes, modern builds, and leisure-oriented properties continued to appeal to various buyer preferences, maintaining the momentum from previous years. While mortgage rates edged higher at 4.14%, the market remained vibrant, showcasing adaptability and buyer confidence.
Key Takeaways and Trends from Lucas’s 2017 Real Estate Market
1. Pricing Range
- The minimum price rose to $195,000, showcasing greater value at entry-level options.
- Luxury properties flourished, with the maximum price reaching $1,361,472, reflecting renewed interest in upscale housing.
- The average price per square foot increased moderately to $167.08, signaling steady appreciation.
2. Market Efficiency
- The median DOM dropped to 44 days, highlighting an efficient mid-tier market.
- However, the average DOM slightly increased, indicating longer timelines for specific property types or higher-priced listings.
3. Unique Outliers
- Luxury homes excelled, with Rockland Farms emerging as a desirable neighborhood for custom builds.
- 34 new construction homes bolstered interest in modern, energy-efficient properties.
- The addition of 61 pool properties confirmed the growing focus on leisure-enhancing features.
4. Mortgage Rates Impact
The average 30-year fixed mortgage rate increased to 4.14%, potentially influencing buyer decisions, especially in higher-priced categories.
Despite the rise, Lucas’s market remained resilient, underscored by the volume of transactions and strong seller returns.
Total Homes Closed
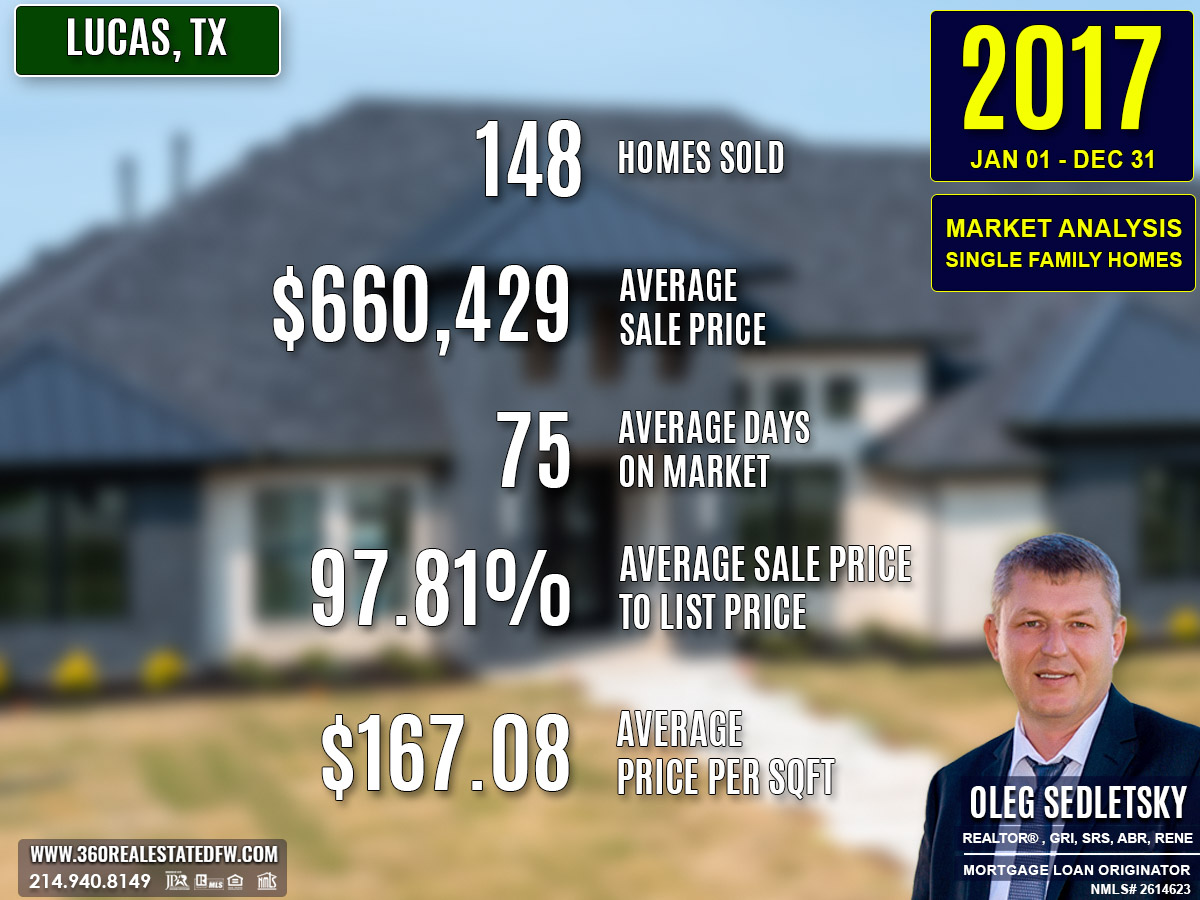
A total of 148 homes closed in Lucas, TX during 2017, marking a clear increase in market activity. Buyers displayed a strong interest in new construction homes, with 34 sales, a notable jump from prior years. Additionally, 61 homes with pools cemented the appeal of leisure-enhancing features, meeting the needs of lifestyle-conscious buyers.
Property Pricing Insights
The year revealed a robust pricing spectrum, with highlights including:
- Minimum Price: $195,000—Indicating reduced entry-level inventory but higher value on the lower end.
- Maximum Price: $1,361,472—Featuring notable luxury sales.
- Average Price: $660,429—Slightly up from 2016, illustrating continued demand and appreciation.
- Median Price: $649,450—Confirming balanced growth across all market tiers.
- Average Price per Sq. Ft.: $167.08—A moderate increase reflecting rising property valuations.
Property Size and Features
Homes catered to varied buyer demands, from compact urban properties to expansive luxury estates:
- Bedrooms: Ranged from 2 to 8, with an average of 4 bedrooms, satisfying family-focused buyers.
- Bathrooms: Offered 2 to 10 bathrooms, catering to upscale housing aspirations, with an average of 4 bathrooms overall.
- Square Footage: Properties spanned 876 sq. ft. to 7,286 sq. ft., averaging 4,024 sq. ft., demonstrating preference for spacious living.
- Lot Sizes: Ranged from 0.0 to 8.189 acres, with an average of 1.743 acres, blending suburban and estate-style options.
Market Dynamics
Market efficiency and competitiveness were reflected in core metrics:
- Days on Market (DOM): Properties averaged 75 days, though median DOM was just 44 days, suggesting brisk activity for mid-tier homes.
- ClsPr/LstPr Ratio: Sellers achieved 97.81% of listing prices, showcasing robust buyer interest.
- ClsPr/OLP Ratio: At 95.52%, there were some adjustments to original pricing, likely reflecting evolving market conditions throughout the year.
- Average Price per Sq. Ft.: $167.08, continuing a steady rise in property valuations.
Insights into the Most Expensive Lucas, TX Property Sold in 2017
The most expensive property sold in Lucas, Texas during 2017 was an impressive new construction home, built by “Homes by J Anthony” in the prestigious Rockland Farms neighborhood. This luxurious custom home was meticulously designed to embody elegance and modern comfort, achieving a sale price of $1,361,472. Below are the key details of this standout property:
- Price: $1,361,472
- Beds/Baths: 5 bedrooms, 6 bathrooms (5 full, 1 half)
- Square Footage: 6,847 sq. ft.
- Price per Square Foot: $198.84
- Lot Size: 2.000 acres
- ClsPr/LstPr Ratio: 100%
- ClsPr/OLP Ratio: 100%
- Year Built: 2017
This sale highlighted the market’s capability to attract high-end buyers, reflecting a strong appetite for luxury, craftsmanship, and modern amenities in one of Lucas’s most desirable neighborhoods.
Economic context
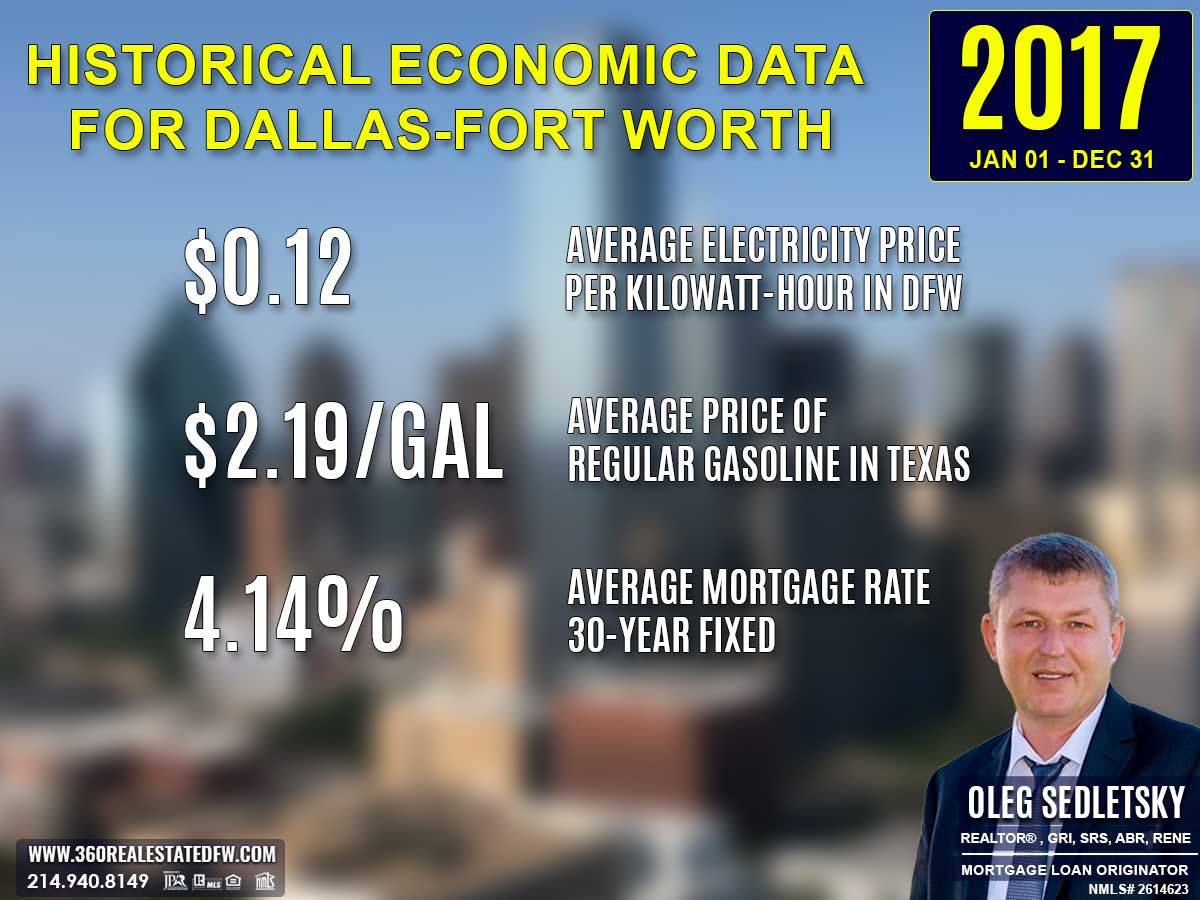
Average Electricity Costs in Dallas-Fort Worth in 2017
Electricity prices rose to $0.12 per kilowatt-hour in 2017, after a year at $0.11. This small uptick likely reignited interest in smaller homes or energy-efficient features. homebuyers remained cautious about properties with older energy systems, viewing them as less desirable long-term investments.
Average Price for Regular Gasoline in Texas in 2017
Gas prices increased to $2.19 per gallon in 2017, up from $1.91 in 2016. While still relatively affordable, the rise may have led homebuyers to reconsider the financial trade-offs of suburban living. Proximity to public transportation hubs became a more significant factor during housing searches.
Average 30-Year Fixed Mortgage Rate in 2017
Mortgage rates rose to 4.14% in 2017, up from 3.79% the year prior. The return of higher rates reminded homebuyers of the importance of locking in favorable financing terms early. Pre-approval through local mortgage loan originators remained vital to navigating the shifting landscape effectively and with confidence.
Curious about today’s mortgage rates and the home you can comfortably afford?
Submit a no-obligation mortgage application today and get pre-approved to determine your budget and take the first step toward homeownership with confidence.
Overview of Differences Between the 2016 and 2017 Real Estate Markets in Lucas, Texas
Total Homes Sold
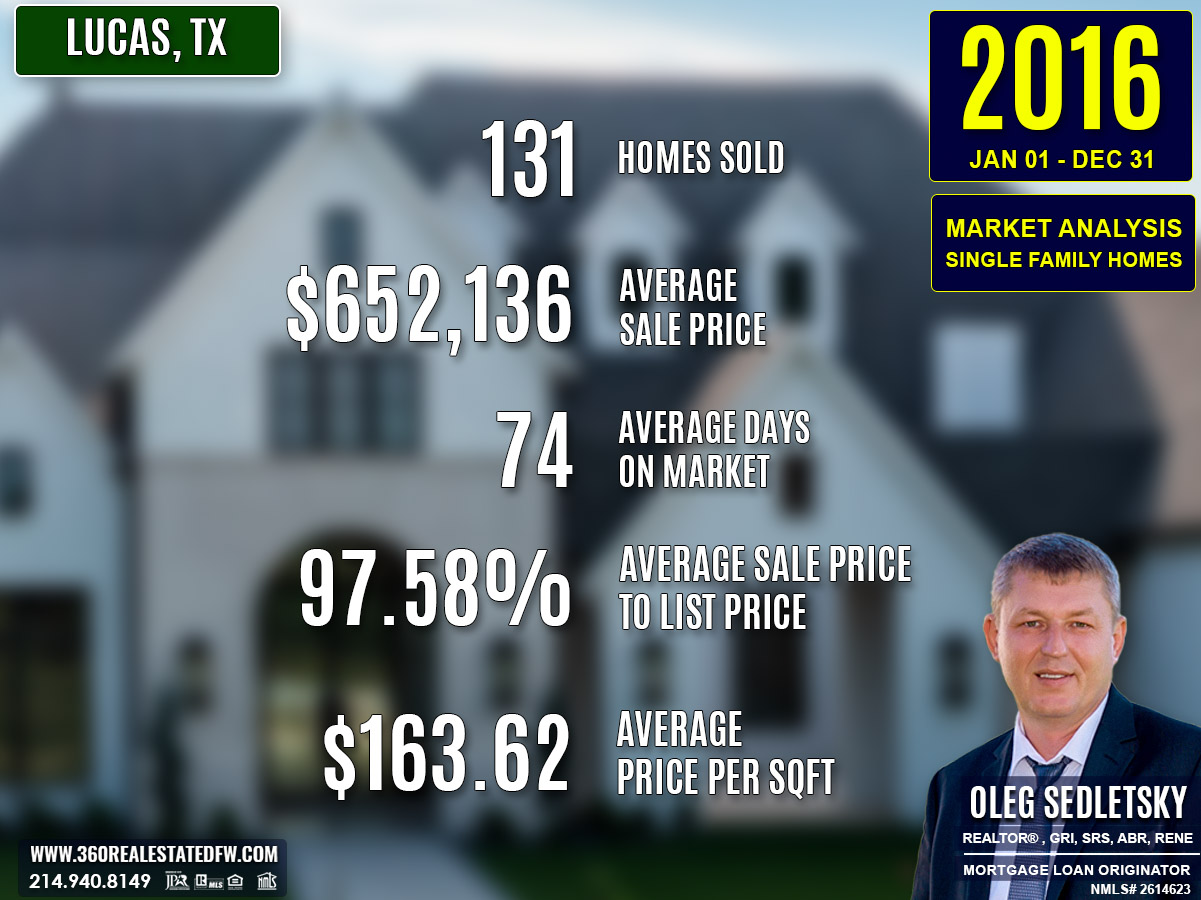
148 homes closed in 2017, up from 131 in 2016, demonstrating a clear rise in transaction volume and market activity.
Pricing Insights
- The minimum price increased to $195,000 in 2017 from $150,000 in 2016, pointing to fewer lower-end properties but higher entry-level value.
- The maximum price decreased to $1,361,472, compared to $1,850,000 the year prior, signaling a smaller pool of ultra-luxury transactions.
- The average price slightly rose to $660,429, from $652,136 in 2016, reflecting steady appreciation.
- The median price also increased to $649,450, up from $600,000 in 2016, showing stronger mid-market performance.
- The average price per square foot climbed to $167.08, from $163.62 in 2016, continuing a trend of rising property values.
Property Features
- Bedroom counts remained consistent, ranging from 2 to 8 bedrooms, meeting diverse buyer needs.
- Bathroom offerings expanded with a maximum of 10 in 2017, compared to 8 in 2016, catering to luxury homebuyers.
- Square footage remained similar, though 2017’s largest home was 7,286 sq. ft., compared to 7,508 sq. ft. in 2016, with the average staying at approximately 4,024 sq. ft.
- Lot sizes for 2017 peaked at 8.189 acres, down from 25.000 acres in the prior year, highlighting a shift toward smaller but more accessible properties.
Market Dynamics
- Homes sold faster at a median Days on Market (DOM) of 44 days in 2017, compared to 39 in 2016, signaling strong mid-tier activity.
- The average DOM increased slightly to 75 days, from 74 in 2016, driven by the luxury segment and larger properties.
- The ClsPr/LstPr Ratio improved to 97.81%, compared to 97.58% in 2016, reflecting enhanced alignment between sellers and buyers.
- The ClsPr/OLP Ratio also rose to 95.52%, up from 94.85%, indicating fewer price adjustments for original listings.
Notable Trends and Outliers
Homes with pool increased slightly to 61 in 2017, from 59 in 2016, maintaining buyer interest in leisure-focused amenities.
New construction surged to 34 homes in 2017, up from 27 in 2016, signaling increased demand for modern builds.
The most expensive home in 2017, priced at $1,361,472, was a custom-built property in Rockland Farms neighborhood, showcasing a shift toward high-end new builds over sprawling luxury estates.
Economic Factors
The mortgage rate rose to 4.14% in 2017, compared to 3.79% in 2016, potentially influencing affordability in high-value segments.
However, the market retained its resilience, with volumes and pricing reflecting continued buyer confidence and activity.
Key Takeaway
The 2017 real estate market in Lucas, Texas demonstrated solid growth in transactions and consistent price appreciation, supported by strong mid-tier sales, modern luxury offerings, and an increased supply of new construction homes. Despite a slight uptick in mortgage rates, buyers remained actively engaged, reinforcing the market’s vitality and diversity.
Summary of Real Estate Market Analysis for Lucas, TX in 2017
The 2017 real estate market in Lucas, Texas showcased outstanding performance, reflecting balance, growth, and adaptability. With an increase in transactions and steady appreciation, the market offered opportunities that spanned across all buyer preferences, from entry-level homes to luxurious custom-built properties. The rise in homes with pool and new construction highlighted the evolving priorities of modern buyers, while price stability and quick mid-tier sales emphasized a healthy market dynamic.
Even with a slight rise in mortgage rates, Lucas, TX demonstrated resilience and diversity, cementing its reputation as a vibrant and inclusive market. The year set a strong foundation for continued growth and success, confirming Lucas’s appeal to a broad spectrum of buyers.
The Importance of Statistical Data in Lucas, Texas Real Estate Market
Did you know that appraisers and Realtors rely on historical statistical data to determine a property’s current value?
Analyzing historical market data is essential for making informed decisions in today’s real estate market. Examining past trends provides valuable insights that facilitate accurate pricing, more strategic negotiations, and a comprehensive understanding of market dynamics.
Unlock Exceptional Service!
Assistance with all your real estate needs in the Dallas-Fort Worth area is just a click or call away. Reach out at 214-940-8149 or connect through the links below.

Greetings! I’m Oleg Sedletsky, and I’m excited to introduce myself as your go-to full-time licensed Texas REALTOR® and Mortgage Loan Originator.
I proudly represent JPAR® – Real Estate Brokerage as a REALTOR® and Utopia Mortgage LLC as a Mortgage Loan Originator! My designations and certifications reflect my dedication to helping you achieve your real estate goals in Lucas, TX and other locations in the vibrant Dallas-Fort Worth area!
My commitment to ongoing professional development means I’m always enhancing my skills to serve you better. You can count on me as your trusted expert throughout your real estate journey. Plus, I’m fluent in English, Ukrainian, and Russian and ready to assist you every step of the way!
It’s All About You and Your Real Estate Goals!
My mission is to serve you! With my knowledge and expertise, I’m here to help you achieve all your real estate goals!
I’m passionate about helping buyers and sellers navigate the exciting real estate landscape in Lucas, Texas! Whether you’re searching for your dream home, exploring land options, or looking for commercial properties, my Real Estate Services have you covered.
Contact me today for all your real estate needs in Lucas, Texas! Call/text 214-940-8149

A Comprehensive Analysis of Single-Family Residential Housing Market in Lucas, TX: 2003 to Present
2003-2010
Lucas, TX Real Estate Market Report 2003: Analysis and Trends
Lucas, TX Real Estate Market Report 2004: Analysis and Trends
Lucas, TX Real Estate Market Report 2005: Analysis and Trends
Lucas, TX Real Estate Market Report 2006: Analysis and Trends
Lucas, TX Real Estate Market Report 2007: Analysis and Trends
Lucas, TX Real Estate Market Report 2008: Analysis and Trends
Lucas, TX Real Estate Market Report 2009: Analysis and Trends
Lucas, TX Real Estate Market Report 2010: Analysis and Trends
2011-2020
Lucas, TX Real Estate Market Report 2011: Analysis and Trends
Lucas, TX Real Estate Market Report 2012: Analysis and Trends
Lucas, TX Real Estate Market Report 2013: Analysis and Trends
Lucas, TX Real Estate Market Report 2014: Analysis and Trends
Lucas, TX Real Estate Market Report 2015: Analysis and Trends
Lucas, TX Real Estate Market Report 2016: Analysis and Trends
Lucas, TX Real Estate Market Report 2017: Analysis and Trends
Lucas, TX Real Estate Market Report 2018: Analysis and Trends
Lucas, TX Real Estate Market Report 2019: Analysis and Trends
Lucas, TX Real Estate Market Report 2020: Analysis and Trends
This market analysis is intended solely for educational purposes. This market analysis is based on data sourced from NTREIS, Inc. This analysis is exclusively focused on single-family homes and does not account for other property types. The total number of real estate transactions within the specified period and location may vary. Data accuracy cannot be guaranteed due to potential input errors made by NTREIS users. This market analysis does not account for all new construction home sales. If you need detailed information about recorded property sales or other public records, please contact the appropriate city or county office.

Lucas, TX Real Estate: A Comprehensive Analysis of the 2016 Single-Family Residential Housing Market
The 2016 real estate market in Lucas, Texas witnessed impressive growth and diversification, offering options for a broad spectrum of buyers. With a higher transaction volume, expanded luxury listings, and an upswing in property values, the market displayed resilience and vibrancy. Adding to its allure were more new builds and properties flaunting leisure-enhancing amenities like pools, creating an aspirational yet adaptable market environment.
Key Takeaways and Trends from Lucas’s 2016 Real Estate Market
1. Pricing Range
- The increase in minimum price to $150,000 signaled reduced lower-end inventory.
- Luxury sales recovered, with the maximum price hitting $1,850,000, compared to $1,115,000 in 2015.
- The average and median prices surged, echoing broader market value appreciation.
2. Market Efficiency
- Quick turnarounds for mid-tier homes, indicated by a median DOM of 39 days, displayed strong demand.
- The ClsPr/LstPr ratio at 97.58% remained stable, signaling ongoing alignment between sellers and buyers.
3. Unique Outliers
- Pool homes continued to be a strong segment, with 59 featured properties, despite a slight dip from 2015.
- The surge of 27 new constructions demonstrated the market’s increasing modernization.
- The year’s most expensive sale, an equestrian ranch, provided an aspirational benchmark for the luxury segment.
4. Mortgage Rates Impact
Lower average mortgage rates of 3.79% encouraged affordability and may have played a significant role in driving transaction growth and supporting luxury purchases.
Total Homes Closed
A total of 131 homes closed in 2016, highlighting an increase in activity compared to the 124 homes sold in 2015. Among these, 27 were new constructions, a substantial rise reflecting continued enthusiasm for contemporary designs. Meanwhile, 59 homes featured pools, showing a sustained demand for properties with added lifestyle features.
Property Pricing Insights
The 2016 pricing data unveiled a remarkable range and strength in valuations:
- Minimum Price: $150,000, indicating fewer lower-end options compared to the previous year.
- Maximum Price: $1,850,000, showcasing a resurgence in high-value transactions.
- Average Price: $652,136, reflecting significant appreciation in property values.
- Median Price: $600,000, confirming robust mid-tier buyer interest.
- Average Price per Square Foot: $163.62, an uptick that signals heightened valuations in the market.
Property Size and Features
Properties catered to diverse preferences, with sizes and configurations to match:
- Bedrooms: Ranged from 2 to 8, with a market average of 4 bedrooms.
- Bathrooms: Varied from 2 to 8, averaging 4 bathrooms.
- Square Footage: Homes ranged from 1,374 sq. ft. to 7,508 sq. ft., with an average of 4,038 sq. ft. reflecting larger living spaces compared to prior years.
- Lot Sizes: Properties spanned 0.00 to 25.00 acres, averaging 1.996 acres, indicative of increased availability for estate-style homes.
Market Dynamics
Efficiency remained a hallmark of the 2016 market, as seen in:
- Days on Market (DOM): Homes averaged 74 days on the market, up slightly from 67 days in 2015; however, the median DOM fell to 39 days, pointing to faster mid-tier transactions.
- ClsPr/LstPr Ratio: Sellers earned 97.58% of listing prices, reflecting strong buyer and seller alignment.
- ClsPr/OLP Ratio: Declined slightly to 94.85%, suggesting moderate pricing adjustments.
- Price per Square Foot: At $163.62, the market demonstrated clear appreciation and growing buyer demand.
Insights into the Most Expensive Lucas, TX Property Sold in 2016
The most expensive property sold in Lucas, Texas during 2016 was a magnificent equestrian ranch, blending luxury and natural beauty across 17 acres of rolling terrain with a serene, private lake. Closing at $1,850,000, this property epitomized exclusivity and premium value. Below are the standout details:
- Price: $1,850,000
- Beds/Baths: 5 bedrooms, 5 bathrooms (4 full, 1 half)
- Square Footage: 5,121 sq. ft.
- Price per Square Foot: $361.26
- Lot Size: 17.310 acres
- Days on Market (DOM): 26 days, demonstrating high buyer demand
- ClsPr/LstPr Ratio: 94.87%
- ClsPr/OLP Ratio: 94.87%
- Year Built: 2000
This property set a benchmark for luxury listings, combining vast land, modern living amenities, and unparalleled charm, making it the highlight of Lucas’s 2016 real estate market.
Economic context

Average Electricity Costs in Dallas-Fort Worth in 2016
Electricity prices continued to decrease, settling at $0.11 per kilowatt-hour in 2016, down from $0.12 in 2015. This steady decline further incentivized interest in larger homes, which naturally consume more power. The trend also nudged developers to prioritize energy efficiency in new housing projects.
Average Price for Regular Gasoline in Texas in 2016
Gas prices dropped further to $1.91 per gallon in 2016, down from $2.17 in 2015. This decline reduced commuter expenses, inspiring homebuyers to explore housing options further from city centers. Properties in areas with good road infrastructure likely became more desirable, as homebuyers factored in affordable fuel costs.
Average 30-Year Fixed Mortgage Rate in 2016
Mortgage rates fell slightly again, settling at 3.79% in 2016, compared to 3.99% the prior year. This favorable environment for financing encouraged many homebuyers to jump into the market. Getting pre-approved with a local mortgage loan originator ensured buyers could seize opportunities quickly and position themselves in a competitive market.
Curious about today’s mortgage rates and the home you can comfortably afford?
Submit a no-obligation mortgage application today and get pre-approved to determine your budget and take the first step toward homeownership with confidence.
Overview of Differences Between the 2015 and 2016 Real Estate Markets in Lucas, Texas
Total Homes Sold
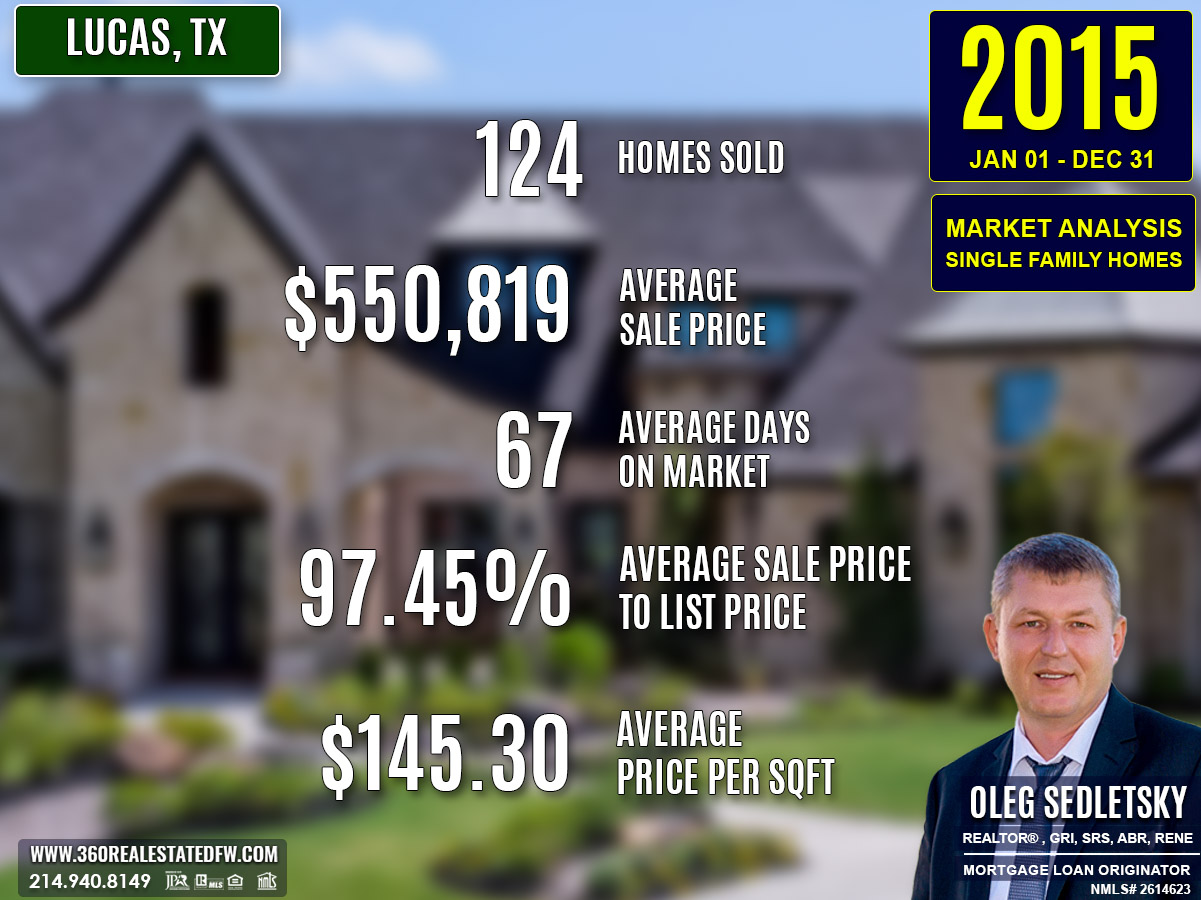
131 homes closed in 2016, up from 124 in 2015, showing a rise in transaction activity and market engagement.
Pricing Insights
- The minimum price rose to $150,000 in 2016, compared to $35,000 in 2015, indicating fewer extremely low-priced homes.
- The maximum price surged to $1,850,000, a notable jump from $1,115,000 in 2015, signaling higher-end luxury estate transactions.
- The average price increased significantly to $652,136, up from $550,819, reflecting greater overall market valuation.
- The median price also increased to $600,000 from $545,625, highlighting stronger mid-tier performance.
- The price per square foot rose to $163.62 in 2016, compared to $145.30, indicating greater valuation per property unit.
Property Features
- Properties in 2016 demonstrated larger configurations, with bedroom options increasing to 8, compared to 7 in 2015.
- Bathrooms expanded, ranging from 2 to 8 bathrooms in 2016, up from a maximum of 7 in 2015.
- Square footage saw a higher maximum at 7,508 sq. ft., compared to 6,276 sq. ft. in 2015, resulting in a higher average size of 4,038 sq. ft.
- Lot sizes expanded dramatically, with a maximum lot size of 25.00 acres in 2016, up from 6.000 acres, showcasing the inclusion of estate-style and rural luxury homes.
Market Dynamics
- The average Days on Market (DOM) rose slightly to 74 days, compared to 67 in 2015, yet the median DOM decreased to 39 days, down from 42, suggesting quicker mid-range sales.
- The ClsPr/LstPr ratio remained stable at 97.58% in 2016, versus 97.45% in 2015, maintaining seller confidence.
- The ClsPr/OLP ratio slightly declined to 94.85%, compared to 95.51% in 2015, implying modest increases in price adjustments.
Notable Trends and Outliers
- Pool homes slightly decreased to 59 in 2016, compared to 60 in 2015, yet remained a desirable feature.
- New construction surged to 27 in 2016, up from 17 in 2015, indicating a growing preference for modern builds.
- The year’s most expensive property in 2016, a $1,850,000 equestrian ranch, far exceeded 2015’s top sale of $1,115,000, signaling a rebound in high-value luxury sales.
Economic Factors
Lower mortgage rates averaging 3.79% in 2016, compared to 3.99% in 2015, likely supported the increase in overall transaction volume and market momentum.
Key Takeaway
The 2016 real estate market in Lucas, TX showed significant growth across all price ranges, driven by expanded property features, increased new construction, and greater luxury sales. Efficient sales continued, while lowered mortgage rates encouraged diverse buying activity.
Summary of Real Estate Market Analysis for Lucas, TX in 2016
The 2016 real estate market in Lucas, Texas, showcased remarkable growth, diversity, and adaptability, solidifying its ability to appeal to various buyer segments. With an increased number of transactions, rising property values, and expanded offerings from suburban homes to luxurious estates, the market demonstrated both resilience and vibrancy.
The addition of new construction homes and the continued popularity of pool properties highlighted evolving buyer priorities. At the same time, the emergence of high-value sales, such as the $1.85 million equestrian ranch, exemplified the market’s potential for standout luxury listings. Supported by favorable economic conditions, including lower mortgage rates, Lucas’s 2016 market delivered a balanced and thriving real estate environment, paving the way for sustained engagement and growth.
The Importance of Statistical Data in Lucas, Texas Real Estate Market
Did you know that appraisers and Realtors rely on historical statistical data to determine a property’s current value?
Analyzing historical market data is essential for making informed decisions in today’s real estate market. Examining past trends provides valuable insights that facilitate accurate pricing, more strategic negotiations, and a comprehensive understanding of market dynamics.
Unlock Exceptional Service!
Assistance with all your real estate needs in the Dallas-Fort Worth area is just a click or call away. Reach out at 214-940-8149 or connect through the links below.
Greetings! I’m Oleg Sedletsky, and I’m excited to introduce myself as your go-to full-time licensed Texas REALTOR® and Mortgage Loan Originator.
I proudly represent JPAR® – Real Estate Brokerage as a REALTOR® and Utopia Mortgage LLC as a Mortgage Loan Originator! My designations and certifications reflect my dedication to helping you achieve your real estate goals in Lucas, TX and other locations in the vibrant Dallas-Fort Worth area!
My commitment to ongoing professional development means I’m always enhancing my skills to serve you better. You can count on me as your trusted expert throughout your real estate journey. Plus, I’m fluent in English, Ukrainian, and Russian and ready to assist you every step of the way!
It’s All About You and Your Real Estate Goals!
My mission is to serve you! With my knowledge and expertise, I’m here to help you achieve all your real estate goals!
I’m passionate about helping buyers and sellers navigate the exciting real estate landscape in Lucas, Texas! Whether you’re searching for your dream home, exploring land options, or looking for commercial properties, my Real Estate Services have you covered.
Contact me today for all your real estate needs in Lucas, Texas! Call/text 214-940-8149
A Comprehensive Analysis of Single-Family Residential Housing Market in Lucas, TX: 2003 to Present
2003-2010
Lucas, TX Real Estate Market Report 2003: Analysis and Trends
Lucas, TX Real Estate Market Report 2004: Analysis and Trends
Lucas, TX Real Estate Market Report 2005: Analysis and Trends
Lucas, TX Real Estate Market Report 2006: Analysis and Trends
Lucas, TX Real Estate Market Report 2007: Analysis and Trends
Lucas, TX Real Estate Market Report 2008: Analysis and Trends
Lucas, TX Real Estate Market Report 2009: Analysis and Trends
Lucas, TX Real Estate Market Report 2010: Analysis and Trends
2011-2020
Lucas, TX Real Estate Market Report 2011: Analysis and Trends
Lucas, TX Real Estate Market Report 2012: Analysis and Trends
Lucas, TX Real Estate Market Report 2013: Analysis and Trends
Lucas, TX Real Estate Market Report 2014: Analysis and Trends
Lucas, TX Real Estate Market Report 2015: Analysis and Trends
Lucas, TX Real Estate Market Report 2016: Analysis and Trends
Lucas, TX Real Estate Market Report 2017: Analysis and Trends
Lucas, TX Real Estate Market Report 2018: Analysis and Trends
Lucas, TX Real Estate Market Report 2019: Analysis and Trends
Lucas, TX Real Estate Market Report 2020: Analysis and Trends
This market analysis is intended solely for educational purposes. This market analysis is based on data sourced from NTREIS, Inc. This analysis is exclusively focused on single-family homes and does not account for other property types. The total number of real estate transactions within the specified period and location may vary. Data accuracy cannot be guaranteed due to potential input errors made by NTREIS users. This market analysis does not account for all new construction home sales. If you need detailed information about recorded property sales or other public records, please contact the appropriate city or county office.

Lucas, TX Real Estate: A Comprehensive Analysis of the 2015 Single-Family Residential Housing Market
The real estate market in Lucas, Texas continued to thrive in 2015, reflecting both stability and progress. With an increase in transactions and diverse property options, the year catered to a wide range of buyers, from first-time homebuyers to those seeking high-value properties. Improved affordability and efficiency characterized a market that balanced practical options with leisure-focused and modern homes.
Key Takeaways and Trends from Lucas’s 2015 Real Estate Market
1. Pricing Range
- The pricing spectrum widened, with minimum prices dropping to $35,000 and maximum prices capping at $1,115,000, showing a pullback in ultra-luxury sales.
- Average and median prices remained steady, reinforcing the strength of the mid-tier segment.
2. Market Efficiency
- The average Days on Market (67 days) and median DOM (42 days) revealed an increasingly efficient transaction process.
- The ClsPr/LstPr ratio at 97.45% and improved ClsPr/OLP ratio at 95.51% demonstrated robust market confidence.
3. Unique Outliers
- Pool homes grew significantly, with 60 properties featuring pools, up from 45 in 2014.
- While new construction decreased slightly to 17 homes, the market sustained a balance of modern options.
- The year’s priciest property at $1,115,000 highlighted buyer interest in newer, premium residences.
4. Mortgage Rates Impact
The decline in mortgage rates to 3.99% likely spurred higher transaction volumes and overall buyer confidence, maintaining market activity across price ranges.
Total Homes Closed
A total of 124 homes closed in 2015, representing increased activity compared to the prior year’s 108 transactions. Among these sales, 60 homes featured pools, reflecting sustained or growing demand for lifestyle amenities. Additionally, 17 new construction homes entered the market, emphasizing interest in modern, updated housing options.
Property Pricing Insights
The pricing spectrum in 2015 highlighted affordability at one end and exclusivity at the other:
- Minimum Price: $35,000, offering greater affordability compared to 2014.
- Maximum Price: $1,115,000, showcasing high-end property options.
- Average Price: $550,819, reflecting stability in mid-tier housing.
- Median Price: $545,625, slightly increasing from the previous year, confirming consistent buyer demand.
- Average Price per Square Foot: $145.30, a noticeable increase from 2014, signaling an appreciation in property values.
Property Size and Features
Properties represented a variety of configurations suitable for diverse buyer preferences:
- Bedrooms: Homes offered a range from 1 to 7 bedrooms, with an average of 4 bedrooms.
- Bathrooms: Properties had between 2 and 7 bathrooms, averaging 4 bathrooms.
- Square Footage: Sizes ranged from 837 sq. ft. to 6,276 sq. ft., with an average of 3,782 sq. ft.
- Lot Size: Lot sizes ranged from 0.00 to 6.00 acres, averaging 1.652 acres, indicating fewer large estates compared to the previous year.
Market Dynamics
The overall market remained efficient and favorable for both buyers and sellers:
- Days on Market (DOM): Properties averaged 67 days to sell, an improvement from 2014’s average of 70 days. Median DOM also decreased to 42 days, reflecting faster transactions.
- ClsPr/LstPr Ratio: Sellers closed at 97.45% of listing prices, showing strong alignment between listed and sale prices.
- ClsPr/OLP Ratio: Improved slightly to 95.51%, signaling modest adjustments from original listing prices.
- Price per Square Foot: At $145.30, the market demonstrated a clear trend of rising valuations.
Insights into the Most Expensive Lucas, TX Property Sold in 2015
The most expensive property sold in Lucas, Texas during 2015 was a remarkable new construction home, showcasing modern design and premium features. This luxurious residence sold for an impressive $1,115,000, highlighting strong demand for high-end, contemporary properties. Key details of this extraordinary sale include:
- Price: $1,115,000
- Beds/Baths: 4 bedrooms, 5 bathrooms (4 full, 1 half)
- Square Footage: 5,003 sq. ft.
- Price per Square Foot: $222.87
- Lot Size: 2.049 acres
- Days on Market (DOM): 66 days, reflecting quick buyer interest
- ClsPr/LstPr Ratio: 98.24%
- ClsPr/OLP Ratio: 98.24%
- Year Built: 2014
This property represents the perfect balance of style, functionality, and modern luxury, cementing its status as the standout transaction of the year.
Economic context
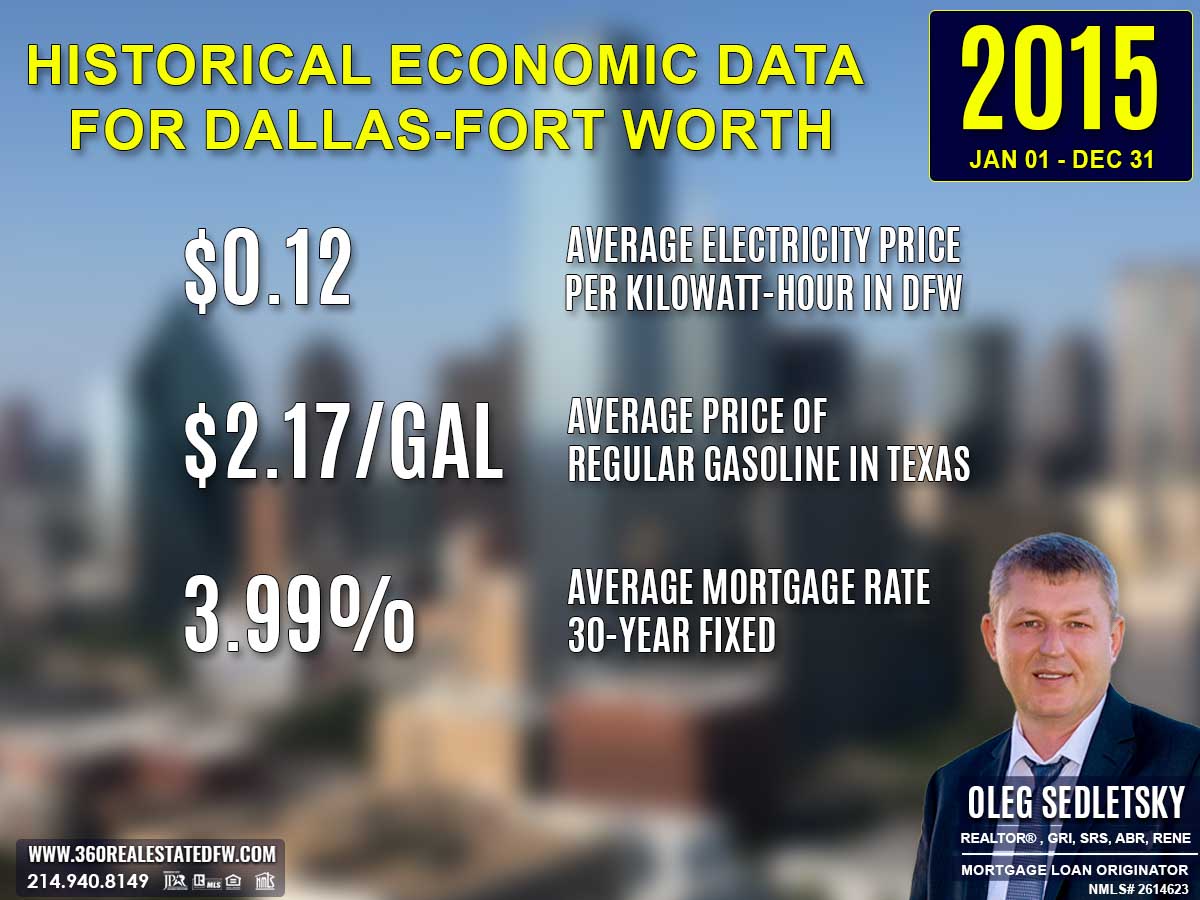
Average Electricity Costs in Dallas-Fort Worth in 2015
Electricity prices dipped to $0.12 per kilowatt-hour in 2015, down from $0.13 in 2014. This small decrease likely provided a bit of financial breathing room to households, which could have been channeled into homeownership costs. Prospective homebuyers looking for energy-friendly homes continued to dominate market trends.
Average Price for Regular Gasoline in Texas in 2015
Gas prices fell significantly to $2.17 per gallon in 2015, down from $3.15 in 2014. Plummeting fuel costs were a game-changer for homebuyers considering longer commutes. Lower transportation expenses made suburban and rural areas increasingly attractive, potentially driving demand for properties in these regions.
Average 30-Year Fixed Mortgage Rate in 2015
Mortgage rates declined slightly to 3.99% in 2015, down from 4.31% in 2014. homebuyers took advantage of this drop to enter the housing market or refinance existing loans for more affordable terms. Partnering with a local mortgage loan originator to secure pre-approval was crucial for those navigating the competitive environment fueled by lower rates.
Curious about today’s mortgage rates and the home you can comfortably afford?
Submit a no-obligation mortgage application today and get pre-approved to determine your budget and take the first step toward homeownership with confidence.
Overview of Differences Between the 2014 and 2015 Real Estate Markets in Lucas, Texas
Comparing Lucas’s real estate markets for 2014 and 2015 reveals significant shifts and growth over the year:
Total Homes Sold
124 homes closed in 2015, up from 108 in 2014, illustrating strong market activity and rising buyer demand.
Pricing Insights
- The minimum price dropped sharply to $35,000 in 2015 from $200,000 in 2014, indicating greater affordability options.
- The maximum price fell to $1,115,000, a notable decline from $1,950,000 in 2014, highlighting a dip in ultra-luxury sales.
- The average price remained steady at $550,819 in 2015, compared to $549,353 in 2014, showing consistent mid-tier market strength.
- The median price increased slightly to $545,625, from $515,000, reflecting stronger balance in mid-range sales.
- The price per square foot rose to $145.30 in 2015, compared to $139.91 in 2014, indicating heightened valuations per unit of space.
Property Features
- The range of bedrooms expanded, with homes featuring anywhere from 1 to 7 bedrooms in 2015, compared to 2 to 7 in 2014.
- Bathrooms standardized, with homes offering 2 to 7 bathrooms in 2015, down from a maximum of 9 in 2014.
- Square footage saw a lower minimum in 2015 (837 sq. ft. compared to 1,744 sq. ft. in 2014) and a lower maximum (6,276 sq. ft. versus 7,862 sq. ft.), though average and median sizes remained stable.
- Lot sizes also saw a notable decrease, with a maximum size of 6.00 acres in 2015, compared to 72.199 acres in 2014, signaling fewer estate-style properties.
Market Dynamics
- The Days on Market (DOM) improved, with homes selling in an average of 67 days in 2015, compared to 70 days in 2014. The median DOM fell to 42 days, from 46, showing expedited sales.
- Seller performance remained steady, with the ClsPr/LstPr ratio at 97.45% in 2015, slightly lower than 97.60% in 2014.
- The ClsPr/OLP ratio increased slightly, reaching 95.51%, suggesting marginally improved seller power on original pricing.
Notable Trends and Outliers
- Homes with pools surged to 60 in 2015, up from 45 in 2014, indicating growing buyer interest in leisure properties.
- New construction homes showed a slight decrease, with 17 new builds in 2015, compared to 19 in 2014.
- The year’s most expensive property was significantly lower in value at $1,115,000, compared to 2014’s $1,950,000, but it was a quick sale, closing in 66 days.
Economic Factors
Mortgage rates fell to 3.99% in 2015 from 4.31% in 2014, likely contributing to the rise in transactions and support for market affordability.
Key Takeaway
While 2015 saw fewer high-value luxury sales compared to 2014, the market demonstrated resilience and growth, with more homes sold, faster transaction timelines, and increased demand for practical homes and leisure amenities. The dip in mortgage rates played a significant role in maintaining strong buyer interest in Lucas’s real estate market.
Summary of Real Estate Market Analysis for Lucas, TX in 2015
The 2015 real estate market in Lucas, Texas reflected a dynamic and well-balanced environment, showcasing its ability to cater to an extensive range of buyers. With a notable rise in transactions, increased demand for leisure-centric features, and a stable mid-tier segment, the market underscored its diversity and appeal.
While high-value luxury sales slightly receded, the year emphasized practicality, modern living, and efficiency in sales. Lower mortgage rates further supported activity, making homeownership more accessible while boosting confidence among both buyers and sellers. Lucas’s evolving housing market in 2015 demonstrated strong adaptability and resilience, cementing its status as an attractive and versatile destination for real estate investment.
The Importance of Statistical Data in Lucas, Texas Real Estate Market
Did you know that appraisers and Realtors rely on historical statistical data to determine a property’s current value?
Analyzing historical market data is essential for making informed decisions in today’s real estate market. Examining past trends provides valuable insights that facilitate accurate pricing, more strategic negotiations, and a comprehensive understanding of market dynamics.
Unlock Exceptional Service!
Assistance with all your real estate needs in the Dallas-Fort Worth area is just a click or call away. Reach out at 214-940-8149 or connect through the links below.
Greetings! I’m Oleg Sedletsky, and I’m excited to introduce myself as your go-to full-time licensed Texas REALTOR® and Mortgage Loan Originator.
I proudly represent JPAR® – Real Estate Brokerage as a REALTOR® and Utopia Mortgage LLC as a Mortgage Loan Originator! My designations and certifications reflect my dedication to helping you achieve your real estate goals in Lucas, TX and other locations in the vibrant Dallas-Fort Worth area!
My commitment to ongoing professional development means I’m always enhancing my skills to serve you better. You can count on me as your trusted expert throughout your real estate journey. Plus, I’m fluent in English, Ukrainian, and Russian and ready to assist you every step of the way!
It’s All About You and Your Real Estate Goals!
My mission is to serve you! With my knowledge and expertise, I’m here to help you achieve all your real estate goals!
I’m passionate about helping buyers and sellers navigate the exciting real estate landscape in Lucas, Texas! Whether you’re searching for your dream home, exploring land options, or looking for commercial properties, my Real Estate Services have you covered.
Contact me today for all your real estate needs in Lucas, Texas! Call/text 214-940-8149
A Comprehensive Analysis of Single-Family Residential Housing Market in Lucas, TX: 2003 to Present
2003-2010
Lucas, TX Real Estate Market Report 2003: Analysis and Trends
Lucas, TX Real Estate Market Report 2004: Analysis and Trends
Lucas, TX Real Estate Market Report 2005: Analysis and Trends
Lucas, TX Real Estate Market Report 2006: Analysis and Trends
Lucas, TX Real Estate Market Report 2007: Analysis and Trends
Lucas, TX Real Estate Market Report 2008: Analysis and Trends
Lucas, TX Real Estate Market Report 2009: Analysis and Trends
Lucas, TX Real Estate Market Report 2010: Analysis and Trends
2011-2020
Lucas, TX Real Estate Market Report 2011: Analysis and Trends
Lucas, TX Real Estate Market Report 2012: Analysis and Trends
Lucas, TX Real Estate Market Report 2013: Analysis and Trends
Lucas, TX Real Estate Market Report 2014: Analysis and Trends
Lucas, TX Real Estate Market Report 2015: Analysis and Trends
Lucas, TX Real Estate Market Report 2016: Analysis and Trends
Lucas, TX Real Estate Market Report 2017: Analysis and Trends
Lucas, TX Real Estate Market Report 2018: Analysis and Trends
Lucas, TX Real Estate Market Report 2019: Analysis and Trends
Lucas, TX Real Estate Market Report 2020: Analysis and Trends
This market analysis is intended solely for educational purposes. This market analysis is based on data sourced from NTREIS, Inc. This analysis is exclusively focused on single-family homes and does not account for other property types. The total number of real estate transactions within the specified period and location may vary. Data accuracy cannot be guaranteed due to potential input errors made by NTREIS users. This market analysis does not account for all new construction home sales. If you need detailed information about recorded property sales or other public records, please contact the appropriate city or county office.

Lucas, TX Real Estate: A Comprehensive Analysis of the 2014 Single-Family Residential Housing Market
The 2014 real estate market in Lucas, Texas demonstrated significant growth and diversity, appealing to a wide array of buyers. With an increase in transaction volume and a variety of property options, the year showcased balanced opportunities, from luxury estates to modern, mid-tier homes. Rising prices and demand for leisure amenities further reflected the market’s robust appeal.
Key Takeaways and Trends from Lucas’s 2014 Real Estate Market
1. Pricing Range
- From $200,000 to $1,950,000, the price range reflected stronger market segmentation, including affordable entry points and luxury investments.
- The growth in average price to $549,353 and median to $515,000 suggests sustained activity in the mid-tier segment.
- Rising price per square foot ($139.91) highlights increasing valuations for all property types.
2. Market Efficiency
- Average DOM dropped to 70 days, confirming faster sales processes.
- Sellers achieved 97.60% of list prices, signaling tighter negotiations and strong metrics for market confidence.
3. Unique Outliers
- 45 pool homes gained traction, demonstrating the importance of leisure-focused property features.
- New construction homes rose to 19, reflecting moderate increases in modern housing developments.
- Larger lot sizes re-emerged, with a peak size of 72.199 acres, showing renewed interest in estate and expansive properties.
4. Mortgage Rates Impact
The increase in mortgage rates to 4.31% had minimal impact on overall activity, suggesting strong buyer confidence and a wealthy demographic.
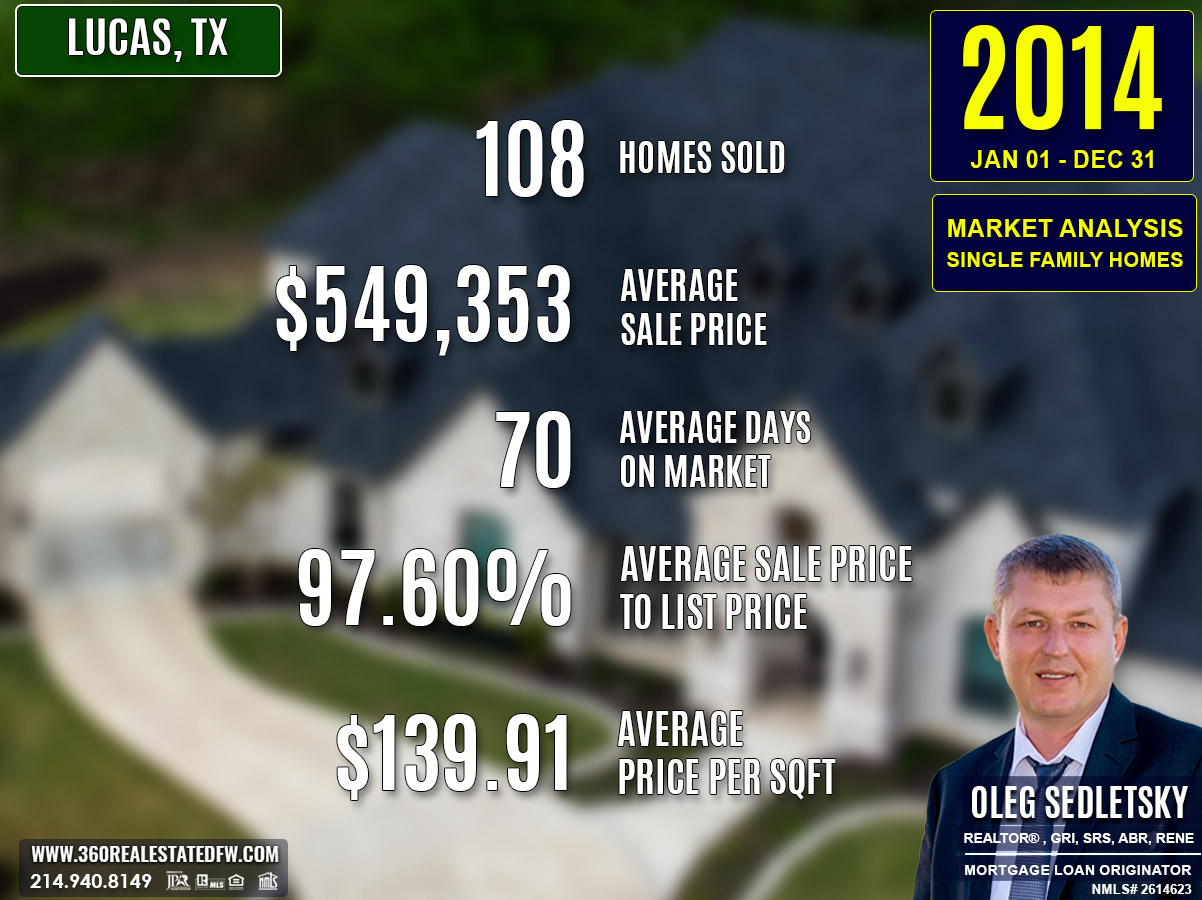
Total Homes Closed
A total of 108 homes were closed in 2014, reflecting a notable increase from 2013. Among these, 45 homes featured pools, emphasizing leisure-focused lifestyles, while 19 new construction homes appeared, providing fresh, modern housing options for buyers.
Property Pricing Insights
Pricing metrics for 2014 highlighted an expansive market accommodating diverse budgets:
- Minimum Price: $200,000, representing a higher entry point than the previous year.
- Maximum Price: $1,950,000, signaling a revival of high-end, ultra-luxury transactions.
- Average Price: $549,353, reflecting a healthier mid-tier segment.
- Median Price: $515,000, reinforcing consistency within mid-range sales.
- Average Price per Square Foot: $139.91, showing increased property valuations.
Property Size and Features
Home sizes and features remained varied, appealing to families and luxury buyers alike:
- Bedrooms: Homes ranged from 2 to 7 bedrooms, with an average of 4 bedrooms.
- Bathrooms: Properties offered 1 to 9 bathrooms, averaging 4 bathrooms.
- Square Footage: Sizes varied between 1,744 sq. ft. to 7,862 sq. ft., averaging 3,860 sq. ft.
- Lot Sizes: Between 0.00 acres and 72.199 acres, with an average of 2.629 acres, showcasing increased interest in both practical and expansive estate properties.
Market Dynamics
The market in 2014 saw improved transaction speed and efficiency:
- Days on Market (DOM): Homes sold in 70 days on average, with a median DOM of 46 days, signaling quick closings.
- ClsPr/LstPr Ratio: Sellers achieved 97.60% of listing prices, indicating strong alignment between list and sale prices.
- ClsPr/OLP Ratio: Original listing prices matched 95.02% of final sale values, suggesting modest price adjustments.
Insights into the Most Expensive Lucas, TX Property Sold in 2014
The priciest property sold in Lucas, TX during 2014 set new benchmarks for luxury and estate-style living in the market. This impressive property closed at $1,950,000, offering a combination of vast living space and extensive acreage. Highlights of this remarkable sale include:
Price: $1,950,000
Beds/Baths: 7 bedrooms, 9 bathrooms (7 full, 2 half)
Square Footage: 7,862 sq. ft.
Price per Square Foot: $248.03
Lot Size: 72.199 acres
Days on Market (DOM): 448 days
ClsPr/LstPr Ratio: 88.64%
ClsPr/OLP Ratio: 67.24%
Year Built: 1998
This sprawling estate reflects the upper-end demand for expansive properties, blending luxury, privacy, and unique lifestyle opportunities.
Economic context
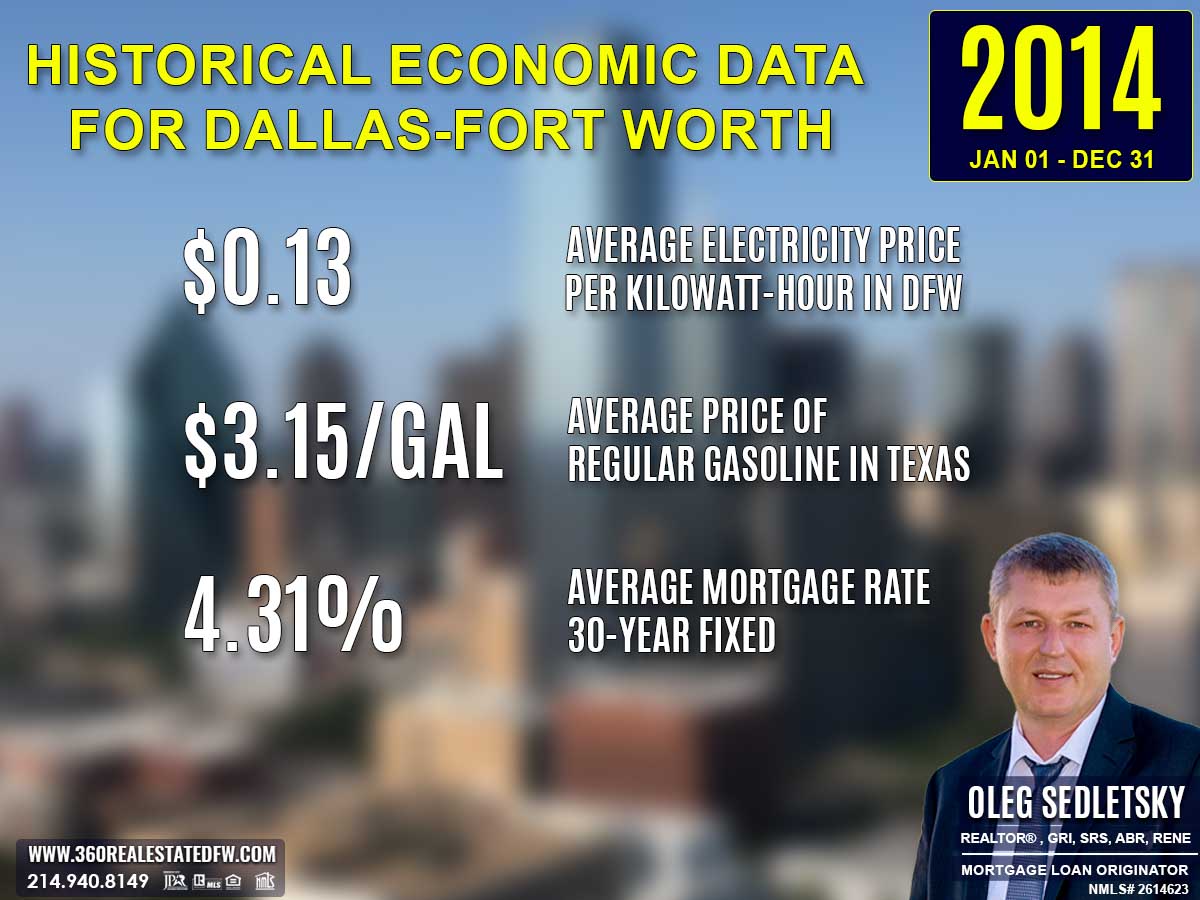
Average Electricity Costs in Dallas-Fort Worth in 2014
Electricity prices rose slightly to $0.13 per kilowatt-hour in 2014, up from $0.12 in 2013. This gradual increase added pressure to household budgets, further emphasizing the demand for energy-efficient properties. Sellers with homes featuring solar panels or updated appliances likely had an edge in the real estate market.
Average Price for Regular Gasoline in Texas in 2014
Gas prices decreased to $3.15 per gallon in 2014, down from $3.32 in 2013. Lower fuel costs may have encouraged homebuyers to look at properties in outer suburban areas, knowing transportation expenses were more manageable. This shift could have spurred demand in regions where homes were larger and more economical than urban alternatives.
Average 30-Year Fixed Mortgage Rate in 2014
Mortgage rates edged up to 4.31% in 2014 from the previous year’s 4.16%. This small increase emphasized the importance of timing in home purchases, as homebuyers aimed to lock in favorable terms before rates rose further. Securing pre-approval with a local mortgage loan originator remained a vital step for buyers to gain financial clarity during the purchasing process.
Curious about today’s mortgage rates and the home you can comfortably afford?
Submit a no-obligation mortgage application today and get pre-approved to determine your budget and take the first step toward homeownership with confidence.
Overview of Differences Between the 2013 and 2014 Real Estate Markets in Lucas, Texas
The real estate market in Boba saw notable shifts and growth between 2013 and 2014. Below is a detailed analysis of the differences:
Total Homes Sold
The market experienced an increase in activity, with 108 homes sold in 2014, compared to 98 homes in 2013. This represents a significant rise in sales volume, showcasing an uptick in buyer interest.
Pricing Insights
- The minimum price jumped from $93,410 in 2013 to $200,000 in 2014, indicating a stronger entry point for the market.
- The maximum price more than doubled, reaching $1,950,000, compared to $949,000 in 2013, reflecting renewed demand for high-value estate properties.
- The average price rose to $549,353, marking an increase from $505,722 in 2013, while the median price grew slightly to $515,000, reinforcing consistent demand for mid-tier properties.
- The price per square foot also climbed from $129.91 to $139.91, showing heightened property valuations.
Property Features
- Average bedroom and bathroom counts remained steady at 4 bedrooms and 4 bathrooms, but the variability increased with homes offering up to 9 bathrooms in 2014, compared to 7 in 2013.
- Square footage peaked at 7,862 sq. ft., up from 7,232 sq. ft. in 2013, with average and median total square footage remaining comparable.
- Lot sizes significantly expanded, with a maximum size of 72.199 acres, vastly greater than 14.56 acres in 2013, reflecting the return of large estate properties.
Market Dynamics
- Homes sold faster, with the average Days on Market (DOM) decreasing to 70 days from 77 days in 2013. The median DOM also increased slightly to 46 days, confirming steady momentum in sales processes.
- The ClsPr/LstPr ratio improved marginally, reaching 97.60%, up from 97.43% in 2013, reflecting strong alignment between listing prices and sale prices.
- The ClsPr/OLP ratio fell slightly to 95.02%, down from 96.64% in 2013, suggesting a marginal increase in price adjustments from the original listing price.
Notable Trends and Outliers
- The number of homes with pools rose to 45 in 2014, up from 39 in 2013, indicating continued demand for leisure amenities.
- New construction homes increased to 19 in 2014, from 14 in 2013, pointing to greater development activity and an emphasis on modern housing options.
- The most expensive property sold in 2014 reached an impressive $1,950,000. At 7,862 sq. ft. on 72.199 acres, this marked a return to ultra-luxury sales.
Economic Conditions
Slightly higher mortgage rates of 4.31% in 2014, compared to 4.16% in 2013, may have shifted focus toward mid-tier and high-value properties, yet the market showed resilience and growth, as reflected by rising prices and volume.
Key Takeaway
The 2014 market in Lucas, TX experienced robust growth, with more homes sold, higher pricing ceilings, and greater demand for unique estate-style properties. Improved transaction speed, increased new builds, and growing interest in leisure amenities signaled a strengthened and diversified market catering to a wider range of buyers.
Summary of Real Estate Market Analysis for Lucas, TX in 2014
The 2014 real estate market in Lucas, Texas demonstrated remarkable growth, diversity, and adaptability, making it an attractive destination for a wide range of buyers. From affordable properties to ultra-luxury estates, the market successfully addressed varying needs while maintaining robust performance metrics.
The increased sales volume, rising property valuations, and faster transaction timelines highlighted its efficiency and appeal. Coupled with the surge in leisure-focused homes and modern construction, Lucas’s market showcased its resilience and ability to evolve with buyer preferences. With strong alignment between pricing expectations and actual sales, the year established Lucas, TX as a dynamic and balanced real estate hub poised for continued growth.
The Importance of Statistical Data in Lucas, Texas Real Estate Market
Did you know that appraisers and Realtors rely on historical statistical data to determine a property’s current value?
Analyzing historical market data is essential for making informed decisions in today’s real estate market. Examining past trends provides valuable insights that facilitate accurate pricing, more strategic negotiations, and a comprehensive understanding of market dynamics.
Unlock Exceptional Service!
Assistance with all your real estate needs in the Dallas-Fort Worth area is just a click or call away. Reach out at 214-940-8149 or connect through the links below.
Greetings! I’m Oleg Sedletsky, and I’m excited to introduce myself as your go-to full-time licensed Texas REALTOR® and Mortgage Loan Originator.
I proudly represent JPAR® – Real Estate Brokerage as a REALTOR® and Utopia Mortgage LLC as a Mortgage Loan Originator! My designations and certifications reflect my dedication to helping you achieve your real estate goals in Lucas, TX and other locations in the vibrant Dallas-Fort Worth area!
My commitment to ongoing professional development means I’m always enhancing my skills to serve you better. You can count on me as your trusted expert throughout your real estate journey. Plus, I’m fluent in English, Ukrainian, and Russian and ready to assist you every step of the way!
It’s All About You and Your Real Estate Goals!
My mission is to serve you! With my knowledge and expertise, I’m here to help you achieve all your real estate goals!
I’m passionate about helping buyers and sellers navigate the exciting real estate landscape in Lucas, Texas! Whether you’re searching for your dream home, exploring land options, or looking for commercial properties, my Real Estate Services have you covered.
Contact me today for all your real estate needs in Lucas, Texas! Call/text 214-940-8149
A Comprehensive Analysis of Single-Family Residential Housing Market in Lucas, TX: 2003 to Present
2003-2010
Lucas, TX Real Estate Market Report 2003: Analysis and Trends
Lucas, TX Real Estate Market Report 2004: Analysis and Trends
Lucas, TX Real Estate Market Report 2005: Analysis and Trends
Lucas, TX Real Estate Market Report 2006: Analysis and Trends
Lucas, TX Real Estate Market Report 2007: Analysis and Trends
Lucas, TX Real Estate Market Report 2008: Analysis and Trends
Lucas, TX Real Estate Market Report 2009: Analysis and Trends
Lucas, TX Real Estate Market Report 2010: Analysis and Trends
2011-2020
Lucas, TX Real Estate Market Report 2011: Analysis and Trends
Lucas, TX Real Estate Market Report 2012: Analysis and Trends
Lucas, TX Real Estate Market Report 2013: Analysis and Trends
Lucas, TX Real Estate Market Report 2014: Analysis and Trends
Lucas, TX Real Estate Market Report 2015: Analysis and Trends
Lucas, TX Real Estate Market Report 2016: Analysis and Trends
Lucas, TX Real Estate Market Report 2017: Analysis and Trends
Lucas, TX Real Estate Market Report 2018: Analysis and Trends
Lucas, TX Real Estate Market Report 2019: Analysis and Trends
Lucas, TX Real Estate Market Report 2020: Analysis and Trends
This market analysis is intended solely for educational purposes. This market analysis is based on data sourced from NTREIS, Inc. This analysis is exclusively focused on single-family homes and does not account for other property types. The total number of real estate transactions within the specified period and location may vary. Data accuracy cannot be guaranteed due to potential input errors made by NTREIS users. This market analysis does not account for all new construction home sales. If you need detailed information about recorded property sales or other public records, please contact the appropriate city or county office.

Lucas, TX Real Estate: A Comprehensive Analysis of the 2013 Single-Family Residential Housing Market
The 2013 real estate market in Lucas, Texas demonstrated consistency and efficiency while catering to diverse buyer preferences. A total of 98 homes closed, matching the previous year’s sales volume, reflecting sustained demand. While high-end estate sales declined, the market leaned toward moderately sized and priced properties, with steady demand for leisure-focused features and efficient transaction timelines.
Key Takeaways and Trends from Lucas’s 2013 Real Estate Market
1. Pricing Range
- The wide pricing range of $93,410 to $949,000 provided entry-level affordability balanced with mid-range exclusivity.
- The average price drop and rise in price per square foot signaled a shift toward valuing smaller but well-finished properties.
2. Market Efficiency
- With an average DOM of 77 days and sellers achieving 97.43% of list prices, the 2013 market became faster and more efficient than the previous year.
- Increased alignment with original listing prices (96.64%) reflected fewer price reductions and closer expectations between buyers and sellers.
3. Unique Outliers
- Pool homes rose to 39, making them increasingly attractive to buyers.
- Lot sizes decreased, with no ultra-expansive estates like 2012’s 73-acre lot; the largest in 2013 measured 14.56 acres.
4. Mortgage Rates Impact
The mortgage rate rise to 4.16%, from 3.88% in 2012, may have tempered luxury sales but proved affordable enough to sustain moderate to mid-tier buyer activity.
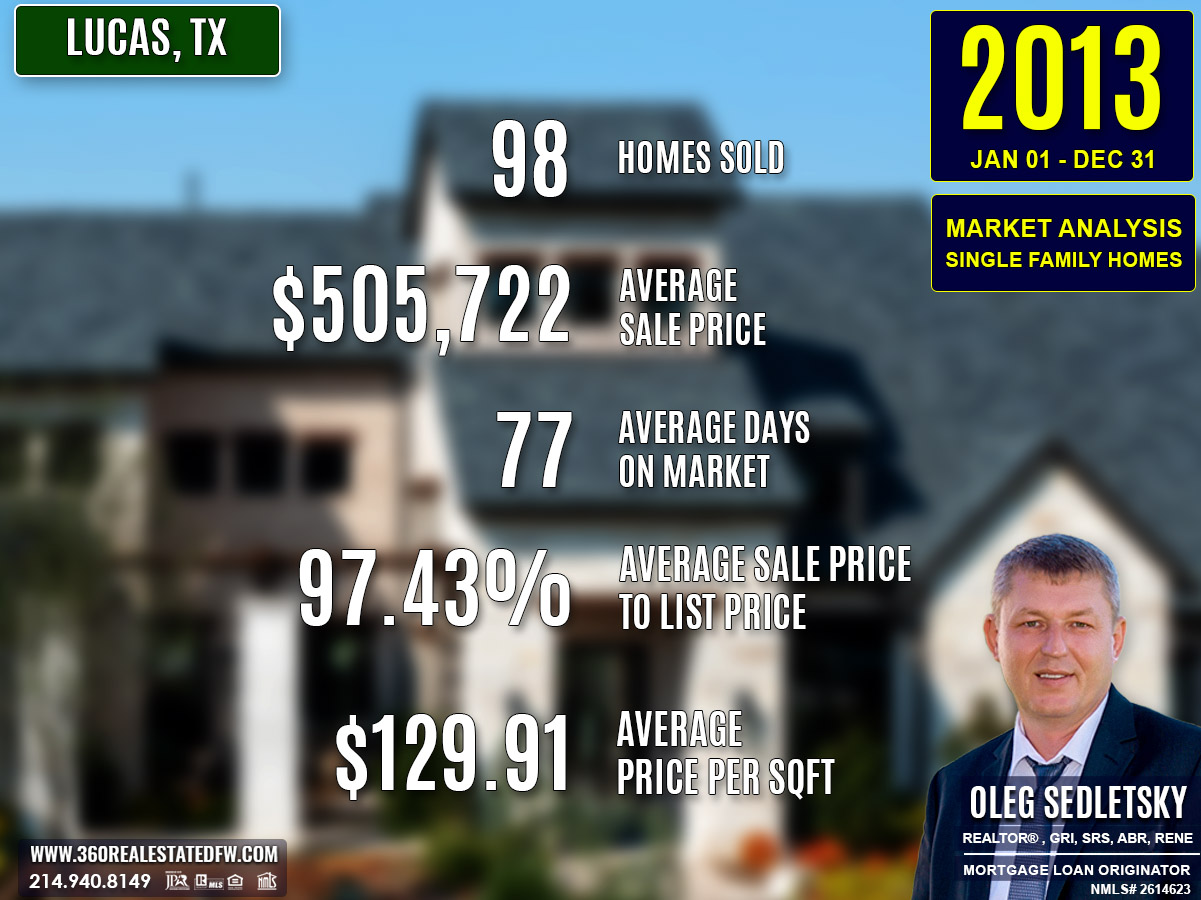
Total Homes Closed
During 2013, 98 homes were closed, maintaining steady transaction levels from 2012. Among these, 39 homes featured pools, continuing to highlight buyer interest in leisure amenities. Meanwhile, the market introduced 14 new construction homes, representing a slight decrease from the preceding year but consistent with the demand for updated, modern living spaces.
Property Pricing Insights
Property prices in 2013 highlighted a stable market overall but with a shift away from ultra-luxury transactions seen in the prior year:
- Minimum Price: $93,410, broadening affordability for entry-level buyers.
- Maximum Price: $949,000, a notable decline from the previous year’s $2,000,000 high.
- Average Price: $505,722, slightly lower than the 2012 average but reflective of sustained mid-range transactions.
- Median Price: $507,000, rising slightly from 2012, showing steady demand for mid-tier homes.
- Price per Square Foot (Avg): $129.91, up from $125.00 in 2012, showcasing increased valuation of smaller properties.
Property Size and Features
The 2013 market prioritized diversity and practicality in its property features:
- Bedrooms: Homes ranged from 2 to 7 bedrooms, averaging 4 bedrooms.
- Bathrooms: Properties offered 2 to 7 bathrooms, with an average of 4 bathrooms.
- Square Footage: Size spanned 1,346 sq. ft. to 7,232 sq. ft., averaging 3,886 sq. ft., slightly smaller than the previous year’s properties.
- Lot Sizes: Lots ranged from 0.34 acres to 14.56 acres, with an average of 2.011 acres, reflecting less focus on estate-sized properties compared to 2012.
Market Dynamics
Efficiency and improved pricing strategies defined Lucas’s real estate market in 2013:
- Average Days on Market (DOM): 77 days, shorter than the prior year, suggesting quicker turnovers.
- Median DOM: Homes frequently closed within 45 days, a significant improvement from the 70 days in 2012.
- ClsPr/LstPr Ratio: Sellers achieved 97.43% of listing prices, an efficiency boost from the 96.63% seen in 2012.
- ClsPr/OLP Ratio: Original listing prices aligned with 96.64% of final sale prices, a refinement in negotiation efficiency.
- Price per Square Foot: At $129.91, this indicated increased valuations and tighter ranges.
Insights into the Most Expensive Lucas, TX Property Sold in 2013
The most expensive property sold in Lucas, Texas during 2013 reflected a combination of premium features and exclusivity, despite being more modest compared to previous years. This remarkable home closed at $949,000 and was designed to cater to selective buyers looking for space, comfort, and location. Key details are provided below:
- Price: $949,000
- Beds/Baths: 3 bedrooms, 3 bathrooms (2 full, 1 half)
- Square Footage: 2,602 sq. ft.
- Price per Square Foot: $364.72
- Lot Size: 14.56 acres
- Days on Market (DOM): 248 days
- ClsPr/LstPr Ratio: 95.09%
- ClsPr/OLP Ratio: 95.09%
- Year Built: 1989
This home stood out for the quality it offered on a large lot, making it a significant marker of the 2013 market’s shift toward refined mid-tier luxury.
Economic context

Average Electricity Costs in Dallas-Fort Worth in 2013
Electricity prices increased to $0.12 per kilowatt-hour in 2013, compared to $0.11 in 2012. This slight rise might have led consumers to reassess their energy usage and consider more energy-efficient homes. Real estate agents likely saw growing interest in properties with features like modern insulation or smart energy systems, which could offset rising utility expenses.
Average Price for Regular Gasoline in Texas in 2013
Gas prices decreased to $3.32 per gallon in 2013, down slightly from $3.42 in 2012. This minor drop helped ease transportation costs for homebuyers. With slightly lower fuel expenses, potential buyers may have been more open to properties in suburban areas, especially if housing prices were more competitive than in urban locations.
Average 30-Year Fixed Mortgage Rate in 2013
Mortgage rates inched up to 4.16% in 2013 from 3.88% in the prior year. While the increase wasn’t drastic, it may have nudged some homebuyers to act sooner rather than later to secure financing. Homebuyers are encouraged to work with local mortgage loan originators to ensure they understand their borrowing capabilities and can lock in competitive rates with ease.
Curious about today’s mortgage rates and the home you can comfortably afford?
Submit a no-obligation mortgage application today and get pre-approved to determine your budget and take the first step toward homeownership with confidence.
Overview of Differences Between the 2012 and 2013 Real Estate Markets in Lucas, Texas
The comparison between Lucas’s real estate markets for 2012 and 2013 showcases a year of stabilization and subtle shifts, highlighting evolving property trends and buyer behavior:
Total Homes Sold
Sales volume remained consistent with 98 homes closed in both 2012 and 2013, suggesting a steady market demand.
Pricing Insights
- The minimum price decreased from $104,000 in 2012 to $93,410 in 2013, broadening entry-level affordability.
- The maximum price dropped significantly to $949,000, compared to $2,000,000 in 2012, indicating fewer ultra-high-end sales in 2013.
- The average price dipped slightly from $511,809 to $505,722, while the median price increased slightly to $507,000, reflecting stability within mid-tier segments.
- The price per square foot rose to $129.91, up from $125.00 in 2012, highlighting a trend of increased valuations despite lower maximum property prices.
Property Features
- Square footage decreased, with the largest home measuring 7,232 sq. ft. (down from 8,700 sq. ft. in 2012).
- The average square footage also dropped slightly to 3,886 sq. ft., reflecting demand for more moderately sized homes.
- Lot sizes became smaller on average, with a maximum of 14.56 acres in 2013, compared to 73 acres in 2012. This likely reflects a reduced emphasis on expansive estate properties.
Market Dynamics
- Days on Market (DOM): Homes sold faster in 2013, taking an average of 77 days, down from 100 days in 2012. The median DOM also improved dramatically to 45 days, signaling quicker transactions.
- ClsPr/LstPr Ratio: Sellers achieved 97.43% of listing prices, up from 96.63% in 2012, demonstrating improved market efficiency.
- ClsPr/OLP Ratio: Original listing price success increased to 96.64%, compared to 93.91% in 2012, highlighting fewer price reductions.
Notable Trends and Outliers
- Pool homes grew in popularity, rising to 39 in 2013, up from 36 the previous year, pointing to sustained demand for leisure amenities.
- New construction homes decreased slightly, with 14 builds in 2013, compared to 15 in 2012, continuing the trend of fewer, more specific developments.
- The most expensive property sold in 2013 was a $949,000 home on 14.56 acres, a significant shift from the luxury estate market’s $2,000,000 sale in 2012.
Economic Context
The mortgage rates increased slightly to 4.16%, up from 3.88% in 2012, potentially tempering higher-end market activity while maintaining overall market balance.
External cost factors, like a slight decrease in gas prices to $3.32, may have encouraged a shift in buyer preferences towards homes with moderate acreage and better proximity to conveniences.
Key Takeaway
The 2013 real estate market in Lucas, TX reflected a year of steadiness, marked by stabilized sales volumes, improving transaction efficiency, and rising property valuations. A shift away from large luxury estates to more moderately sized and priced homes highlighted changing preferences, while increasing demand for pool homes and efficient pricing strategies kept the market dynamic and appealing.
Summary of Real Estate Market Analysis for Lucas, TX in 2013
The 2013 real estate market in Lucas, Texas reflected a well-balanced and efficiently operating market, marked by consistent sales volume and evolving buyer preferences. Catering to a wide array of demands, the market provided opportunities for entry-level buyers through affordable pricing while also supporting mid-tier transactions with steady median values.
The presence of leisure amenities like pools and the trend toward practical, moderately-sized properties demonstrated the market’s adaptability to shifting priorities. Improving transaction efficiency, coupled with rising price per square foot valuations, further supported a healthy and dynamic market. Lucas’s ability to combine stability with diversity and growing demand underlines its continued appeal and potential for future resilience.
The Importance of Statistical Data in Lucas, Texas Real Estate Market
Did you know that appraisers and Realtors rely on historical statistical data to determine a property’s current value?
Analyzing historical market data is essential for making informed decisions in today’s real estate market. Examining past trends provides valuable insights that facilitate accurate pricing, more strategic negotiations, and a comprehensive understanding of market dynamics.
Unlock Exceptional Service!
Assistance with all your real estate needs in the Dallas-Fort Worth area is just a click or call away. Reach out at 214-940-8149 or connect through the links below.
Greetings! I’m Oleg Sedletsky, and I’m excited to introduce myself as your go-to full-time licensed Texas REALTOR® and Mortgage Loan Originator.
I proudly represent JPAR® – Real Estate Brokerage as a REALTOR® and Utopia Mortgage LLC as a Mortgage Loan Originator! My designations and certifications reflect my dedication to helping you achieve your real estate goals in Lucas, TX and other locations in the vibrant Dallas-Fort Worth area!
My commitment to ongoing professional development means I’m always enhancing my skills to serve you better. You can count on me as your trusted expert throughout your real estate journey. Plus, I’m fluent in English, Ukrainian, and Russian and ready to assist you every step of the way!
It’s All About You and Your Real Estate Goals!
My mission is to serve you! With my knowledge and expertise, I’m here to help you achieve all your real estate goals!
I’m passionate about helping buyers and sellers navigate the exciting real estate landscape in Lucas, Texas! Whether you’re searching for your dream home, exploring land options, or looking for commercial properties, my Real Estate Services have you covered.
Contact me today for all your real estate needs in Lucas, Texas! Call/text 214-940-8149
A Comprehensive Analysis of Single-Family Residential Housing Market in Lucas, TX: 2003 to Present
2003-2010
Lucas, TX Real Estate Market Report 2003: Analysis and Trends
Lucas, TX Real Estate Market Report 2004: Analysis and Trends
Lucas, TX Real Estate Market Report 2005: Analysis and Trends
Lucas, TX Real Estate Market Report 2006: Analysis and Trends
Lucas, TX Real Estate Market Report 2007: Analysis and Trends
Lucas, TX Real Estate Market Report 2008: Analysis and Trends
Lucas, TX Real Estate Market Report 2009: Analysis and Trends
Lucas, TX Real Estate Market Report 2010: Analysis and Trends
2011-2020
Lucas, TX Real Estate Market Report 2011: Analysis and Trends
Lucas, TX Real Estate Market Report 2012: Analysis and Trends
Lucas, TX Real Estate Market Report 2013: Analysis and Trends
Lucas, TX Real Estate Market Report 2014: Analysis and Trends
Lucas, TX Real Estate Market Report 2015: Analysis and Trends
Lucas, TX Real Estate Market Report 2016: Analysis and Trends
Lucas, TX Real Estate Market Report 2017: Analysis and Trends
Lucas, TX Real Estate Market Report 2018: Analysis and Trends
Lucas, TX Real Estate Market Report 2019: Analysis and Trends
Lucas, TX Real Estate Market Report 2020: Analysis and Trends
This market analysis is intended solely for educational purposes. This market analysis is based on data sourced from NTREIS, Inc. This analysis is exclusively focused on single-family homes and does not account for other property types. The total number of real estate transactions within the specified period and location may vary. Data accuracy cannot be guaranteed due to potential input errors made by NTREIS users. This market analysis does not account for all new construction home sales. If you need detailed information about recorded property sales or other public records, please contact the appropriate city or county office.

Lucas, TX Real Estate: A Comprehensive Analysis of the 2012 Single-Family Residential Housing Market
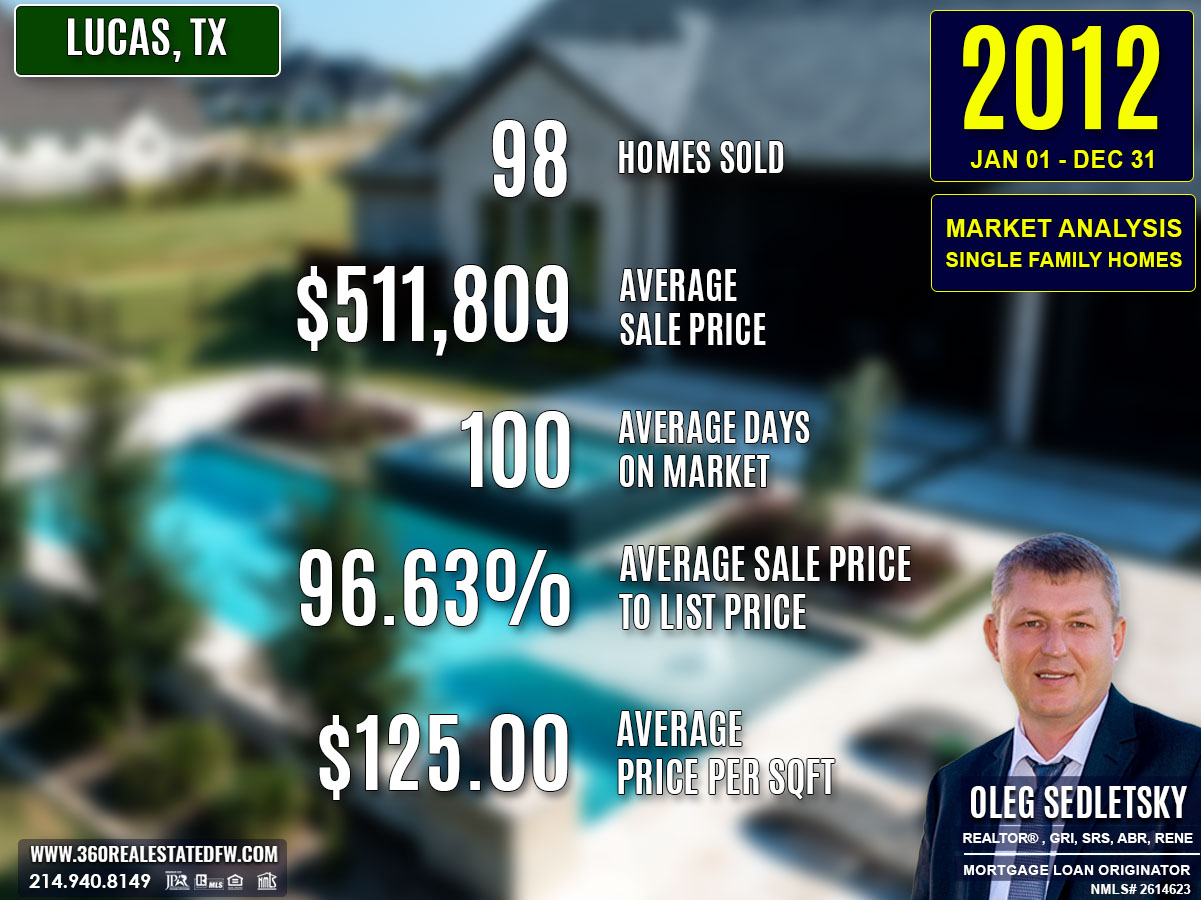
The 2012 real estate market in Lucas, Texas continued its trajectory of growth, with buyers capitalizing on diverse property options and favorable mortgage rates. A total of 98 homes closed, further confirming the market’s health and increasing buyer confidence. The market also showcased a broader spectrum of available properties, from affordable homes to ultra-luxury estates, catering to a wide range of buyers.
Key Takeaways and Trends from Lucas’s 2012 Real Estate Market
1. Pricing Range
- The market ranged from $104,000 to $2,000,000, reflecting both affordability and ultra-luxury appeal.
- Upward trends in the average price ($511,809) and median price ($492,500) indicated increased competition and strong mid-to-upper-tier sales.
- Price per Square Foot: An increase to $125.00 per sq. ft. marked stronger valuations, especially in high-end properties.
2. Market Efficiency
- DOM (100 days), while slightly slower than the prior year, supported steady sales activity.
- ClsPr/LstPr at 96.63% highlighted effective pricing strategies, balancing seller and buyer expectations.
3. Unique Outliers
- With 73-acre properties and homes up to 8,700 sq. ft., the rise in ultra-luxury sales and estate-sized properties emphasized a growing demand for grandeur and exclusivity.
- Pool homes surged to 36, reaffirming their importance as desirable features.
- A minor decrease in new construction sales (15 homes) suggested shifting developer focus to specialized, high-quality builds.
4. Mortgage Rates Impact
A drop in the average 30-year fixed mortgage rate to 3.88% gave buyers greater purchasing power. This decrease likely contributed to the increased activity in all market segments, from entry-level homes to top-tier luxury estates.
Total Homes Closed
The year saw 98 homes closed, reflecting higher transactional activity compared to the previous year. Among these, 36 homes featured pools, signaling growing demand for leisure-oriented amenities. A total of 15 new construction homes were sold, slightly fewer than the prior year, but still indicative of ongoing interest in modern builds with updated amenities.
Property Pricing Insights
Property pricing in 2012 highlighted strong growth and diversity:
- Minimum Price: $104,000, showing an increased affordability spectrum.
- Maximum Price: $2,000,000, doubling the previous year’s price cap and showcasing a new appetite for high-end luxury estates.
- Average Price: $511,809, reflecting a sharp increase from the prior year’s average, accompanying the rise in premium property transactions.
- Median Price: $492,500, a modest yet consistent rise, indicating demand for mid-tier properties.
- Price per Square Foot (Avg): $125.00, up from $113.83 in 2011, pointing to higher valuations and property upgrades.
Property Size and Features
Lucas’s real estate offerings in 2012 emphasized spacious living and feature-rich homes:
- Bedrooms: Properties ranged from 2 to 7 bedrooms, with an average of 4 bedrooms, maintaining variety.
- Bathrooms: Ranged from 2 to 7, averaging 4 bathrooms, catering to larger households.
- Square Footage: Size varied from 1,152 sq. ft. to 8,700 sq. ft., with an average of 4,010 sq. ft., underscoring demand for generous living spaces.
- Lot Size Area: The largest lots reached 73 acres, a significant jump from the prior year’s maximum of 7 acres, attracting buyers seeking estate-sized properties with vast outdoor potential.
Market Dynamics
Efficiency and negotiation strategies played a key role in the 2012 market, with data reflecting a largely healthy and competitive environment:
- Average Days on Market (DOM): 100 days, slightly higher than the previous year’s 96 days, but still an indicator of steady market activity.
- Median DOM: Homes typically closed within 70 days, maintaining consistency with median closings in 2011.
- ClsPr/LstPr Ratio: Sellers earned 96.63% of listing prices, slightly lower than in 2011, yet indicative of effective pricing strategies.
- ClsPr/OLP Ratio: Original price alignment averaged 93.91%, reflecting minor adjustments in seller expectations during negotiations.
- Price per Square Foot: Averaged $125.00, a step up from 2011, illustrating increased property valuations.
Insights into the Most Expensive Lucas, TX Property Sold in 2012
The most expensive property sold in Lucas, Texas during 2012 set a new benchmark for luxury and exclusivity, reflecting the growing appeal of high-end real estate. This exceptional property combined grandeur and spacious living, selling for $2,000,000. Below are the key metrics of this standout estate:
- Price: $2,000,000
- Beds/Baths: 6 bedrooms, 7 bathrooms (5 full, 2 half)
- Square Footage: 8,700 sq. ft.
- Price per Square Foot: $229.89
- Lot Size: 73 acres
- Days on Market (DOM): 326 days
- ClsPr/LstPr Ratio: 113.31%
- ClsPr/OLP Ratio: 105.54%
- Year Built: 1998
This property exemplified the market’s evolution and demand for estate-style living, offering unmatched size, luxury, and exclusivity in the region.
Economic context

Average Electricity Costs in Dallas-Fort Worth in 2012
Electricity prices remained steady at $0.11 per kilowatt-hour in 2012, unchanged from 2011. This stability helped maintain predictability in household budgets, supporting steady investment in real estate. homebuyers could better evaluate prospective homes based on fixed utility costs, encouraging confident decision-making.
Average Price for Regular Gasoline in Texas in 2012
Gas prices rose slightly to $3.42 per gallon in 2012, up from $3.37 in 2011. homebuyers continued to prioritize location and proximity to public transit or work, as elevated gas prices increased commuting expenses. Properties in walkable neighborhoods likely gained more attention during this period.
Average 30-Year Fixed Mortgage Rate in 2012
Mortgage rates dropped significantly to 3.88% in 2012, down from 4.65% the previous year. This marked a historic low that spurred homebuyer activity, particularly for those locking in long-term affordability. Pre-approvals through local mortgage loan originators became an invaluable step in maximizing homebuyer advantages amidst this rate decline.
Curious about today’s mortgage rates and the home you can comfortably afford?
Submit a no-obligation mortgage application today and get pre-approved to determine your budget and take the first step toward homeownership with confidence.
Overview of Differences Between the 2011 and 2012 Real Estate Markets in Lucas, Texas
Comparing Lucas’s real estate markets in 2011 and 2012 reveals notable growth and shifts showcasing evolving buyer behavior and market trends:
Total Homes Sold
Sales increased from 93 homes in 2011 to 98 homes in 2012, indicating higher buyer engagement.
Pricing Insights
- The minimum price dropped from $135,000 in 2011 to $104,000 in 2012, broadening affordability.
- The maximum price surged sharply to $2,000,000 in 2012, rising significantly from the previous year’s $1,000,000, reflecting a growing ultra-luxury segment.
- The average price rose from $432,717 in 2011 to $511,809 in 2012, while the median price increased to $492,500, signaling overall upward pressure in pricing.
- The price per square foot increased, with the average moving from $113.83 to $125.00, demonstrating stronger valuations.
Property Features
- Square footage expanded year-over-year, averaging 4,010 sq. ft. in 2012 compared to 3,770 sq. ft. in 2011.
- The largest properties also grew, with maximums reaching 8,700 sq. ft. in 2012 compared to 6,518 sq. ft. the previous year.
- Lot sizes exploded, with a maximum of 73 acres in 2012 compared to just 7 acres in 2011, offering larger estate-style options for luxury buyers.
Market Dynamics
- Days on Market (DOM): Homes sold at 100 days on average, slightly slower than 96 days in 2011, while the median DOM increased from 67 days to 70 days, reflecting slightly extended sales timelines.
- ClsPr/LstPr Ratio: Sellers achieved 96.63% of listing prices, compared to 97.11% in 2011, signifying stable negotiation success despite increasing prices.
- ClsPr/OLP Ratio: Original listing price efficiency fell slightly, averaging 93.91% in 2012, down from 94.67% in 2011, reflecting a slight increase in price adjustments during negotiations.
Notable Trends and Outliers
- Luxury home sales broke records with a $2,000,000 sale in 2012—a 100% increase from the prior year’s price ceiling.
- Pool homes surged to 36 in 2012, up from 27 in 2011, further highlighting the growing appeal of leisure amenities.
- New construction declined slightly, with 15 new builds recorded in 2012, compared to 25 in 2011.
Economic Factors
- A significant drop in average mortgage rates to 3.88% (from 4.65% in 2011) fueled market activity.
- External factors such as higher gas prices ($3.42 per gallon) may have influenced buyer preferences towards properties with convenient locations or energy-efficient features.
Key Takeaway
The 2012 market signaled robust growth with heightened demand for luxury and leisure properties, balanced by affordability options. The continued expansion in size and price diversity underscored Lucas’s adaptability to evolving buyer priorities.
Summary of Real Estate Market Analysis for Lucas, TX in 2012
The 2012 real estate market in Lucas, Texas demonstrated robust growth, expanding its reach to cater to diverse buyer needs and preferences. With transactions ranging from entry-level homes to record-breaking luxury estates, the market seamlessly balanced affordability with high-end exclusivity. Increased property sizes, higher valuations, and the inclusion of leisure amenities like pools highlighted Lucas’s adaptability to evolving trends.
Despite slightly extended timelines, competitive pricing strategies and favorable mortgage rates underscored the year’s market efficiency. This convergence of opportunity, variety, and steady performance firmly established Lucas, TX as a dynamic and thriving real estate market poised for sustained growth and appeal.
The Importance of Statistical Data in Lucas, Texas Real Estate Market
Did you know that appraisers and Realtors rely on historical statistical data to determine a property’s current value?
Analyzing historical market data is essential for making informed decisions in today’s real estate market. Examining past trends provides valuable insights that facilitate accurate pricing, more strategic negotiations, and a comprehensive understanding of market dynamics.
Unlock Exceptional Service!
Assistance with all your real estate needs in the Dallas-Fort Worth area is just a click or call away. Reach out at 214-940-8149 or connect through the links below.
Greetings! I’m Oleg Sedletsky, and I’m excited to introduce myself as your go-to full-time licensed Texas REALTOR® and Mortgage Loan Originator.
I proudly represent JPAR® – Real Estate Brokerage as a REALTOR® and Utopia Mortgage LLC as a Mortgage Loan Originator! My designations and certifications reflect my dedication to helping you achieve your real estate goals in Lucas, TX and other locations in the vibrant Dallas-Fort Worth area!
My commitment to ongoing professional development means I’m always enhancing my skills to serve you better. You can count on me as your trusted expert throughout your real estate journey. Plus, I’m fluent in English, Ukrainian, and Russian and ready to assist you every step of the way!
It’s All About You and Your Real Estate Goals!
My mission is to serve you! With my knowledge and expertise, I’m here to help you achieve all your real estate goals!
I’m passionate about helping buyers and sellers navigate the exciting real estate landscape in Lucas, Texas! Whether you’re searching for your dream home, exploring land options, or looking for commercial properties, my Real Estate Services have you covered.
Contact me today for all your real estate needs in Lucas, Texas! Call/text 214-940-8149
A Comprehensive Analysis of Single-Family Residential Housing Market in Lucas, TX: 2003 to Present
2003-2010
Lucas, TX Real Estate Market Report 2003: Analysis and Trends
Lucas, TX Real Estate Market Report 2004: Analysis and Trends
Lucas, TX Real Estate Market Report 2005: Analysis and Trends
Lucas, TX Real Estate Market Report 2006: Analysis and Trends
Lucas, TX Real Estate Market Report 2007: Analysis and Trends
Lucas, TX Real Estate Market Report 2008: Analysis and Trends
Lucas, TX Real Estate Market Report 2009: Analysis and Trends
Lucas, TX Real Estate Market Report 2010: Analysis and Trends
2011-2020
Lucas, TX Real Estate Market Report 2011: Analysis and Trends
Lucas, TX Real Estate Market Report 2012: Analysis and Trends
Lucas, TX Real Estate Market Report 2013: Analysis and Trends
Lucas, TX Real Estate Market Report 2014: Analysis and Trends
Lucas, TX Real Estate Market Report 2015: Analysis and Trends
Lucas, TX Real Estate Market Report 2016: Analysis and Trends
Lucas, TX Real Estate Market Report 2017: Analysis and Trends
Lucas, TX Real Estate Market Report 2018: Analysis and Trends
Lucas, TX Real Estate Market Report 2019: Analysis and Trends
Lucas, TX Real Estate Market Report 2020: Analysis and Trends
This market analysis is intended solely for educational purposes. This market analysis is based on data sourced from NTREIS, Inc. This analysis is exclusively focused on single-family homes and does not account for other property types. The total number of real estate transactions within the specified period and location may vary. Data accuracy cannot be guaranteed due to potential input errors made by NTREIS users. This market analysis does not account for all new construction home sales. If you need detailed information about recorded property sales or other public records, please contact the appropriate city or county office.

Lucas, TX Real Estate: A Comprehensive Analysis of the 2011 Single-Family Residential Housing Market
The 2011 real estate market in Lucas, Texas showed significant improvement in buyer activity, delivering an increase in property transactions and a stronger market balance. With 93 homes sold, the year marked a rebound from prior levels of activity. Bolstered by increased builder confidence, demand for leisure-oriented properties, and favorable mortgage rates, the market presented diverse options for buyers, ranging from affordable homes to ultra-luxury estates.
Key Takeaways and Trends from Lucas’s 2011 Real Estate Market
1. Pricing Range
- The pricing range widened in 2011, with entry-level homes starting at $135,000 and luxury properties reaching $1,000,000, a significant uptick from 2010’s price cap of $765,000.
- Consistent average ($432,717) and median prices ($435,000) reflected stability in mid-tier property demand.
- The slight dip in price per square foot ($113.83) suggested increased affordability with greater transactions.
2. Market Efficiency
- Homes sold faster in 2011, with 96 days average DOM, down from 114 days in 2010. Median DOM followed a similar improvement, down to 67 days.
- Sellers achieved better close-to-listed price ratios, with a ClsPr/LstPr of 97.11%, pointing to an efficient and confident market.
3. Unique Outliers
- The standout sale at $1,000,000 marked a return to ultra-luxury transactions, paired with increased pool homes (27) and new builds (25) demand.
- Larger properties, both in lot size (up to 7 acres) and interior space (up to 6,518 sq. ft.), met growing demand for luxury amenities.
4. Mortgage Rates Impact
The average 30-year fixed mortgage rate of 4.65% provided more affordable financing, encouraging increased buyer participation.
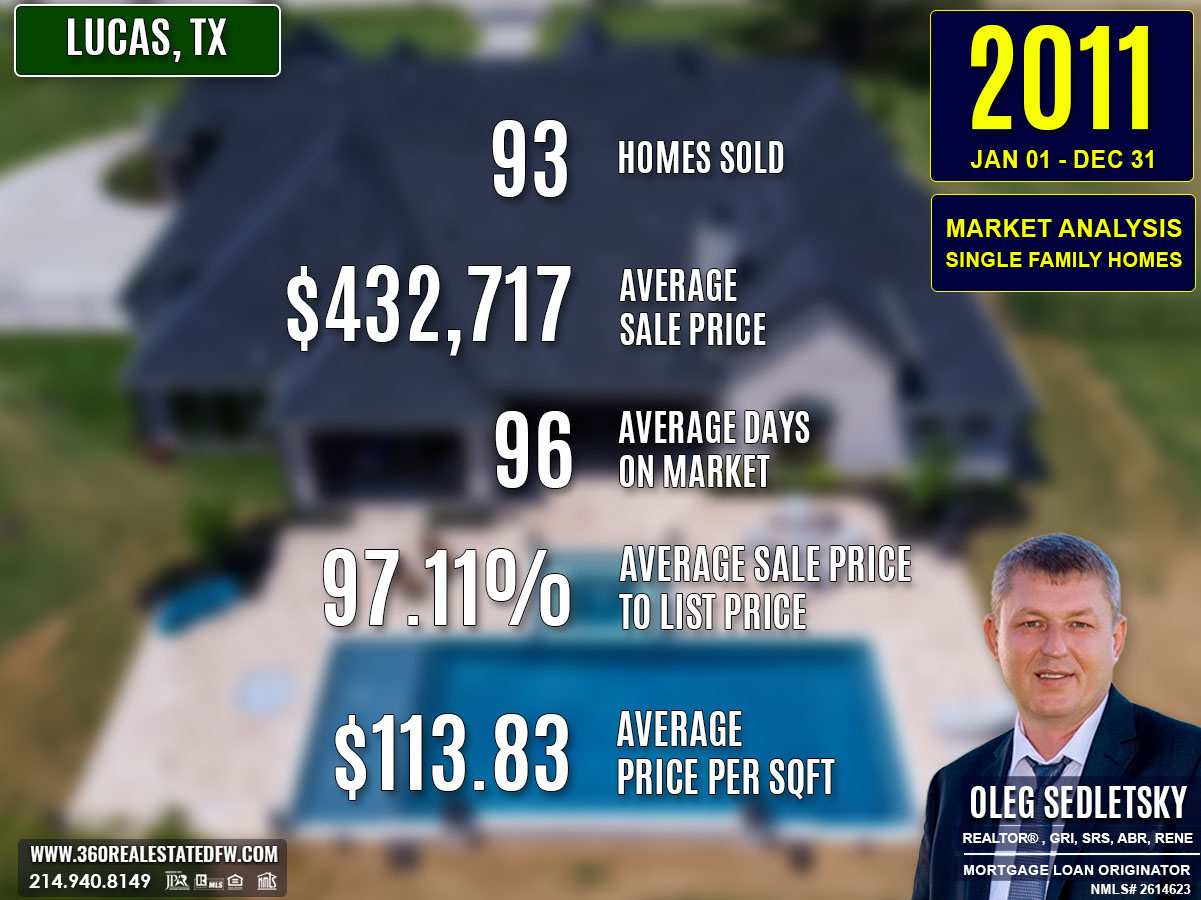
Total Homes Closed
A total of 93 homes closed in 2011, highlighting a surge in market activity compared to 2010. Of these, 27 featured pools, indicating higher demand for leisure-enhancing properties. Additionally, 25 newly constructed homes catered to buyers seeking modern amenities, reflecting a rise in builder confidence.
Property Pricing Insights
Property pricing in 2011 showed a balanced market catering to a range of budgets:
- Minimum Price: $135,000 (a slight decrease from 2010).
- Maximum Price: $1,000,000 (a sharp increase compared to 2010’s top price of $765,000).
- Average Price: $432,717 (maintaining similar levels to 2010).
- Median Price: $435,000 (a modest increase from $427,750 in 2010).
The consistent average and median prices underline steady demand and confidence in property value.
Property Size and Features
The 2011 market showcased variety in property size and features, appealing to a broad spectrum of buyers:
- Bedrooms: Properties ranged from 2 to 6 bedrooms, averaging 4 bedrooms.
- Bathrooms: Homes featured 2 to 7 bathrooms, with an average of 4 bathrooms.
- Square Footage: Sizes ranged from 1,174 sq. ft. to 6,518 sq. ft., with an average size of 3,770 sq. ft., reflecting buyer interest in spacious living spaces.
- Lot Sizes: Ranged from 0.34 acres to 7 acres, averaging 1.877 acres, accommodating buyers seeking larger lots and outdoor spaces.
Market Dynamics
The 2011 market demonstrated improved efficiency and stronger alignment between listing and closing prices:
- Days on Market (DOM): Average DOM dropped to 96 days, compared to 114 days in 2010, indicating faster sales. The median DOM further improved, falling to 67 days from 74 days in the prior year.
- ClsPr/LstPr Ratio: Sellers achieved 97.11% of listing prices, up from 96.30% in 2010, showcasing enhanced pricing accuracy.
- ClsPr/OLP Ratio: Original listing prices were met 94.67% of the time, reflecting improved seller expectations and buyer price alignment.
- Average Price per Square Foot: Declined slightly to $113.83, from $115.94 in 2010, pointing to market stabilization with increased property supply.
Insights into the Most Expensive Lucas, TX Property Sold in 2011
The most expensive property sold in Lucas during 2011 showcased luxury and expansive living, setting a high bar for the market. This stunning estate captured attention with its spacious design and prime location, closing at $1,000,000.
Below are the key details of this remarkable property:
- Price: $1,000,000
- Beds/Baths: 6 bedrooms, 7 bathrooms (6 full, 1 half)
- Square Footage: 6,518 sq. ft.
- Price per Square Foot: $153.42
- Lot Size: 2.610 acres
- Days on Market (DOM): 99 days
- ClsPr/LstPr Ratio: 83.40%
- ClsPr/OLP Ratio: 83.40%
- Year Built: 1998
This home represented the renewed strength of the high-end market, blending luxury finishes and expansive living space with strong demand for premium real estate.
Economic context

Average Electricity Costs in Dallas-Fort Worth in 2011
Electricity prices dipped again to $0.11 per kilowatt-hour in 2011, down from $0.12 in 2010. This slight drop continued to help households manage their budgets with more flexibility for discretionary spending or home-related investments. The lower cost of utilities could boost the appeal of larger homes that might otherwise consume more electricity.
Average Price for Regular Gasoline in Texas in 2011
Gas prices rose noticeably to $3.37 per gallon in 2011, up from $2.64 in 2010. The steep increase likely caused homebuyers to favor properties closer to work or transit hubs. homebuyers in suburban or rural areas likely faced greater challenges due to higher commuting costs.
Average 30-Year Fixed Mortgage Rate in 2011
Mortgage rates dropped further to 4.65% in 2011 from 4.86% in the prior year. This ongoing trend of declining rates supported affordability and encouraged activity among homebuyers. First-time buyers were reminded to get pre-approved through local mortgage loan originators to better understand their purchasing power.
Curious about today’s mortgage rates and the home you can comfortably afford?
Submit a no-obligation mortgage application today and get pre-approved to determine your budget and take the first step toward homeownership with confidence.
Overview of Differences Between the 2010 and 2011 Real Estate Markets in Lucas, Texas
The comparison between Lucas’s real estate markets for 2010 and 2011 unveils notable changes, reflecting both growth and evolving buyer preferences:
Total Homes Closed
Sales volumes increased significantly from 68 homes in 2010 to 93 homes in 2011, signaling renewed buyer activity and interest.
Pricing Insights
- The minimum price dipped from $144,000 in 2010 to $135,000 in 2011, offering broader affordability.
- The maximum price surged to $1,000,000 in 2011, a marked rise from 2010’s top price of $765,000, reintroducing ultra-luxury sales to the market.
- The average price remained steady, shifting just slightly from $434,220 in 2010 to $432,717 in 2011.
- The median price showed a small increase from $427,750 to $435,000, indicating consistency in mid-tier property performance.
Property Features
- Homes built in 2011 offered a wider variety of options, with bedrooms ranging from 2 to 6 (compared to 3 to 6 in 2010).
- Bathrooms increased in scale, peaking at 7 baths in 2011, up from a maximum of 6 in 2010.
- Homes were slightly larger in square footage, averaging 3,770 sq. ft., versus 3,768 sq. ft. in 2010, with top sizes reaching 6,518 sq. ft., an increase from 2010’s maximum of 5,910 sq. ft.
- Lot sizes expanded in range, with a maximum of 7 acres in 2011 compared to 5.316 acres the year prior, catering to buyers seeking more space.
Market Dynamics
- Homes in 2011 sold faster, with the average Days on Market (DOM) dropping to 96 days, an improvement from 114 days in 2010. The median DOM shifted from 74 days in 2010 to 67 days in 2011, signaling improved market efficiency.
- Sellers achieved higher pricing precision, with the ClsPr/LstPr ratio rising to 97.11% from 96.30%, and the ClsPr/OLP ratio climbing to 94.67%, up from 92.83% in 2010.
- Price per Square Foot fell slightly to $113.83 in 2011, compared to $115.94 in 2010, indicating stabilization in property valuations as inventory increased.
Outliers and Trends
- The number of pool homes rebounded to 27 in 2011, up from 20 in 2010, reflecting renewed interest in homes with leisure amenities.
- New construction homes saw an uptick, increasing to 25 in 2011 from 19 the previous year, showing improved confidence among builders.
- The most expensive sale in 2011 was valued at $1,000,000, sharply higher than the $765,000 peak price in 2010. This 6-bedroom, 7-bath luxury home on 2.610 acres embodied the resurgence of high-end transactions.
Economic Context
- Average mortgage rates declined further to 4.65%, down from 4.86% in 2010, boosting affordability for buyers.
- External economic factors, such as increased gas prices at $3.37 per gallon, may have influenced buyer preferences for centrally located or energy-efficient homes.
Key Takeaway
The 2011 real estate market in Lucas, TX, rebounded with increased sales, faster closings, and a resurgence in ultra-luxury property offerings. While pricing remained steady overall, the improved market dynamics and diversity in property types indicated a healthy and thriving market environment.
Summary of Real Estate Market Analysis for Lucas, TX in 2011
The 2011 real estate market in Lucas, Texas showcased strong recovery and adaptability, combining increased sales, diverse property options, and efficient pricing. With transactions surging to 93 closed sales, the year emphasized the market’s ability to cater to a broad buyer spectrum, from affordable entry-level homes to ultra-luxury estates.
The return of high-end sales, renewed focus on leisure properties like pool homes, and a rise in new constructions highlighted the market’s evolving dynamics and buyer confidence. Shortened sales timelines and higher close-to-list price ratios underscored greater efficiency and alignment between buyers and sellers. Supported by historically low mortgage rates, Lucas’s 2011 market not only rebounded but set the stage for sustainable growth and continued appeal for future markets.
The Importance of Statistical Data in Lucas, Texas Real Estate Market
Did you know that appraisers and Realtors rely on historical statistical data to determine a property’s current value?
Analyzing historical market data is essential for making informed decisions in today’s real estate market. Examining past trends provides valuable insights that facilitate accurate pricing, more strategic negotiations, and a comprehensive understanding of market dynamics.
Unlock Exceptional Service!
Assistance with all your real estate needs in the Dallas-Fort Worth area is just a click or call away. Reach out at 214-940-8149 or connect through the links below.
Greetings! I’m Oleg Sedletsky, and I’m excited to introduce myself as your go-to full-time licensed Texas REALTOR® and Mortgage Loan Originator.
I proudly represent JPAR® – Real Estate Brokerage as a REALTOR® and Utopia Mortgage LLC as a Mortgage Loan Originator! My designations and certifications reflect my dedication to helping you achieve your real estate goals in Lucas, TX and other locations in the vibrant Dallas-Fort Worth area!
My commitment to ongoing professional development means I’m always enhancing my skills to serve you better. You can count on me as your trusted expert throughout your real estate journey. Plus, I’m fluent in English, Ukrainian, and Russian and ready to assist you every step of the way!
It’s All About You and Your Real Estate Goals!
My mission is to serve you! With my knowledge and expertise, I’m here to help you achieve all your real estate goals!
I’m passionate about helping buyers and sellers navigate the exciting real estate landscape in Lucas, Texas! Whether you’re searching for your dream home, exploring land options, or looking for commercial properties, my Real Estate Services have you covered.
Contact me today for all your real estate needs in Lucas, Texas! Call/text 214-940-8149
A Comprehensive Analysis of Single-Family Residential Housing Market in Lucas, TX: 2003 to Present
2003-2010
Lucas, TX Real Estate Market Report 2003: Analysis and Trends
Lucas, TX Real Estate Market Report 2004: Analysis and Trends
Lucas, TX Real Estate Market Report 2005: Analysis and Trends
Lucas, TX Real Estate Market Report 2006: Analysis and Trends
Lucas, TX Real Estate Market Report 2007: Analysis and Trends
Lucas, TX Real Estate Market Report 2008: Analysis and Trends
Lucas, TX Real Estate Market Report 2009: Analysis and Trends
Lucas, TX Real Estate Market Report 2010: Analysis and Trends
2011-2020
Lucas, TX Real Estate Market Report 2011: Analysis and Trends
Lucas, TX Real Estate Market Report 2012: Analysis and Trends
Lucas, TX Real Estate Market Report 2013: Analysis and Trends
Lucas, TX Real Estate Market Report 2014: Analysis and Trends
Lucas, TX Real Estate Market Report 2015: Analysis and Trends
Lucas, TX Real Estate Market Report 2016: Analysis and Trends
Lucas, TX Real Estate Market Report 2017: Analysis and Trends
Lucas, TX Real Estate Market Report 2018: Analysis and Trends
Lucas, TX Real Estate Market Report 2019: Analysis and Trends
Lucas, TX Real Estate Market Report 2020: Analysis and Trends
This market analysis is intended solely for educational purposes. This market analysis is based on data sourced from NTREIS, Inc. This analysis is exclusively focused on single-family homes and does not account for other property types. The total number of real estate transactions within the specified period and location may vary. Data accuracy cannot be guaranteed due to potential input errors made by NTREIS users. This market analysis does not account for all new construction home sales. If you need detailed information about recorded property sales or other public records, please contact the appropriate city or county office.
Lucas, TX Real Estate: A Comprehensive Analysis of the 2010 Single-Family Residential Housing Market
In 2010, real estate market in Lucas, Texas underwent a modest contraction, with 68 homes closed. Despite this decline from previous years, the market maintained a steady focus on mid-to-upper-tier properties, appealing to buyers seeking spacious layouts and affordability. While activity from developers and buyers slightly slowed, market efficiency and balanced pricing ensured resilience.
Key Takeaways and Trends from Lucas’s 2010 Real Estate Market
Pricing Range:
- The market offered homes ranging from $144,000 to $765,000, with a noticeable decrease in the luxury market cap.
- Both average price ($434,220) and median price ($427,750) saw increases, suggesting strength in mid-to-upper-middle properties.
Price per Square Foot: Beyond individual price growth, the average of $115.94 per sq. ft. reflects consistent buyer value perception.
Market Efficiency: Homes took longer to sell on average (114 days DOM) compared to the prior year. However, competitive mid-tier properties maintained shorter sales cycles. Sellers achieved 96.30% of listing prices, showing strong alignment with market conditions.
Unique Outliers:
- The most expensive home sold for $765,000, indicating a decrease in ultra-luxury transactions compared to 2009’s peak of $870,000.
- The number of pool homes fell to 20, showing reduced demand for leisure features.
- New constructions declined to 19 homes, down from 27 the year before, reflecting a cautious approach from developers.
Mortgage Rates Impact: Mortgage rates dropped further to 4.86%, making financing more accessible and likely supporting affordability and buyer confidence in the mid-tier segment.
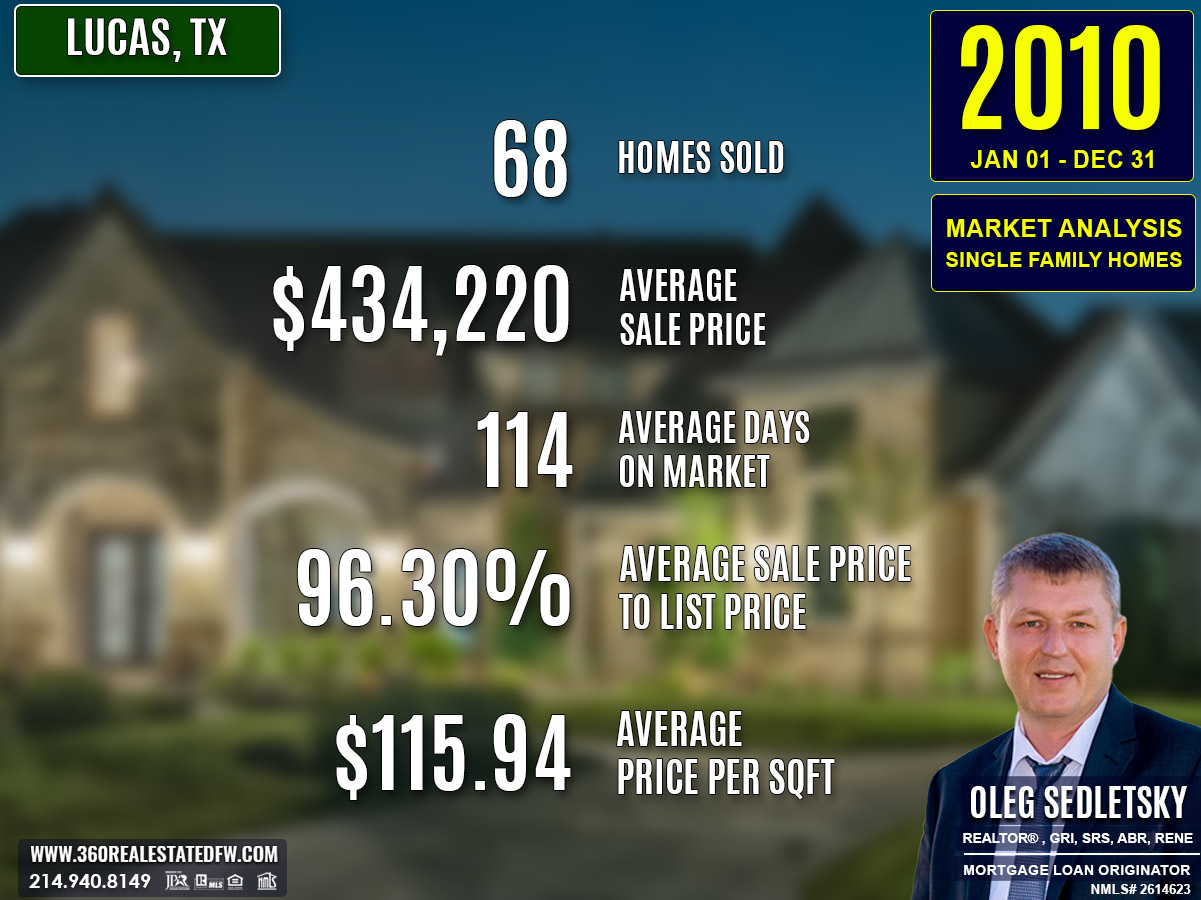
Total Homes Closed
A total of 68 homes closed during 2010, reflecting a decrease in transaction volume compared to 2009. Of these, 19 were new constructed homes, indicating some developer presence, albeit lesser than the prior year. Furthermore, 20 homes included pools, showcasing continued interest in leisure-focused amenities.
Property Pricing Insights
The pricing range in 2010 reflected a market catering to various buyer tiers. Key insights include:
- Minimum Price: $144,000 (slightly lower than 2009).
- Maximum Price: $765,000 (a drop from the $870,000 peak in 2009).
- Average Price: $434,220 (a rise compared to $408,511 in 2009).
- Median Price: $427,750 (a jump from $402,500 in 2009).
The upward shifts in average and median pricing highlighted steady interest in mid-tier and upper-middle-tier homes, despite fewer ultra-luxury transactions.
Property Size and Features
Properties in 2010 offered variety and continued to attract buyers looking for comfort and space:
- Bedrooms: Ranged from 3 to 6 bedrooms, with an average of 4 bedrooms.
- Bathrooms: Spanned 2 to 6, with an average of 4 bathrooms.
- Square Footage: Sizes ranged between 1,626 sq. ft. and 5,910 sq. ft., averaging 3,768 sq. ft., slightly higher than 2009.
- Lot Sizes: Lot areas extended from 0.5 acres to 5.316 acres, with an average of 1.886 acres, signaling a preference for spacious living environments.
Market Dynamics
The year showed some slower activity, but sellers adjusted well to price expectations:
- Average Days on Market (DOM): Homes sold after an average of 114 days, up from 105 days in 2009. However, the median DOM of 74 days indicates faster sales in more competitively priced segments.
- ClsPr/LstPr Ratio: Sellers achieved an average of 96.30% of the listing price, consistent with 2009 performance.
- ClsPr/OLP Ratio: Original listing prices were met 92.83% of the time, signifying slightly less room for negotiation compared to 91.68% in 2009.
- Price per Square Foot: The average rose to $115.94, up from $109.82 in 2009, reflecting slight property value adjustments.
Insights into the Most Expensive Lucas, TX Property Sold in 2010
The most expensive property sold in Lucas during 2010 was an extraordinary home that underscored the appeal of premium real estate in the area. This stunning property offered a harmonious blend of space, comfort, and luxury, attracting a notable sale price of $765,000.
Below are the key details of this standout transaction:
- Price: $765,000
- Beds/Baths: 5 bedrooms, 5 bathrooms (4 full, 1 half)
- Square Footage: 5,910 sq. ft.
- Price per Square Foot: $129.44
- Lot Size: 1.790 acres
- Days on Market (DOM): 159 days
- ClsPr/LstPr Ratio: 95.64%
- ClsPr/OLP Ratio: 90.00%
- Year Built: 2005
This property’s spacious floor plan, extensive lot size, and modern design exemplified the enduring demand for premium homes, even in a cautious market.
Economic context
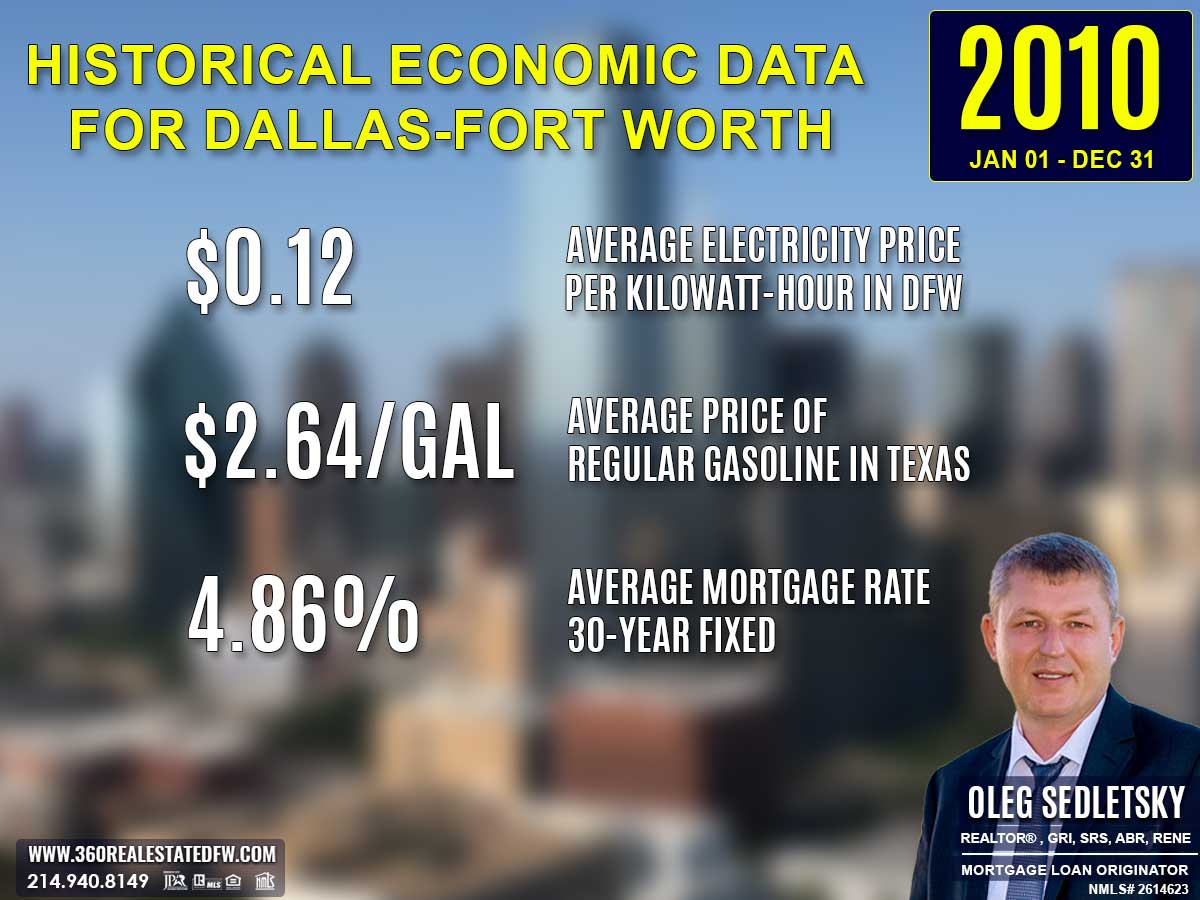
Average Electricity Costs in Dallas-Fort Worth in 2010
Electricity costs decreased further to $0.12 per kilowatt-hour in 2010, down from $0.13 in 2009. The drop allowed households to manage monthly budgets a bit more effectively. For real estate, affordability in utility costs could make energy-conscious homes an easier sell, particularly as homebuyers explored long-term cost savings.
Average Price for Regular Gasoline in Texas in 2010
Gasoline prices rebounded slightly, averaging $2.64 per gallon in 2010, compared to $2.21 in 2009. The rise in fuel costs likely pushed many homebuyers to evaluate commute expenses alongside their home budgets. Urban areas and transit-centered communities may have seen increased interest as reliable transport options became a key factor.
Average 30-Year Fixed Mortgage Rate in 2010
Mortgage rates declined further to 4.86% in 2010, offering favorable conditions for potential homebuyers. This drop made monthly payments more manageable and contributed to a gradual recovery in the housing market. Pre-approvals with local mortgage loan originators were essential for homebuyers to confidently pursue homes in competitive markets.
Curious about today’s mortgage rates and the home you can comfortably afford?
Submit a no-obligation mortgage application today and get pre-approved to determine your budget and take the first step toward homeownership with confidence.
Overview of Differences Between the 2009 and 2010 Real Estate Markets in Lucas, Texas
The comparison between Lucas’s 2009 and 2010 real estate markets illustrates slight market shifts and evolving dynamics. Here are the most notable differences:
Total Homes Closed
The number of homes sold dropped from 83 in 2009 to 68 in 2010, indicating reduced activity in the market.
Pricing Insights
- The minimum price decreased slightly, from $150,000 in 2009 to $144,000 in 2010, reflecting a broader range of affordability.
- The maximum price also saw a decrease, dropping from $870,000 in 2009 to $765,000 in 2010, with fewer luxury sales.
- The average price rose to $434,220, up from $408,511, reflecting demand for mid-to-upper-tier properties.
- The median price increased from $402,500 to $427,750, highlighting the upward trend for mid-tier home values.
Property Features
- The size of homes shifted slightly, with the total square footage averaging 3,768 sq. ft. compared to 3,697 sq. ft. in 2009.
- Lot sizes marginally increased, with an average of 1.886 acres in 2010, as opposed to 1.771 acres in 2009. Larger lots made homes more appealing to space-seeking buyers.
Market Dynamics
- Homes took longer to sell in 2010, with the average Days on Market (DOM) rising to 114 days, up from 105 days in 2009, possibly indicating cautious buyers or reduced urgency in transactions.
- The Close Price to Listing Price (ClsPr/LstPr) Ratio remained steady at 96.30%, a slight improvement from 96.23% in 2009, reflecting effective listing strategies.
- However, the ClsPr to Original Listing Price (ClsPr/OLP) Ratio improved to 92.83%, signaling slightly less negotiation room compared to 91.68% in 2009.
Outliers and Trends
- The most expensive property sold in 2010 was priced at $765,000, lower than 2009’s top sale of $870,000, highlighting a shift away from ultra-luxury sales.
- The number of pool homes dropped from 26 in 2009 to 20 in 2010, indicating shifting buyer priorities.
- New construction homes also declined, with 19 homes in 2010, compared to 27 in 2009, suggesting slowed activity from builders.
Economic Context
Mortgage rates declined further to 4.86% in 2010 (from 5.38% in 2009), potentially bolstering affordability, even as the market experienced a contraction in activity.
Key Takeaway
Lucas’s real estate market in 2010 reflected a decline in activity but steadied its focus on mid-to-upper-tier properties, balancing affordability with spaciousness. Longer time on the market and fewer high-end sales pointed to a cautious, buyer-driven market landscape.
Summary of Real Estate Market Analysis for Lucas, TX in 2010
The 2010 real estate market in Lucas, Texas reflected a period of adjustment and cautious progression, with a decreased number of transactions but consistent focus on mid-to-upper-tier properties. Despite the slower activity, the market maintained a reputation for diversity and balance, offering spacious layouts, modern features, and various price points to appeal to a wide range of buyers. The continued interest in newly constructed homes and pool properties demonstrated the value placed on quality amenities, while the rise in average and median prices showcased enduring confidence in property values.
With mortgage rates hitting new lows at 4.86%, affordability remained a key driver, supporting market engagement even amid challenges. Lucas’s 2010 market once again underscored its adaptability and potential to thrive in changing conditions, leaving a foundation for sustained growth and opportunity.
The Importance of Statistical Data in Lucas, Texas Real Estate Market
Did you know that appraisers and Realtors rely on historical statistical data to determine a property’s current value?
Analyzing historical market data is essential for making informed decisions in today’s real estate market. Examining past trends provides valuable insights that facilitate accurate pricing, more strategic negotiations, and a comprehensive understanding of market dynamics.
Unlock Exceptional Service!
Assistance with all your real estate needs in the Dallas-Fort Worth area is just a click or call away. Reach out at 214-940-8149 or connect through the links below.
Greetings! I’m Oleg Sedletsky, and I’m excited to introduce myself as your go-to full-time licensed Texas REALTOR® and Mortgage Loan Originator.
I proudly represent JPAR® – Real Estate Brokerage as a REALTOR® and Utopia Mortgage LLC as a Mortgage Loan Originator! My designations and certifications reflect my dedication to helping you achieve your real estate goals in Lucas, TX and other locations in the vibrant Dallas-Fort Worth area!
My commitment to ongoing professional development means I’m always enhancing my skills to serve you better. You can count on me as your trusted expert throughout your real estate journey. Plus, I’m fluent in English, Ukrainian, and Russian and ready to assist you every step of the way!
It’s All About You and Your Real Estate Goals!
My mission is to serve you! With my knowledge and expertise, I’m here to help you achieve all your real estate goals!
I’m passionate about helping buyers and sellers navigate the exciting real estate landscape in Lucas, Texas! Whether you’re searching for your dream home, exploring land options, or looking for commercial properties, my Real Estate Services have you covered.
Contact me today for all your real estate needs in Lucas, Texas! Call/text 214-940-8149
A Comprehensive Analysis of Single-Family Residential Housing Market in Lucas, TX: 2003 to Present
2003-2010
Lucas, TX Real Estate Market Report 2003: Analysis and Trends
Lucas, TX Real Estate Market Report 2004: Analysis and Trends
Lucas, TX Real Estate Market Report 2005: Analysis and Trends
Lucas, TX Real Estate Market Report 2006: Analysis and Trends
Lucas, TX Real Estate Market Report 2007: Analysis and Trends
Lucas, TX Real Estate Market Report 2008: Analysis and Trends
Lucas, TX Real Estate Market Report 2009: Analysis and Trends
Lucas, TX Real Estate Market Report 2010: Analysis and Trends
2011-2020
Lucas, TX Real Estate Market Report 2011: Analysis and Trends
Lucas, TX Real Estate Market Report 2012: Analysis and Trends
Lucas, TX Real Estate Market Report 2013: Analysis and Trends
Lucas, TX Real Estate Market Report 2014: Analysis and Trends
Lucas, TX Real Estate Market Report 2015: Analysis and Trends
Lucas, TX Real Estate Market Report 2016: Analysis and Trends
Lucas, TX Real Estate Market Report 2017: Analysis and Trends
Lucas, TX Real Estate Market Report 2018: Analysis and Trends
Lucas, TX Real Estate Market Report 2019: Analysis and Trends
Lucas, TX Real Estate Market Report 2020: Analysis and Trends
This market analysis is intended solely for educational purposes. This market analysis is based on data sourced from NTREIS, Inc. This analysis is exclusively focused on single-family homes and does not account for other property types. The total number of real estate transactions within the specified period and location may vary. Data accuracy cannot be guaranteed due to potential input errors made by NTREIS users. This market analysis does not account for all new construction home sales. If you need detailed information about recorded property sales or other public records, please contact the appropriate city or county office.
Lucas, TX Real Estate: A Comprehensive Analysis of the 2009 Single-Family Residential Housing Market
The 2009 real estate market in Lucas, TX continued to perform steadily with consistent buyer activity. With 83 homes closed, the market demonstrated healthy interest in a range of properties, from affordable to upscale. Builders remained active as 27 new construction homes entered the market, and 26 homes with pools reflected ongoing demand for leisure-centric features.
Key Takeaways and Trends from Lucas’s 2009 Real Estate Market
Pricing Range: The market catered to a broad spectrum of buyers, with prices spanning $150,000 to $870,000, although the peak price was lower than in 2008. The average price increased to $408,511, signifying a balanced demand for mid-tier properties.
Market Efficiency: Homes sold faster in 2009, with an average 105 days on market compared to 124 days in the prior year. ClsPr/LstPr ratios remained healthy at 96.23%, indicating sellers aligned well with market expectations, though negotiation margins slightly widened.
Unique Outliers:
- The most expensive 2009 property featured 5,624 sq. ft. on 2.184 acres, showing a preference for spacious layouts in upscale transactions.
- The number of pool homes rebounded to 26, highlighting the value of leisure-driven amenities.
- New construction homes surged to 27 properties, reflecting increased building activity and demand for modern features.
Mortgage Rates Impact: The average mortgage rate fell to 5.38%, from 6.23% in 2008, likely supporting affordability and sustaining mid-tier home sales, even with broader economic pressures.
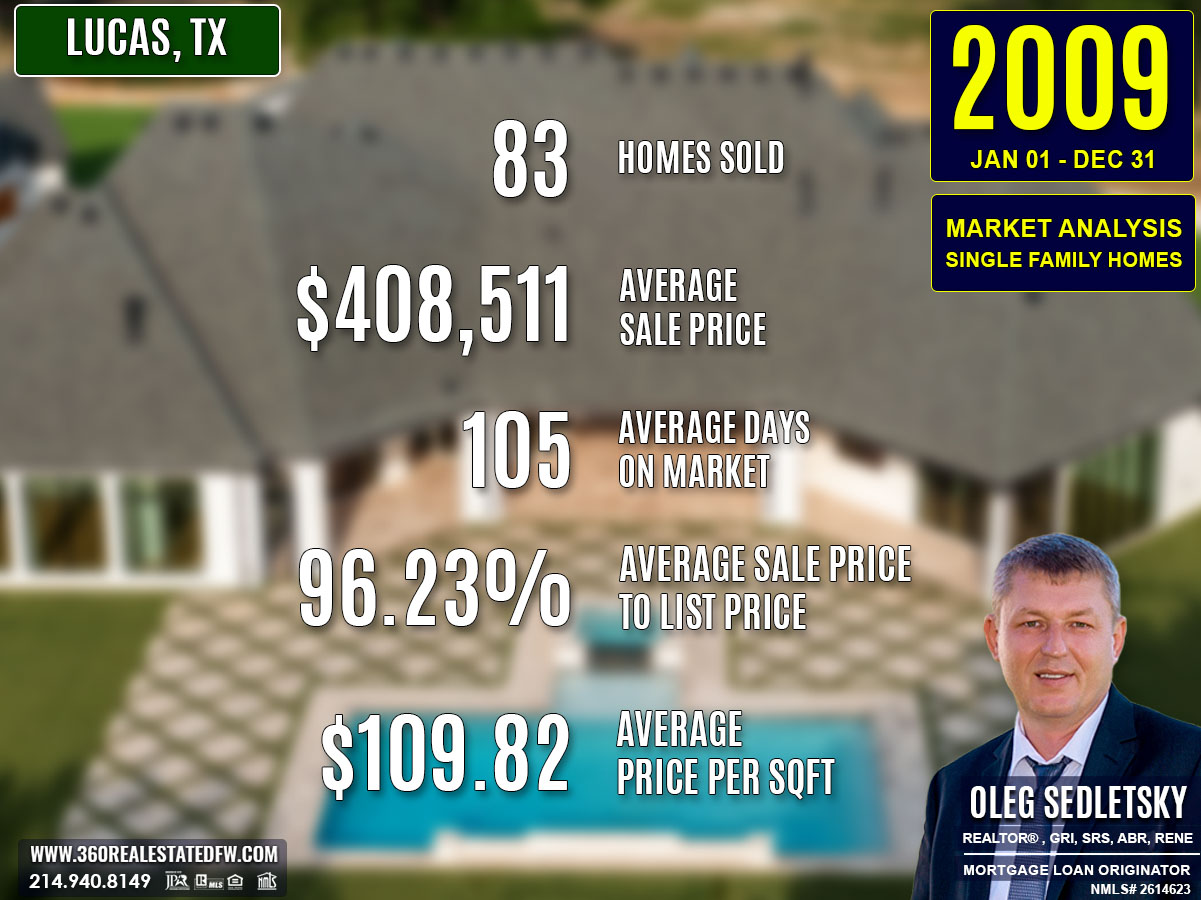
Total Homes Closed
A total of 83 homes closed in 2009, marking slightly higher activity than in 2008’s 80 homes. The year also saw an increase in 27 new construction homes, up from 22 the prior year, suggesting developer confidence. Additionally, 26 homes featured pools, meeting the preferences of leisure-focused buyers.
Property Pricing Insights
The pricing spectrum remained diverse, accommodating both entry-level and premium buyers. Key pricing insights include:
- Minimum Price: $150,000
- Maximum Price: $870,000
- Average Price: $408,511
- Median Price: $402,500
While the average and median prices saw slight rises compared to 2008, premium property sales peaked at $870,000, a decrease from the prior year’s top sale of $1,000,000.
Property Size and Features
The properties in 2009 offered a wide variety of layouts and sizes, enhancing their appeal to buyers:
- Bedrooms: Ranging from 3 to 6 bedrooms, with an average of 4 bedrooms.
- Bathrooms: Most homes included 2 to 6 bathrooms, averaging 4 bathrooms.
- Square Footage: Sizes varied between 1,400 sq. ft. and 6,171 sq. ft., with an average of 3,697 sq. ft. and a median of 3,515 sq. ft.
- Lot Size: Lot sizes extended from 0 to 5.270 acres, with an average size of 1.771 acres. Though the variety in lot size was reduced compared to 2008, properties retained appeal for diverse buyer needs.
Market Dynamics
The dynamics of the 2009 market reflected a mix of buyer interest and seller flexibility:
- Days on Market (DOM): Homes sold in an average of 105 days, compared to 124 days in 2008, indicating faster transactions.
- ClsPr/LstPr Ratio: On average, sellers closed at 96.23% of listed prices, slightly lower than 96.91% the previous year.
- ClsPr/OLP Ratio: The original list price ratio stood at 91.68%, showing continued negotiation or price adjustments.
- Price per Square Foot: The average price per square foot dropped slightly to $109.82, reflecting moderate adjustments in property valuations.
Insights into the Most Expensive Lucas, TX Property Sold in 2009
The most expensive property sold in Lucas during 2009 represented a stunning example of luxury and space. This remarkable home sold for $870,000, offering significant value with its expansive layout and desirable features.
Below are the key highlights of this top-tier listing:
- Price: $870,000
- Beds/Baths: 6 bedrooms, 6 bathrooms (4 full, 2 half)
- Square Footage: 5,624 sq. ft.
- Price per Square Foot: $154.69
- Lot Size: 2.184 acres
- Days on Market (DOM): 85 days
- ClsPr/LstPr Ratio: 96.67%
- ClsPr/OLP Ratio: 91.58%
- Year Built: 2000
This property exemplified the high-end offerings in Lucas, TX and achieved a strong close-price-to-list-price ratio.
Economic context

Average Electricity Costs in Dallas-Fort Worth in 2009
The average electricity price in 2009 dropped to $0.13 per kilowatt-hour, slightly down from $0.14 in 2008. This decrease likely provided a small relief for households, freeing up funds for other expenses or savings. Lower utility costs might have made owning a home more appealing, but the overall economic context also played a major role in influencing housing decisions during this time.
Average Price for Regular Gasoline in Texas in 2009
Gas prices averaged $2.21 per gallon in 2009, a sharp decline from the high $3.12 observed in 2008. This steep drop in fuel costs reduced transportation expenses for homebuyers and renters alike. It may have encouraged homebuyers to consider properties further from urban centers, as commuting became less expensive.
Average 30-Year Fixed Mortgage Rate in 2009
Mortgage rates fell to 5.38% in 2009, down from 6.23% the year prior. This notable decrease in rates played a critical role in keeping the real estate market afloat during a challenging economic period. Homebuyers were strongly advised to secure pre-approval from local mortgage loan originators to confidently make offers and take advantage of favorable rates.
Curious about today’s mortgage rates and the home you can comfortably afford?
Submit a no-obligation mortgage application today and get pre-approved to determine your budget and take the first step toward homeownership with confidence.
Overview of Differences Between the 2008 and 2009 Real Estate Markets in Lucas, Texas
The comparison between Lucas’s 2008 and 2009 real estate markets reveals key shifts in activity, pricing, and market dynamics, reflecting continued buyer interest amid evolving economic conditions.
Total Homes Closed
The number of homes sold increased slightly, from 80 in 2008 to 83 in 2009, indicating steady market activity and transaction growth.
Pricing Insights
- The minimum price rose significantly, from $90,000 in 2008 to $150,000 in 2009, suggesting a shift away from lower-cost options.
- The maximum price dropped from $1,000,000 in 2008 to $870,000 in 2009, showing a decline in luxury sales.
- Both the average price ($408,511) and median price ($402,500) saw slight increases, reflecting consistent mid-tier market strength.
- Price per square foot declined from $113.74 in 2008 to $109.82 in 2009, signaling a slight adjustment in property valuations.
Property Features
- The range of bedrooms and bathrooms shifted, with 2009 homes offering 3 to 6 bedrooms, compared to 2 to 7 in 2008.
- Square footage expanded, with maximum sizes growing from 5,672 sq. ft. in 2008 to 6,171 sq. ft. in 2009, while the average also increased to 3,697 sq. ft.
- Lot sizes saw a reduction in their upper limit, with a maximum of 5.270 acres in 2009, compared to 33.600 acres in 2008, indicating fewer large lots.
Market Dynamics
- Days on Market (DOM): Homes moved faster in 2009, with the average DOM dropping to 105 days, compared to 124 days in 2008.
- ClsPr/LstPr Ratio: Sellers achieved 96.23% of listing prices in 2009, slightly less than the 96.91% seen in 2008, reflecting minor pricing adjustments.
- ClsPr/OLP Ratio: The 91.68% ratio in 2009 marked a continued decrease from 93.49% in 2008, signaling greater negotiation leverage for buyers.
Outliers and Trends
- While 2008 saw a record $1,000,000 luxury sale, 2009’s most expensive property sold for $870,000, with fewer high-end sales.
- Pool homes rebounded, rising from 21 in 2008 to 26 in 2009, showcasing continued interest in leisure-driven properties.
- The number of new construction homes increased again, with 27 homes in 2009, up from 22 the previous year, supporting sustained builder activity.
Economic Context
The average mortgage rate fell significantly, from 6.23% in 2008 to 5.38% in 2009, likely aiding affordability and driving increased mid-tier sales.
Key Takeaways
The 2009 real estate market in Lucas, Texas saw stability and growth driven by surging mid-tier activity, shorter market cycles, and consistent pricing efficiency. The modest decline in luxury sales was countered by a rebound in pool homes and new construction, while lower rates supported reliable market demand.
Summary of Real Estate Market Analysis for Lucas, TX in 2009
The 2009 real estate market in Lucas, Texas reflected a robust blend of stability and growth, catering to a diverse array of buyers. With higher sales volumes, shorter transaction times, and a rising inventory of modern constructions, the market demonstrated resilience and adaptability despite broader economic uncertainties.
Balanced pricing and steady demand for leisure-focused amenities like pool homes ensured appeal across income brackets, while significant reductions in mortgage rates enhanced affordability. Lucas’s ability to offer spacious properties, varied price points, and efficient sales underscored its strength as a vibrant real estate market capable of meeting evolving buyer preferences while maintaining overall market consistency.
The Importance of Statistical Data in Lucas, Texas Real Estate Market
Did you know that appraisers and Realtors rely on historical statistical data to determine a property’s current value?
Analyzing historical market data is essential for making informed decisions in today’s real estate market. Examining past trends provides valuable insights that facilitate accurate pricing, more strategic negotiations, and a comprehensive understanding of market dynamics.
Unlock Exceptional Service!
Assistance with all your real estate needs in the Dallas-Fort Worth area is just a click or call away. Reach out at 214-940-8149 or connect through the links below.
Greetings! I’m Oleg Sedletsky, and I’m excited to introduce myself as your go-to full-time licensed Texas REALTOR® and Mortgage Loan Originator.
I proudly represent JPAR® – Real Estate Brokerage as a REALTOR® and Utopia Mortgage LLC as a Mortgage Loan Originator! My designations and certifications reflect my dedication to helping you achieve your real estate goals in Lucas, TX and other locations in the vibrant Dallas-Fort Worth area!
My commitment to ongoing professional development means I’m always enhancing my skills to serve you better. You can count on me as your trusted expert throughout your real estate journey. Plus, I’m fluent in English, Ukrainian, and Russian and ready to assist you every step of the way!
It’s All About You and Your Real Estate Goals!
My mission is to serve you! With my knowledge and expertise, I’m here to help you achieve all your real estate goals!
I’m passionate about helping buyers and sellers navigate the exciting real estate landscape in Lucas, Texas! Whether you’re searching for your dream home, exploring land options, or looking for commercial properties, my Real Estate Services have you covered.
Contact me today for all your real estate needs in Lucas, Texas! Call/text 214-940-8149
A Comprehensive Analysis of Single-Family Residential Housing Market in Lucas, TX: 2003 to Present
2003-2010
Lucas, TX Real Estate Market Report 2003: Analysis and Trends
Lucas, TX Real Estate Market Report 2004: Analysis and Trends
Lucas, TX Real Estate Market Report 2005: Analysis and Trends
Lucas, TX Real Estate Market Report 2006: Analysis and Trends
Lucas, TX Real Estate Market Report 2007: Analysis and Trends
Lucas, TX Real Estate Market Report 2008: Analysis and Trends
Lucas, TX Real Estate Market Report 2009: Analysis and Trends
Lucas, TX Real Estate Market Report 2010: Analysis and Trends
2011-2020
Lucas, TX Real Estate Market Report 2011: Analysis and Trends
Lucas, TX Real Estate Market Report 2012: Analysis and Trends
Lucas, TX Real Estate Market Report 2013: Analysis and Trends
Lucas, TX Real Estate Market Report 2014: Analysis and Trends
Lucas, TX Real Estate Market Report 2015: Analysis and Trends
Lucas, TX Real Estate Market Report 2016: Analysis and Trends
Lucas, TX Real Estate Market Report 2017: Analysis and Trends
Lucas, TX Real Estate Market Report 2018: Analysis and Trends
Lucas, TX Real Estate Market Report 2019: Analysis and Trends
Lucas, TX Real Estate Market Report 2020: Analysis and Trends
This market analysis is intended solely for educational purposes. This market analysis is based on data sourced from NTREIS, Inc. This analysis is exclusively focused on single-family homes and does not account for other property types. The total number of real estate transactions within the specified period and location may vary. Data accuracy cannot be guaranteed due to potential input errors made by NTREIS users. This market analysis does not account for all new construction home sales. If you need detailed information about recorded property sales or other public records, please contact the appropriate city or county office.
Lucas, TX Real Estate: A Comprehensive Analysis of the 2008 Single-Family Residential Housing Market
The 2008 real estate market in Lucas, Texas experienced a notable increase in activity, with 80 homes closed, the most in recent years. This growth reflects strong demand and the market’s ability to adapt to evolving buyer preferences despite global economic uncertainties. The year offered broad diversity, catering to mid-range buyers and high-end luxury investors alike, with a range of property sizes, prices, and amenities.
Key Takeaways and Trends from Lucas’s 2008 Real Estate Market
Pricing Range: The year presented a wide spectrum of price offerings, from an accessible $90,000 to a record $1,000,000, serving buyers across different economic brackets. While maximum prices set new records, slight declines in average and per-square-foot pricing suggest selective buyer prioritization.
Market Efficiency: Extended average listing times (124 DOM) and reduced ClsPr/OLP ratios (93.49%) painted a picture of a slower, more cautious market where sellers needed to adapt pricing to seal deals effectively.
Unique Outliers:
- The most expensive property sold set new standards but underscored price adjustments in the luxury sector.
- The notable increase in new construction homes (22 compared to 8 in 2007) rejuvenated inventory options, catering to modern buyers.
- Homes featuring pools dropped slightly to 21 homes, but the amenity remained popular for leisure-focused buyers.
Mortgage Rates Impact: Although the average mortgage rate dipped to 6.23%, broader economic pressures created variability in buyer behavior, reflected in extended DOM and the slight drop in average prices.
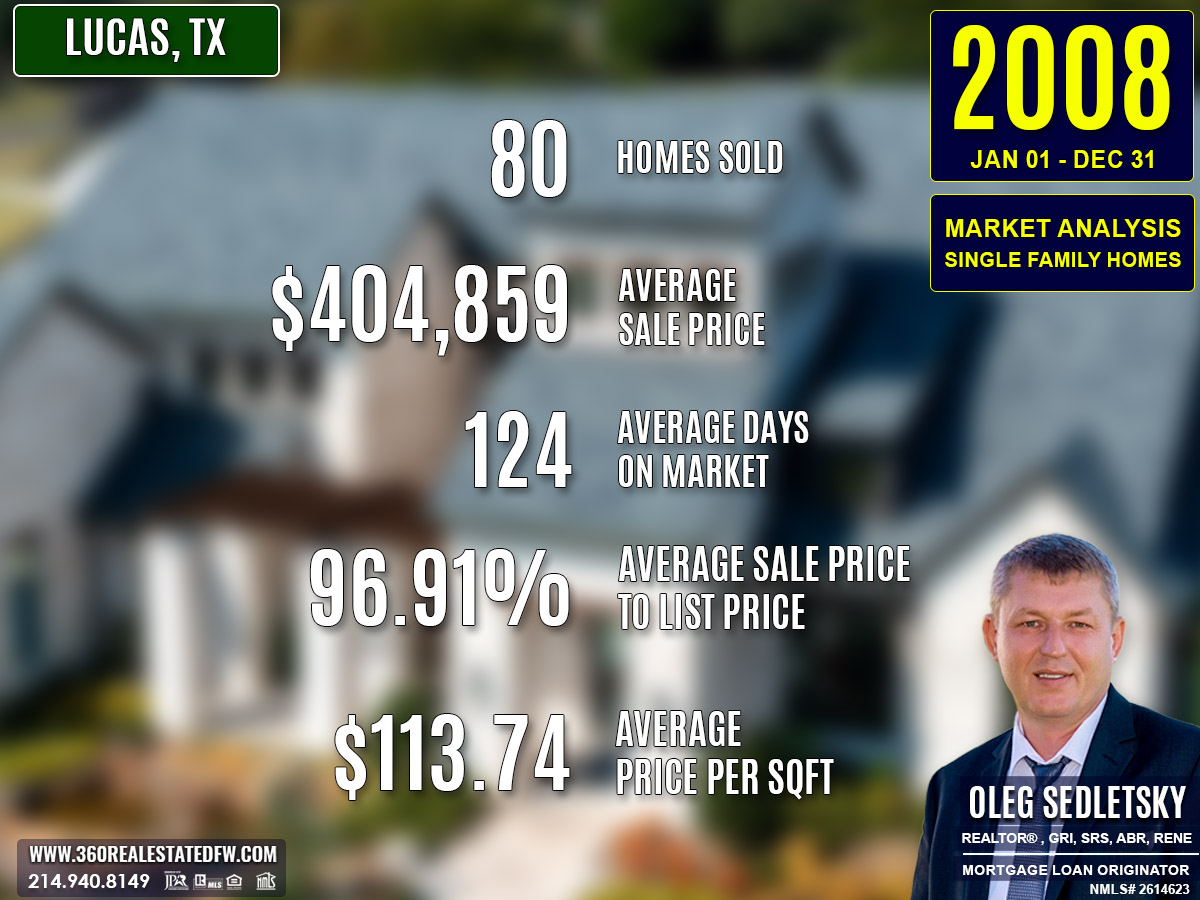
Total Homes Closed
A total of 80 homes closed in 2008, signaling an upswing in transactions compared to 71 in 2007. Among these were 21 homes with pools, highlighting the sustained popularity of leisure-centered properties. Additionally, 22 new construction homes hit the market, a significant jump from the previous year’s 8, suggesting a revival in builder activity and new inventory.
Property Pricing Insights
The pricing of homes in 2008 demonstrated broad affordability alongside high-end luxury options. Key insights include:
- Minimum Price: $90,000
- Maximum Price: $1,000,000
- Average Price: $404,859
- Median Price: $370,450
The upper limit reflected lateral growth in the luxury segment, while average and median figures showed slight stabilization compared to 2007. However, the market’s value per size decreased slightly, with an average price per square foot of $113.74.
Property Size and Features
The diversity of property features expanded noticeably in 2008, offering options for a wide variety of buyers:
- Bedrooms: Ranged from 2 to 7, with an average of 4 bedrooms.
- Bathrooms: Homes offered between 2 and 6 bathrooms, averaging 4 bathrooms.
- Square Footage: Property sizes spanned from 892 sq. ft. to 5,672 sq. ft., with an average of 3,553 sq. ft. and a median of 3,520 sq. ft.
- Lot Sizes: Lot areas ranged broadly from 0 acres to a striking 33.600 acres, averaging 1.940 acres. Larger lot sizes were highly attractive to buyers seeking space and privacy.
Market Dynamics
The 2008 market was characterized by extended listing periods and pricing stability:
- Days on Market (DOM): Homes sold in an average of 124 days, up from 72 days in 2007. This reflected slower turnover influenced by broader economic tension.
- ClsPr/LstPr Ratio: Sellers closed at 96.91% of listed prices, on par with the previous year, showcasing effective pricing.
- ClsPr/OLP Ratio: This metric fell slightly to 93.49%, revealing moderate pricing adjustments and negotiation margins.
- Price per Square Foot: Average pricing per square foot settled at $113.74, showcasing a slight decline in perceived property value.
Insights into the Most Expensive Lucas, TX Property Sold in 2008
The most expensive property sold in Lucas during 2008 was a remarkable luxury estate that combined expansive living space with vast outdoor acreage. This home, sold for $1,000,000, set a new benchmark in the local market. Its notable features exemplify high-end living, although the final sale reflected adjustments in the luxury segment.
Below are the key metrics of this property:
- Price: $1,000,000
- Beds/Baths: 5 bedrooms, 3 bathrooms
- Square Footage: 3,872 sq. ft.
- Price per Square Foot: $258.26
- Lot Size Area: 33.600 acres
- Days on Market (DOM): 98 days
- ClsPr/LstPr Ratio: 71.58%
- ClsPr/OLP Ratio: 71.58%
- Year Built: 1987
This home stood out for its luxurious design and expansive outdoor space, though the reduced ClsPr/LstPr and ClsPr/OLP ratios suggest significant price negotiation compared to its initial listing.
Economic context
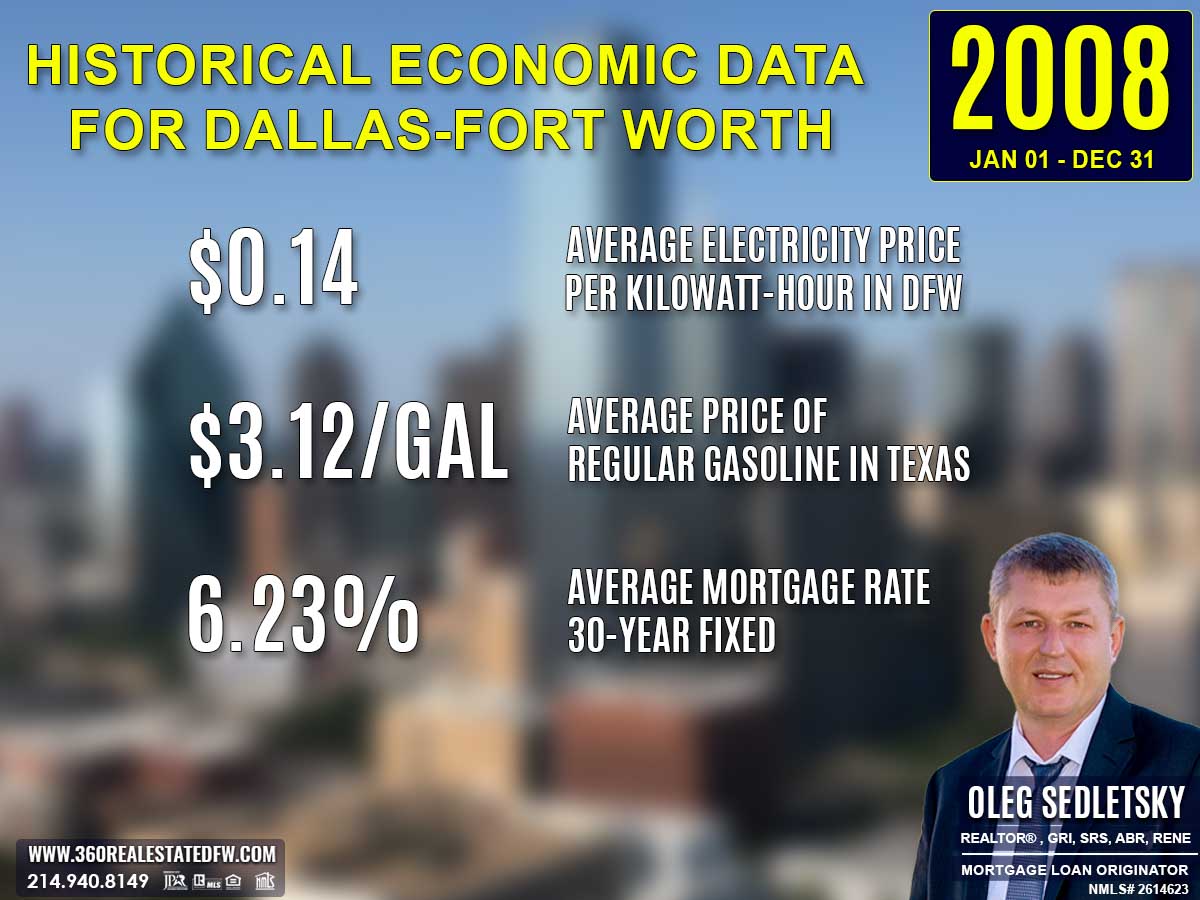
Average Electricity Costs in Dallas-Fort Worth in 2008
The average electricity price rose marginally to $0.14 per kilowatt-hour in 2008, up from $0.13 in 2007. While this small increase might not have drastically influenced housing decisions, it further emphasized the need for cost-saving measures like energy-efficient appliances and alternative energy sources in residential properties.
Average Price for Regular Gasoline in Texas in 2008
Gas prices surged to $3.12 per gallon in 2008, marking a sharp rise from $2.66 in 2007. Such high gas prices applied significant pressure to household transportation budgets. Homebuyers increasingly weighed commute costs against housing prices, which may have boosted demand for inner-city or transit-friendly properties.
Average 30-Year Fixed Mortgage Rate in 2008
Mortgage rates eased slightly to 6.23% in 2008, down from 6.40% the prior year. This marginal decline helped offset rising fuel and utility costs for homebuyers, although the overall budgetary environment remained tight. Homebuyers were advised to consult local mortgage loan originators to carefully evaluate their borrowing capacity amid changing market conditions.
Curious about today’s mortgage rates and the home you can comfortably afford?
Submit a no-obligation mortgage application today and get pre-approved to determine your budget and take the first step toward homeownership with confidence.
Overview of Differences Between the 2007 and 2008 Real Estate Markets in Lucas, Texas
The comparison between Lucas’s 2007 and 2008 real estate markets highlights significant shifts in sales activity, pricing trends, property features, and market dynamics, revealing the impacts of economic and buyer behavior changes.
Total Homes Sold
The number of homes sold increased from 71 in 2007 to 80 in 2008, reflecting stronger sales activity and slightly higher transaction volumes.
Pricing Trends
The minimum price decreased from $96,900 in 2007 to $90,000 in 2008, indicating increased affordability in entry-level homes.
The maximum price rose from $989,000 in 2007 to a landmark $1,000,000 in 2008, highlighting growth in the luxury housing sector.
However, the average price fell slightly from $412,511 in 2007 to $404,859 in 2008, alongside a marginal decline in the median price, suggesting stabilization in overall market pricing.
The price per square foot dropped from $120.87 in 2007 to $113.74 in 2008, signaling a dip in property value per size.
Property Features
The range of bedroom and bathroom configurations remained consistent, with homes offering up to 7 bedrooms and 6 bathrooms, while the average remained at 4 bedrooms and 4 bathrooms.
Square footage saw a broader range, with minimum sizes shrinking from 1,380 sq. ft. in 2007 to 892 sq. ft. in 2008, while the average increased to 3,553 sq. ft..
Lot size areas expanded dramatically, with the maximum growing from 7.350 acres in 2007 to 33.600 acres in 2008, reflecting more large-scale properties entering the market.
Market Dynamics
Days on Market (DOM): The average DOM climbed from 72 days in 2007 to 124 days in 2008, indicating slower sales and extended listing periods.
ClsPr/LstPr Ratio: The percentage of the closed price to listing price increased marginally from 96.89% in 2007 to 96.91% in 2008, showing consistent pricing efficiency.
ClsPr/OLP Ratio: The ratio of closed price to the original listing price fell from 95.90% in 2007 to 93.49% in 2008, reflecting slightly reduced pricing alignment and discounts.
Outliers and Trends
Luxury Market High: The most expensive sale of $1,000,000 in 2008 marked a new peak, accentuated by an expanded 33.600-acre lot size, towering over the previous year’s maximum lot size of 7.350 acres.
Pools and New Construction: The number of homes with pools fell slightly from 24 in 2007 to 21 in 2008, while new construction homes increased significantly from 8 to 22, indicating rejuvenated builder activity.
Economic Context
The average mortgage rate dropped slightly to 6.23% in 2008 from 6.40% in 2007, potentially aiding affordability, though the economic climate contributed to variability in sales and listing durations.
Key Takeaways
The 2008 market showed a mix of growth, affordability, and challenges, with stronger sales volumes and notable outliers in the luxury segment. However, longer selling periods and broader price variability illustrated a market navigating changing economic conditions while broadening its property offerings.
Summary of Real Estate Market Analysis for Lucas, TX in 2008
The 2008 real estate market in Lucas, Texas demonstrated resilience and adaptability amidst shifting economic conditions. Maintaining a record 80 homes sold, the market achieved a balance between affordability and luxury, offering diverse options to meet the needs of a wide range of buyers. With a strong focus on modern inventory through 22 new construction homes, alongside an uptick in expansive lot sizes and unique listings, the market showcased an ability to evolve with buyer preferences.
Although longer average sales cycles hinted at cautious decision-making, steady pricing strategies reflected confidence in market values. By balancing affordability, spacious property options, and luxury benchmarks, Lucas’s real estate market of 2008 underscored its versatility and promise for sustained growth.
The Importance of Statistical Data in Lucas, Texas Real Estate Market
Did you know that appraisers and Realtors rely on historical statistical data to determine a property’s current value?
Analyzing historical market data is essential for making informed decisions in today’s real estate market. Examining past trends provides valuable insights that facilitate accurate pricing, more strategic negotiations, and a comprehensive understanding of market dynamics.
Unlock Exceptional Service!
Assistance with all your real estate needs in the Dallas-Fort Worth area is just a click or call away. Reach out at 214-940-8149 or connect through the links below.
Greetings! I’m Oleg Sedletsky, and I’m excited to introduce myself as your go-to full-time licensed Texas REALTOR® and Mortgage Loan Originator.
I proudly represent JPAR® – Real Estate Brokerage as a REALTOR® and Utopia Mortgage LLC as a Mortgage Loan Originator! My designations and certifications reflect my dedication to helping you achieve your real estate goals in Lucas, TX and other locations in the vibrant Dallas-Fort Worth area!
My commitment to ongoing professional development means I’m always enhancing my skills to serve you better. You can count on me as your trusted expert throughout your real estate journey. Plus, I’m fluent in English, Ukrainian, and Russian and ready to assist you every step of the way!
It’s All About You and Your Real Estate Goals!
My mission is to serve you! With my knowledge and expertise, I’m here to help you achieve all your real estate goals!
I’m passionate about helping buyers and sellers navigate the exciting real estate landscape in Lucas, Texas! Whether you’re searching for your dream home, exploring land options, or looking for commercial properties, my Real Estate Services have you covered.
Contact me today for all your real estate needs in Lucas, Texas! Call/text 214-940-8149
A Comprehensive Analysis of Single-Family Residential Housing Market in Lucas, TX: 2003 to Present
2003-2010
Lucas, TX Real Estate Market Report 2003: Analysis and Trends
Lucas, TX Real Estate Market Report 2004: Analysis and Trends
Lucas, TX Real Estate Market Report 2005: Analysis and Trends
Lucas, TX Real Estate Market Report 2006: Analysis and Trends
Lucas, TX Real Estate Market Report 2007: Analysis and Trends
Lucas, TX Real Estate Market Report 2008: Analysis and Trends
Lucas, TX Real Estate Market Report 2009: Analysis and Trends
Lucas, TX Real Estate Market Report 2010: Analysis and Trends
2011-2020
Lucas, TX Real Estate Market Report 2011: Analysis and Trends
Lucas, TX Real Estate Market Report 2012: Analysis and Trends
Lucas, TX Real Estate Market Report 2013: Analysis and Trends
Lucas, TX Real Estate Market Report 2014: Analysis and Trends
Lucas, TX Real Estate Market Report 2015: Analysis and Trends
Lucas, TX Real Estate Market Report 2016: Analysis and Trends
Lucas, TX Real Estate Market Report 2017: Analysis and Trends
Lucas, TX Real Estate Market Report 2018: Analysis and Trends
Lucas, TX Real Estate Market Report 2019: Analysis and Trends
Lucas, TX Real Estate Market Report 2020: Analysis and Trends
This market analysis is intended solely for educational purposes. This market analysis is based on data sourced from NTREIS, Inc. This analysis is exclusively focused on single-family homes and does not account for other property types. The total number of real estate transactions within the specified period and location may vary. Data accuracy cannot be guaranteed due to potential input errors made by NTREIS users. This market analysis does not account for all new construction home sales. If you need detailed information about recorded property sales or other public records, please contact the appropriate city or county office.